Market Overview
| Study Period | 2020 - 2031 |
|---|---|
| Forecast Data Period | 2026 - 2031 |
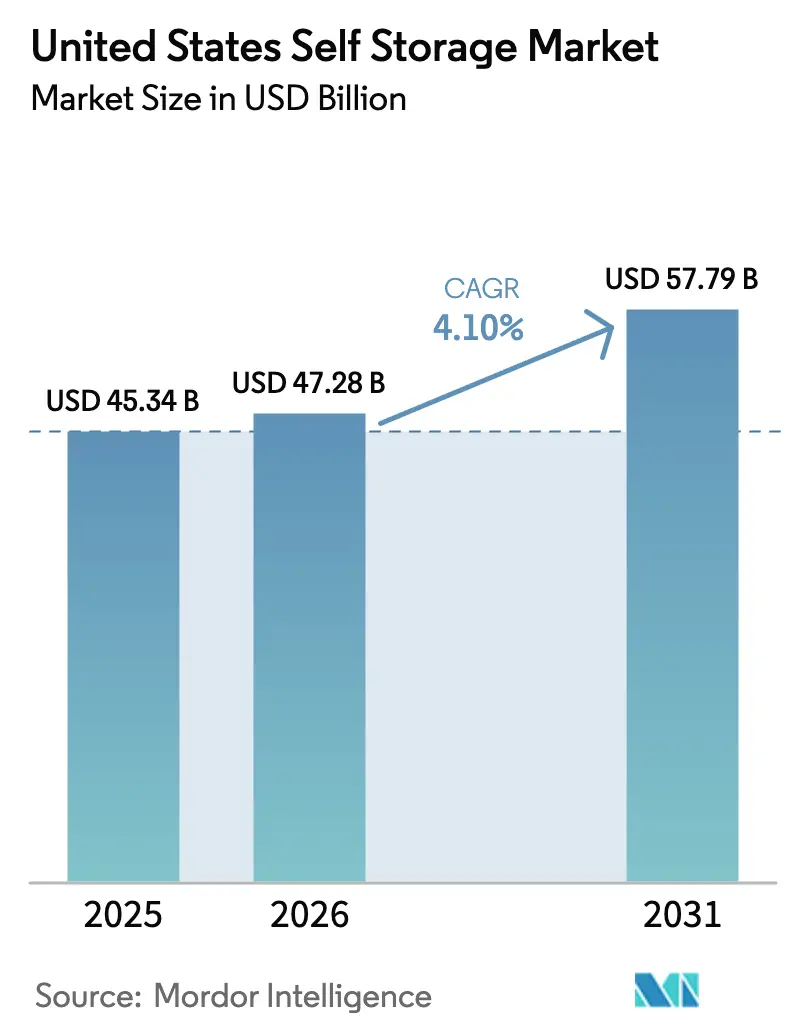
| Base Year Market Size (2025) | USD 45.34 Billion |
| Market Size (2026) | USD 47.28 Billion |
| Market Size (2031) | USD 57.79 Billion |
| Growth Rate (2026 - 2031) | 4.10% CAGR |
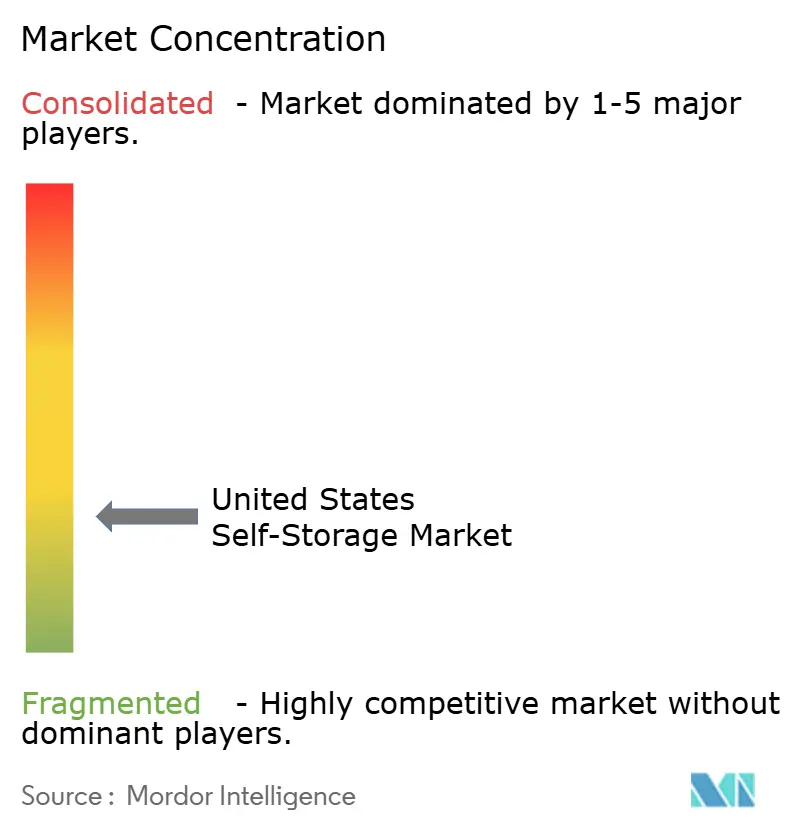
| Market Concentration | Medium |
Major Players *Disclaimer: Major Players sorted in no particular order Image © Mordor Intelligence. Reuse requires attribution under CC BY 4.0. | |
United States Self Storage Market Analysis by Mordor Intelligence
The United States Self Storage Market size is expected to grow from USD 45.34 billion in 2025 to USD 47.28 billion in 2026 and is forecast to reach USD 57.79 billion by 2031 at 4.10% CAGR over 2026-2031.
Structural shifts rather than cyclical swings underpin this expansion, as e-commerce fulfillment footprints run roughly three times larger than those of traditional retail, driving persistent micro-warehousing demand that spills into facility leases. Residential mobility slipped to 11.8% in 2024, yet absolute relocations still generate brisk short-term rental velocity across metro clusters. Adaptive reuse of distressed retail and office stock is accelerating, with office values falling 23% while self-storage sale prices rose 31% year-over-year in Q1 2025, signaling capital reallocation toward conversions. Meanwhile, climate-controlled unit rates expanded across 17 of the 30 largest metropolitan areas even as standard-unit pricing stagnated, underscoring a growing premium segment.
Key Report Takeaways
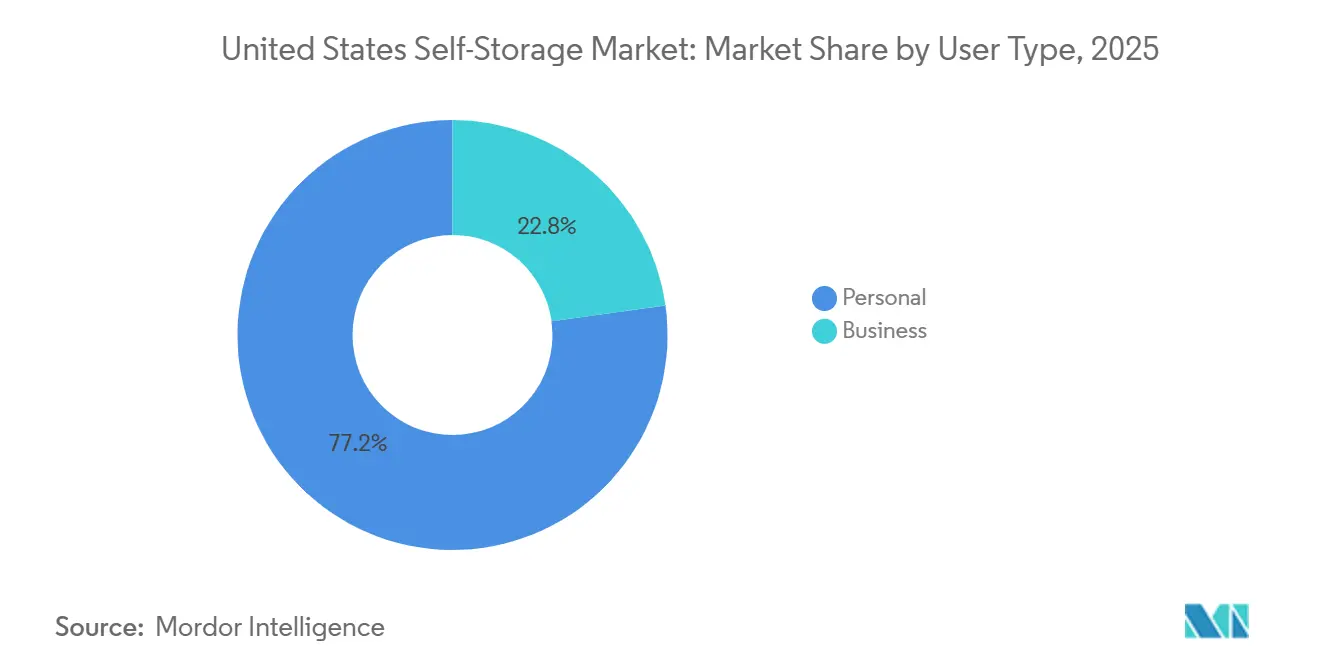
- By user type, personal renters held 77.19% of the United States self-storage market share in 2025, while the business segment is forecast to register the fastest 4.89% CAGR through 2031.
- By unit size, 10 × 10-foot lockers led with 35.57% revenue share in 2025; climate-controlled lockers are projected to expand at a 5.11% CAGR to 2031.
- By property type, purpose-built facilities commanded 91.94% of 2025 revenue, but converted commercial buildings are advancing at a 5.89% CAGR over the forecast horizon.
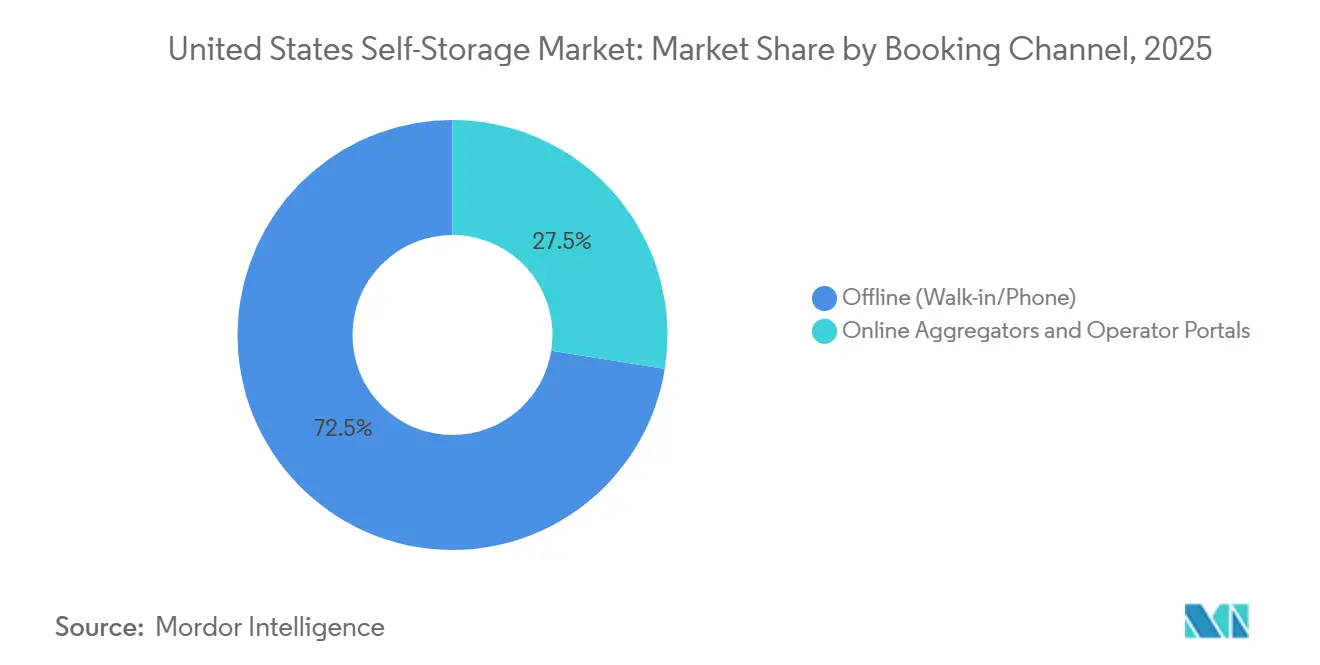
- By booking channel, offline walk-in and phone reservations accounted for 72.49% of 2025 transactions; online aggregators and operator portals are rising at a 4.57% CAGR.
- By end-use duration, rentals of six months or more generated 60.37% of 2025 revenue, whereas short-term contracts are poised for a 5.94% CAGR through 2031.
Note: Market size and forecast figures in this report are generated using Mordor Intelligence’s proprietary estimation framework, updated with the latest available data and insights as of January 2026.
United States Self Storage Market Trends and Insights
Drivers Impact Analysis*
| Driver | (~) % Impact on CAGR Forecast | Geographic Relevance | Impact Timeline |
|---|---|---|---|
| Increased Urbanization and Shrinking Dwelling Size | +0.9% | National, concentrated in coastal metros and Sun Belt cities | Medium term (2-4 years) |
| Growth in E-commerce Micro-Fulfillment Demand | +1.1% | National, with highest intensity in last-mile logistics hubs | Long term (≥ 4 years) |
| Rising Residential Mobility and Migration Rates | +0.7% | National, elevated in Texas, Florida, Arizona, North Carolina | Short term (≤ 2 years) |
| Adaptive Reuse of Distressed Retail/Office Assets | +0.8% | Urban cores and first-ring suburbs with high vacancy rates | Medium term (2-4 years) |
| Emergence of On-Demand Valet Storage Platforms | +0.3% | Dense urban markets (New York, San Francisco, Los Angeles) | Long term (≥ 4 years) |
| Weather-Related Loss-Mitigation Storage Needs | +0.4% | Hurricane corridors (Southeast, Gulf Coast), wildfire zones (West Coast) | Short term (≤ 2 years) |
| Source: Mordor Intelligence | |||


Increased Urbanization and Shrinking Dwelling Size
Median new single-family homes measured 2,146 square feet in 2024, down from prior peaks, while apartment footprints contracted in major metros as developers maximized unit counts per parcel. A Self Storage Association study counted 16.68 million household renters in 2024, lifting penetration to 12.6% from 11.1% in 2022.[1]Self Storage Association, “2025 Demand Study,” selfstorage.org Millennials account for roughly 40% of renters, and 78% value round-the-clock access, with over one-third willing to pay premium rates for extended hours. Tight zoning caps floor-area ratios in cities such as New York and San Francisco, perpetuating housing scarcity and sustaining demand for off-site storage. Collectively, these forces funnel urban households toward rental units for seasonal gear, furniture, and hobby equipment, reinforcing a steady uptake trajectory for the United States self-storage market.
Growth in E-commerce Micro-Fulfilment Demand
Prologis estimates e-commerce absorbs three times the logistics square footage of brick-and-mortar retail, with total take-up projected at 250 to 350 million square feet by 2030.[2]Prologis, “E-commerce and Logistics Real Estate,” prologis.com Small sellers unable to secure dedicated warehouses increasingly lease climate-controlled units near urban delivery nodes to shave last-mile transit times. Business renters prioritize flexible lease terms, 24-hour entry, and loading-dock access, prompting operators to retrofit sites with wider drive aisles and roll-up doors. The business segment’s 4.89% forecast CAGR signals that tailoring contracts and amenities for commercial tenants can unlock an outsized share of near-term growth within the United States self-storage market. Contractors and tradespeople storing tools between jobs further diversify revenue streams and lengthen average lease duration.
Adaptive Reuse of Distressed Retail or Office Assets
Office values fell 23% while self-storage asset prices rose 31% year-over-year in Q1 2025, creating arbitrage for investors converting languishing properties into storage. A 7.3-million-square-foot portfolio in Chicago illustrates how adaptive reuse bypasses lengthy greenfield entitlements while leveraging existing HVAC and structural systems. Municipalities often expedite permits to revive blighted assets, shortening time-to-market and moderating upfront capital needs. The approach delivers faster capacity additions in supply-constrained cores, bolstering the United States self-storage market without the land-acquisition friction that plagues new builds. Investors benefit from compressed development cycles and lower tenant-improvement outlays, improving project returns even amid rising interest rates.
Rising Residential Mobility and Migration Rates
Despite a national mobility dip to 11.8% in 2024, population growth keeps the absolute number of movers high. Interstate migration into Texas, Florida, Arizona, and North Carolina fuels storage demand during housing transitions. Households often rent units for three to four months while bridging closing timelines or downsizing, and many convert to long-term users after experiencing off-site convenience. Remote-work flexibility decouples jobs from locations, enabling more frequent relocations and reinforcing transient storage requirements. These dynamics collectively add resilience to the United States self-storage market by broadening the renter base beyond life-event peaks.
Restraints Impact Analysis*
| Restraint | (~) % Impact on CAGR Forecast | Geographic Relevance | Impact Timeline |
|---|---|---|---|
| Zoning and Land-Use Restrictions in Urban Cores | -0.6% | Dense urban markets with restrictive zoning (New York, San Francisco, Boston) | Long term (≥ 4 years) |
| Escalating Land and Construction Costs | -0.8% | National, most acute in high-cost coastal metros | Medium term (2-4 years) |
| ESG Scrutiny on Energy-Intensive Climate Units | -0.3% | National, with heightened focus in states with energy benchmarking mandates | Long term (≥ 4 years) |
| Margin Pressure from REIT Consolidation Wave | -0.5% | National, impacting independent operators and smaller regional chains | Short term (≤ 2 years) |
| Source: Mordor Intelligence | |||
Escalating Land and Construction Costs
Land and building expenses have risen 40-50% since 2017, squeezing development yields and pushing target cap rates to 5.75-8.0% for new projects.[3]Newmark, “2025 Self-Storage Almanac,” nmrk.com Material shortages and labor constraints extend build times, undermining pro-forma assumptions. Many operators now favor portfolio acquisitions over ground-up developments, as illustrated by the USD 12.7 billion Extra Space–Life Storage merger that added more than 1,200 properties without construction risk. Higher interest rates further inflate financing costs, discouraging speculative projects. Collectively, these factors temper supply growth in the United States self-storage market and magnify the appeal of adaptive reuse.
Zoning and Land-Use Restrictions in Urban Cores
Municipal zoning often slots self-storage into industrial use categories, barring it from mixed-use or residential zones where demand concentrates. Entitlement processes can stretch beyond 18 months in New York, San Francisco, and Boston, piling carrying costs onto developers. Community pushback focuses on traffic and land-use priorities, leading to protracted hearings and conditional permits. Operators therefore pivot toward conversions of existing structures, which still demand fire-code upgrades and ADA compliance that elevate budgets. Such regulatory frictions dampen new-supply velocity in the heart of the United States self-storage market, fostering localized shortages and supporting rent premiums.
*Our forecasts treat driver/restraint impacts as directional, not additive. The impact forecasts reflect baseline growth, mix effects, and variable interactions.
Segment Analysis
By User Type: Business Segment Builds Momentum amid Micro-Fulfillment Needs
Business tenants are forecast to expand at a 4.89% CAGR from 2026 to 2031, outpacing overall market growth as e-commerce sellers, contractors, and service firms repurpose units for inventory staging and equipment storage. Personal users still anchored 77.19% of 2025 revenue, relying on facilities during moves, seasonal storage, and life events. Commercial renters value 24-hour access, loading docks, and security sensors, prompting operators to invest in IoT-enabled monitoring systems that raise capital intensity but boost retention.
The diversification toward commercial users reduces reliance on relocation cycles, lengthens average lease terms, and raises price tolerance, enhancing cash-flow stability for the United States self-storage market. Contractors parking tools and materials between job sites likewise broaden demand across economic sectors. Operators tailoring offerings such as package-receipt services or electrical outlets for device charging stand to capture a disproportionate share of the expanding business segment within the United States self-storage industry.

By Unit Size: Climate-Controlled Lockers Lead Premium Uptake
The 10 × 10-foot format commanded 35.57% of 2025 revenue, serving as the workhorse for household moves and seasonal needs. Yet climate-controlled lockers are projected to grow at a 5.11% CAGR through 2031 as urban renters pay premiums to protect electronics, documents, and collectibles. In April 2025 climate-controlled rents climbed across 17 of the 30 largest metros while standard rates stagnated, highlighting a bifurcated market.
Operators retrofit ambient units with dehumidifiers and LED lighting, capturing higher rents and boosting the United States self-storage market size tied to premium inventory. Smart lockers with environmental sensors let tenants track temperature via mobile apps, appealing to millennials and Gen Z customers. The shift underscores a strategic thrust toward value-added features rather than mere square footage, allowing operators to defend margins even as commodity pricing plateaus.
By Property Type: Converted Buildings Gain Share Amid Adaptive Reuse
Purpose-built facilities held 91.94% of 2025 revenue thanks to optimized layouts and drive-up access. Converted commercial buildings, however, are set for the fastest 5.89% CAGR as investors capitalize on discounted retail and office assets. Office prices slid 23% year-over-year in Q1 2025, while storage facilities rose 31%, underscoring the conversion upside.
Adaptive reuse fast-tracks supply additions in zoning-restricted metros, strengthening the United States self-storage market by filling gaps where greenfield projects stall. Leveraging existing HVAC and structural shells reduces tenant-improvement costs and cuts development timelines, enabling quicker cash-flow generation. While purpose-built sites remain dominant in suburban zones, converted assets will command a growing slice of incremental capacity through 2031.
By Booking Channel: Digital Platforms Propel Contactless Leasing
Offline walk-in and phone reservations still accounted for 72.49% of 2025 transactions, but online aggregators and operator portals are forecast to post a 4.57% CAGR. Technology suites from firms such as Storable integrate revenue optimization and automated leasing to cut labor overhead.
Digital-first renters seek instant pricing, virtual tours, and mobile payments, shifting acquisition economics within the United States self-storage market. Aggregators boost price transparency yet broaden reach, funneling leads to digitally equipped operators. Facilities lacking seamless web experiences risk occupancy erosion as the channel mix tilts toward online bookings through 2031.
By End-Use Duration: Short-Term Rentals Surge on Weather and Workforce Mobility
Contracts shorter than six months are set to grow at a 5.94% CAGR, fueled by hurricane- and wildfire-related displacements and transient work patterns. Long-term leases still generated 60.37% of 2025 revenue, providing baseline stability. Hurricanes Helene and Milton drove temporary occupancy spikes across Florida and the Southeast in late 2024, though FEMA recovery timelines can outlast typical lease terms.
Operators deploy introductory discounts to capture short-term tenants, then escalate renewals to protect yield. A share of these customers converts to long-term users, lifting lifetime value and enhancing the resilience of the United States self-storage market against episodic demand swings.
Geography Analysis
Sun Belt states such as Texas, Florida, Arizona, and North Carolina absorb outsized demand as inbound migration sustains household formation and relocation activity. Coastal metros like New York, San Francisco, and Los Angeles face acute land scarcity and stringent zoning, steering supply expansion toward adaptive reuse instead of greenfield builds.
Hurricane corridors along the Southeast and Gulf Coast deliver episodic occupancy spikes after major storms, as seen following Hurricanes Helene and Milton, yet revenue volatility arises when FEMA recovery outlasts short-term leases. Wildfire-prone zones in California and the Pacific Northwest exhibit similar seasonal swings tied to evacuation orders. Midwest and Rust Belt markets post steadier, if slower, growth thanks to lower land costs that sustain attractive cap rates for developers.
Penetration remains below national averages in rural and exurban areas, inviting container-based or mobile solutions that match flexible demand profiles. Climate-controlled rate growth in 17 of the 30 largest metros underscores a premium tilt concentrated in dense urban cores. Major REITs cluster facilities in metros over 500,000 residents, leveraging brand stature, while regional operators excel in secondary cities by tailoring unit mixes, highlighting a geographic duality that will persist through 2031.
Competitive Landscape
The July 2024 merger of Extra Space Storage and Life Storage formed a USD 12.7 billion portfolio exceeding 3,600 facilities, narrowing the gap with Public Storage’s 2,900-site network and intensifying competition. REIT consolidation compresses margins for independents that lack dynamic pricing tools and marketing scale. National operators wield proprietary algorithms adjusting rents by occupancy trends and competitor actions, while small owners still rely on manual rate cards.
Technology adoption now defines competitive edges, with IoT climate sensors, smart locks, and mobile access lowering labor costs and appealing to digital-native renters. Adaptive reuse presents an entry path for nimble investors targeting supply-constrained cores, while container-based models serve episodic demand in rural zones. On-demand valet platforms remain niche but spotlight evolving consumer expectations for convenience.
Scale economies from REIT mergers bolster purchasing power in insurance, utilities, and digital marketing, reinforcing a widening moat. Yet localized expertise lets regional chains outmaneuver national brands in secondary and tertiary markets by customizing amenities such as RV parking or contractor bays. This bifurcated landscape will continue to shape revenue dynamics across the United States self-storage market through 2031.
United States Self Storage Industry Leaders
Metro Storage LLC
Guardian Storage Solutions, LLC
CubeSmart L.P.
Extra Space Storage Inc.
U-Haul International, Inc.
- *Disclaimer: Major Players sorted in no particular order

Recent Industry Developments
- May 2025: SmartStop Self Storage REIT raised USD 875.6 million via a public share offering, allocating capital toward debt reduction and nine targeted facility acquisitions. The move bolsters balance-sheet flexibility and accelerates inorganic growth.
- October 2024: Hurricane Milton drove emergency storage demand across Florida’s Gulf Coast.
- August 2024: Go Store It Self Storage merged with Snapbox Self Storage, pursuing operational synergies and broader geographic diversification across complementary facility networks.


Research Methodology Framework and Report Scope
Market Definitions and Key Coverage
Our study defines the United States self-storage market as the annual gross revenue that facilities earn from renting secure, self-service units, lockers, containers, pods, or parking bays to personal and business users on flexible terms. The scope embraces purpose-built stores, converted buildings, and container-based sites, and it tracks lettable area, occupancy, and average street rents.
Exclusion: Portable moving trailers that are returned within twenty-four hours are outside scope.
Segmentation Overview
- By User Type
- Personal
- Business
- By Unit Size
- ≤ 100 sq ft (Small)
- 101-200 sq ft (Medium)
- More than 200 sq ft (Large/Vehicle)
- Climate-Controlled Lockers
- By Property Type
- Purpose-Built Facilities
- Converted Commercial Buildings
- Container-Based/Mobile Sites
- By Booking Channel
- Offline (Walk-in / Phone)
- Online Aggregators and Operator Portals
- By End-Use Duration
- Short-Term (Less than 6 Months)
- Long-Term (More than equal to 6 Months)
Detailed Research Methodology and Data Validation
Primary Research
Mordor analysts interview regional operators, brokerage heads, and prop-tech vendors across the South, Midwest, Northeast, and West. Conversations verify vacancy swings, discounting seasons, and unit-size demand, and survey feedback from end renters clarifies price elasticity and channel preferences.
Desk Research
We start with publicly available fundamentals such as U.S. Census housing moves, Internal Revenue Service business registrations, Federal Reserve interest-rate releases, and Self Storage Association occupancy surveys. Supplementary signals come from Bureau of Labor Statistics migration data, U.S. Department of Commerce e-commerce sales, and patent counts for access-control systems. When facility-level ownership or expansion detail is needed, analysts consult D&B Hoovers and Dow Jones Factiva. This multi-source lattice gives us historic baselines, pricing corridors, and construction pipelines.
Because no single feed is perfect, the team also scans REIT quarterly filings, county building permits, and regional trade press to fill short gaps and cross-check facility openings. The sources named are illustrative only, and many additional references underpin the dataset.
Market-Sizing & Forecasting
A top-down model converts national lettable stock into revenue using sampled street rents that are then moderated by average achieved-rate discounts. Results are corroborated with selective bottom-up roll-ups of listed REIT revenues and sampled independent operator data to adjust totals. Key variables include net rentable square feet under construction, migration-led housing turnover, e-commerce parcel volumes, climate-controlled unit premiums, and cap-rate trends that hint at owner pricing power. Multivariate regression forecasts each driver to 2030 before the aggregate is stress-tested under conservative, base, and expansion scenarios. Where unit counts are missing, average square-footage proxies are applied, flagged for later primary confirmation.
Data Validation & Update Cycle
Outputs run through variance checks against SSA occupancy benchmarks. A second analyst reviews anomalies, after which senior review signs off. We refresh figures annually and issue interim updates when macro shocks or material M&A alter underlying assumptions.
Why Our United States Self-Storage Baseline Deserves Decision-Maker Trust
Published values vary widely because firms choose different revenue lines, apply diverging rent assumptions, and freeze models at different points in the year.
Key gap drivers include varied treatment of tenant insurance income, inclusion of management-only contracts, and currency deflators. Mordor's base year aligns to 2025 actual receipts and blends street and achieved rents, while others often rely on advertised rates or older filings. Our annual refresh cadence also removes mismatches caused by late construction slowdowns.
Benchmark comparison
| Market Size | Anonymized source | Primary gap driver |
|---|---|---|
| USD 45.41 B (2025) | Mordor Intelligence | - |
| USD 54.30 B (2024) | Regional Consultancy A | Treats tenant insurance and packing-supply sales as core revenue |
| USD 30.10 B (2024) | Industry Publisher B | Excludes container-based sites and uses 2023 rent survey rolled forward |
| USD 23.36 B (2024) | Research Boutique C | Applies advertised street rents without occupancy adjustments |
In sum, the disciplined mesh of public records, paid intelligence, and live operator insight lets Mordor Intelligence offer a balanced, transparent benchmark that investors and developers can reproduce and trust.


Key Questions Answered in the Report
What is the current value of the United States self-storage market?
The market stood at USD 47.28 billion in 2026 and is on track to reach USD 57.79 billion by 2031.
Which segment is growing fastest within U.S. facilities?
Short-term contracts (under six months) are projected to advance at a 5.94% CAGR through 2031, supported by disaster-related displacement and more transient work patterns.
How are e-commerce trends influencing storage demand?
Small online sellers increasingly lease units as micro-fulfillment nodes, helping push the business renter segment toward a 4.89% CAGR.
Why are converted buildings becoming popular for new supply?
Conversions bypass lengthy entitlements and capitalize on discounted retail or office assets, giving them a forecast 5.89% CAGR.
What role does technology play in competitive positioning?
IoT sensors, smart locks, and revenue-management software help large operators optimize pricing and cut labor costs, widening their advantage over independents.
How do hurricanes affect occupancy?
Major storms like Helene and Milton trigger short-term spikes in affected regions, lifting occupancy for periods that often outlast FEMA recovery timelines.
Page last updated on:


