Saudi Arabia Delivery Apps Market Size and Share
Market Overview
| Study Period | 2020 - 2031 |
|---|---|
| Forecast Data Period | 2026 - 2031 |
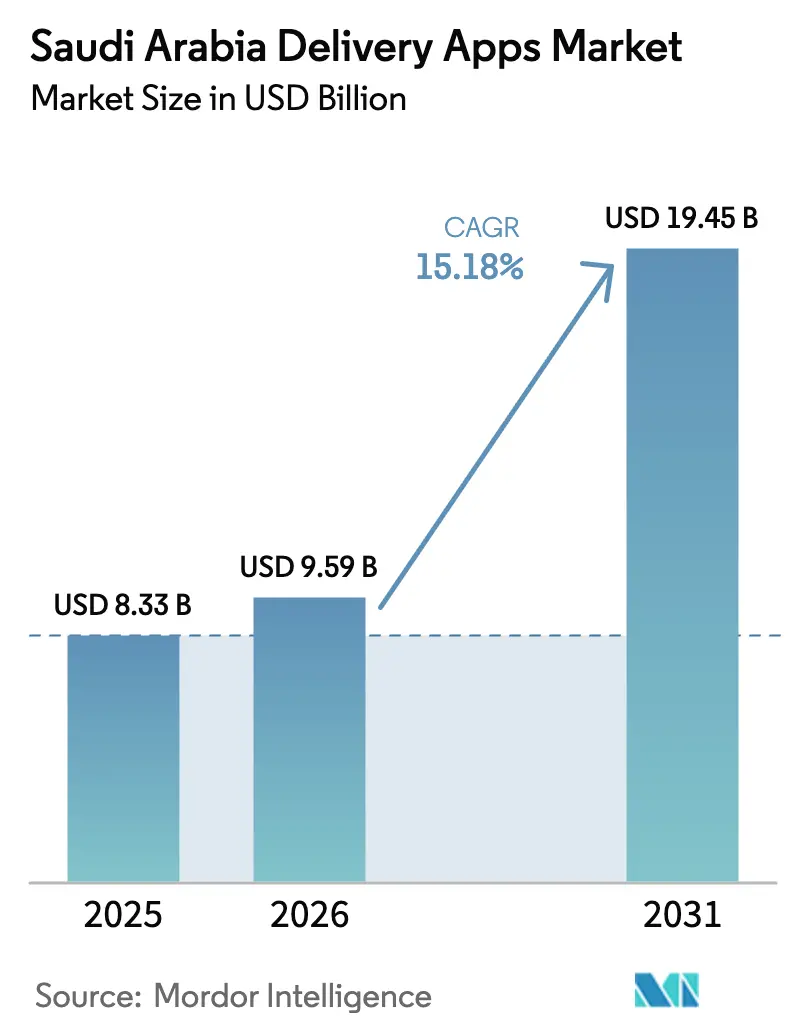
| Base Year Market Size (2025) | USD 8.33 Billion |
| Market Size (2026) | USD 9.59 Billion |
| Market Size (2031) | USD 19.45 Billion |
| Growth Rate (2026 - 2031) | 15.18% CAGR |
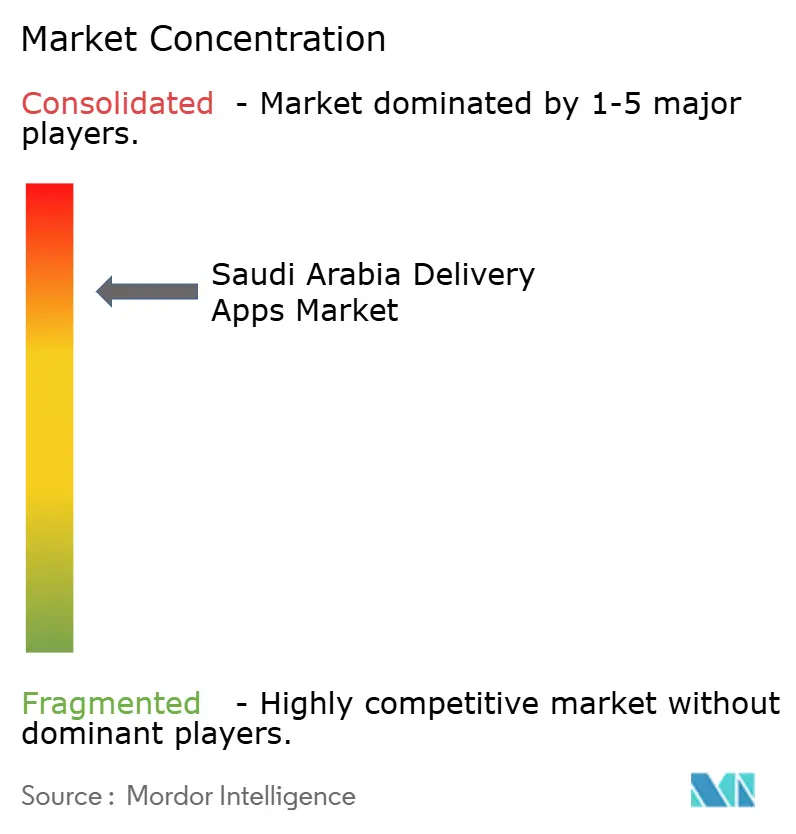
| Market Concentration | High |
Major Players*Disclaimer: Major Players sorted in no particular order Image © Mordor Intelligence. Reuse requires attribution under CC BY 4.0. | |
Saudi Arabia Delivery Apps Market Analysis by Mordor Intelligence
The Saudi Arabia delivery apps market size was valued at USD 8.33 billion in 2025 and estimated to grow from USD 9.59 billion in 2026 to reach USD 19.45 billion by 2031, at a CAGR of 15.18% during the forecast period (2026-2031). The acceleration mirrors rapid e-commerce adoption, a record USD 5.5 billion in online sales in January 2025, and large-scale logistics investments such as NEOM’s USD 10 billion joint venture with DSV that are modernizing last-mile networks. Rising smartphone penetration, widespread 5G coverage, and the expansion of dark-store micro-fulfillment hubs underpin the strong outlook, while regulatory certainty from the Transport General Authority (TGA) and the Saudi Central Bank’s (SAMA) digital-payments framework continues to reduce marketplace friction. International entrants such as Meituan’s Keeta have proved that competitive barriers are permeable, intensifying price competition and forcing incumbents to accelerate platform innovation. Meanwhile, enterprises are emerging as a sizable new customer group as subscription-based food and grocery delivery becomes a standard employee convenience.
Key Report Takeaways
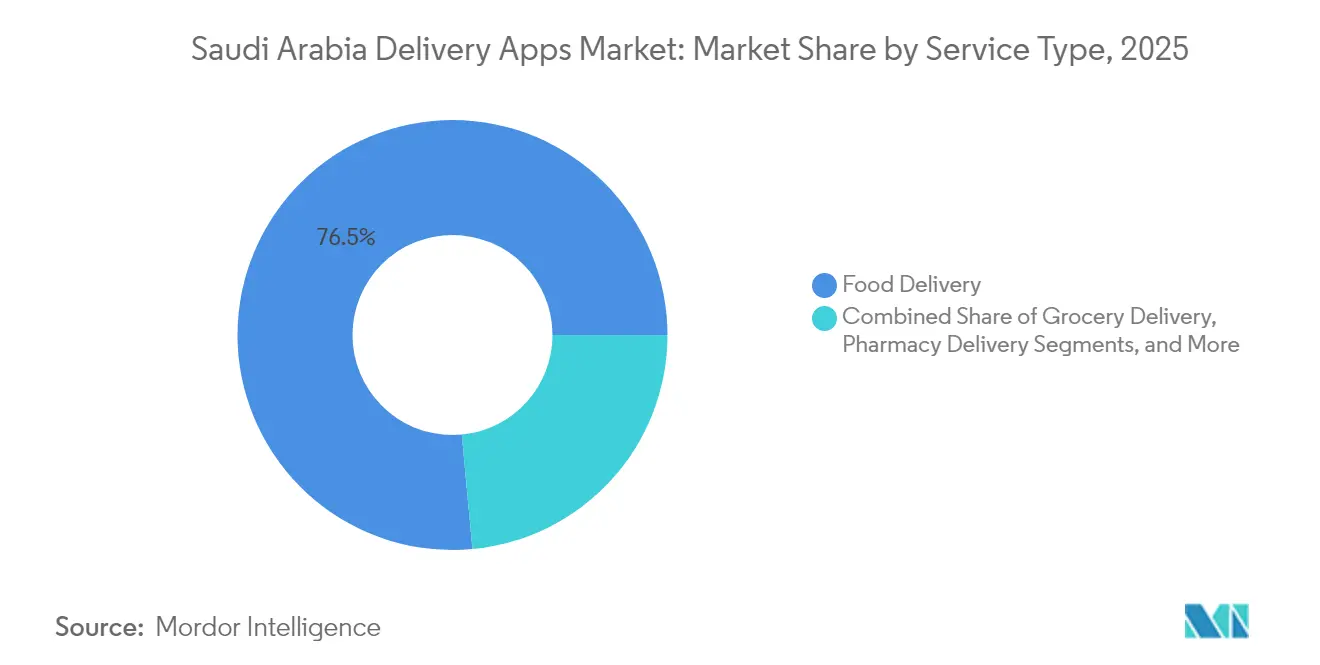
- By service type, food delivery held 76.48% of the Saudi Arabia delivery apps market share in 2025, while grocery delivery is forecast to expand at a 14.55% CAGR through 2031.
- By platform, Android captured 59.05% of revenue in 2025; Web/PWA is projected to rise at a 17.01% CAGR to 2031.
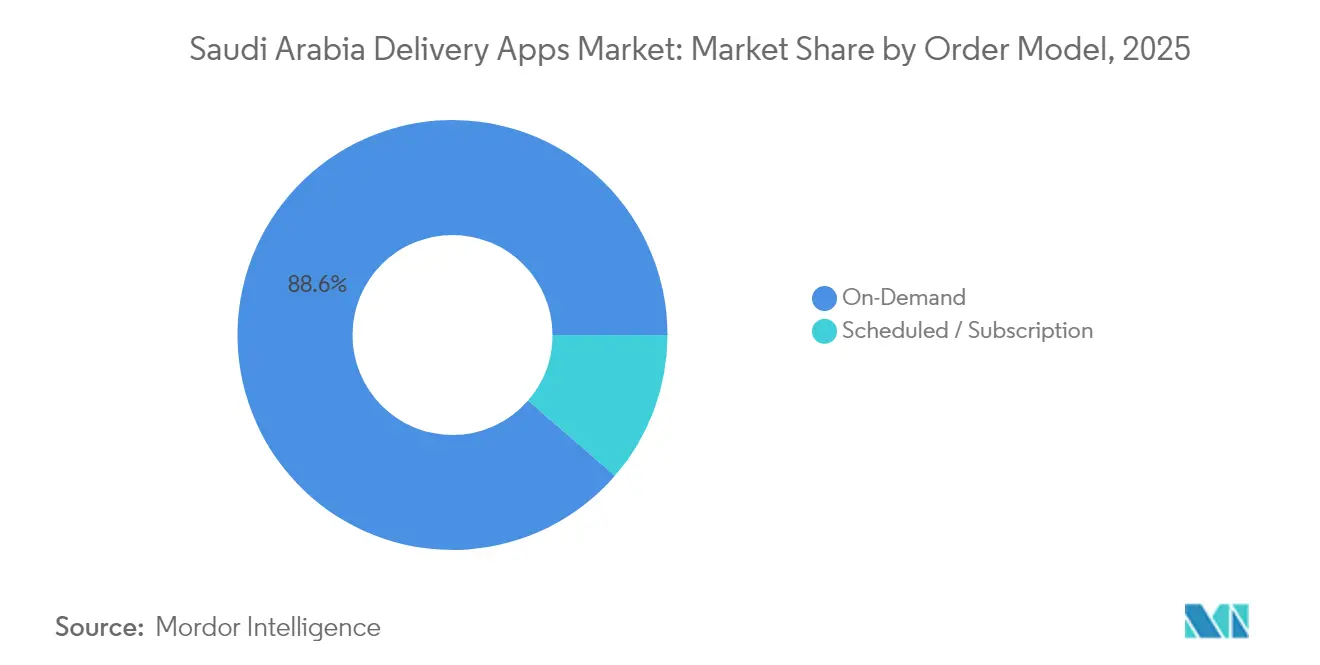
- By order model, on-demand services accounted for 88.63% of 2025 revenue, whereas scheduled and subscription ordering is advancing at an 17.95% CAGR through 2031.
- By end-user, individual consumers generated 85.12% of 2025 turnover, and corporate and institutional users are growing at a 15.41% CAGR.
Note: Market size and forecast figures in this report are generated using Mordor Intelligence’s proprietary estimation framework, updated with the latest available data and insights as of 2026.
Saudi Arabia Delivery Apps Market Trends and Insights
Drivers Impact Analysis*
| Driver | (~) % Impact on CAGR Forecast | Geographic Relevance | Impact Timeline |
|---|---|---|---|
| Rising smartphone penetration and 5G roll-out | +2.8% | Riyadh, Jeddah, Dammam | Medium term (2-4 years) |
| Rapid uptake of digital wallets and Mada cards | +3.2% | Urban centers nationwide | Short term (≤ 2 years) |
| Vision 2030 e-commerce incentives and VAT relief | +2.1% | NEOM and giga-projects | Long term (≥ 4 years) |
| Growing urban expatriate population | +1.9% | Riyadh, Jeddah, Eastern Province | Medium term (2-4 years) |
| NEOM smart-city logistics pilots | +1.4% | NEOM, Western Province | Long term (≥ 4 years) |
| Expansion of dark-store micro-fulfillment | +2.6% | Secondary cities | Medium term (2-4 years) |
| Source: Mordor Intelligence | |||


Rapid Uptake of Digital Wallets and Mada Cards
Mada card transactions climbed to USD 53 billion in 2024, helped by SAMA’s open-API mandates that eased the integration of global wallets such as Google Pay and Samsung Pay. Seamless payments lower basket-abandonment rates and enable subscription models that stabilize revenue for grocery and pharmacy platforms. Embedded-finance pilots inside major apps now offer instant micro-credit and rewards, improving customer lifetime value and supporting higher marketing ROI.
Vision 2030 E-commerce Incentives and VAT Relief Schemes
Fiscal incentives that include 0% corporate tax for 30 years under the Regional Headquarters program and customs suspension inside Special Integrated Logistics Zones have reduced the cost of cross-border sourcing. The unified e-invoicing platform administered by ZATCA also standardizes tax compliance, increasing data clarity for operators while cutting processing errors. These measures lower the entry barrier for foreign platforms such as Keeta and Rabbit, accelerating innovation cycles[1].BinDawood Holding, “Annual Report 2024,” bindawoodonline.com
Expansion of Dark-Store Micro-Fulfillment Beyond Tier-1 Cities
HungerStation’s Quick Market operates coverage equal to 95% of the Kingdom with delivery windows of under one hour, while Nana opened 30 dark stores in Riyadh and announced 20 additional facilities. Real-estate costs in secondary cities remain low, allowing higher margin capture even at sub-SAR 20 order values. Retailers such as BinDawood invested USD 390 million in hub infrastructure that merges store and dark-store inventory, shortening delivery radii and raising pick-rate productivity[2].Zakat, Tax and Customs Authority (ZATCA), “E-Invoicing Integration Guide – 2025,” zatca.gov.sa
Growing Urban Expatriate Population Seeking Convenience
Expatriates concentrated in Riyadh, Jeddah, and Dammam show higher usage frequencies and willingness to adopt subscription bundles. Cross-cuisine diversity makes these neighborhoods pilot zones for new restaurant categories, driving longer menus on Jahez and Careem. Subscription adoption among expatriates already exceeds the national average, supplying recurrent revenue that underwrites investments in temperature-controlled fleets.
Restraints Impact Analysis*
| Restraint | (~) % Impact on CAGR Forecast | Geographic Relevance | Impact Timeline |
|---|---|---|---|
| Preference for dine-in “majlis” and fine-dining culture | −1.8% | Traditional regions nationwide | Long term (≥ 4 years) |
| High commission fees squeezing restaurant margins | −2.1% | Competitive metro markets | Short term (≤ 2 years) |
| Weak geo-addressing accuracy in secondary towns | −1.3% | Secondary and rural areas | Medium term (2-4 years) |
| Gig-worker cost inflation post labor reforms | −1.7% | Urban centers | Short term (≤ 2 years) |
| Source: Mordor Intelligence | |||
Preference for Dine-in “Majlis” and Fine-Dining Culture
Cultural traditions that emphasize communal dining reduce the appeal of home delivery among older demographics. National surveys show 51% of Saudis still favor dining out, with the gap widening in conservative regions. Restaurateurs focused on premium dining often refuse delivery partnerships, citing brand-experience dilution.
High Commission Fees Squeezing Restaurant Margins
Commissions ranging from 15% to 30% erode profitability, especially for independent venues. Some outlets respond by adding delivery-specific price premiums, a tactic that can slow order momentum. The pressure intensifies during economic slowdowns when operating costs rise faster than menu prices.
*Our forecasts treat driver/restraint impacts as directional, not additive. The impact forecasts reflect baseline growth, mix effects, and variable interactions.
Segment Analysis
By Service Type: Food Delivery Dominance Faces Grocery Disruption
Food delivery produced USD 6.37 billion of revenue in 2025, equal to 76.48% of the Saudi Arabia delivery apps market share. Nonetheless, grocery delivery will grow fastest at a 14.55% CAGR, buoyed by dark-store density and elevated basket values. The Saudi Arabia delivery apps market size for grocery is poised to double by 2028, helped by Meituan’s Xiaoxiang Supermarket entry that transfers mature Chinese quick-commerce playbooks. Pharmacy delivery is also scaling through partnerships with Nahdi Medical and Al Dawaa, boosting chronic-care adherence rates among older consumers.
Platform diversification strategies now integrate cross-category bundling. Nana’s USD 542.6 million revenue target by 2026 illustrates how grocery repeat-purchase cycles smooth overall cash flow. Meanwhile, regulatory clarity from the Saudi Food and Drug Authority encourages safe pharmaceutical fulfillment, amplifying trust.
Investors recognize the convergence opportunity, financing dark-store hubs that handle both food and essential consumer goods on a single routing layer. That shared infrastructure improves van utilization and supports under-30-minute service standards in core districts.


By Platform: Android Leadership Challenged by Web Innovation
Android contributed 59.05% of 2025 transactions, a position secured by affordable handsets and pre-installed Google services. Yet Web/PWA interfaces are forecast to grow 17.01% annually because they avoid storage constraints and eliminate app-store download friction.
The Saudi Arabia delivery apps market size tied to Web/PWA channels could exceed USD 3.6 billion by 2031, accelerating as telcos bundle zero-rating data offers for browser-based traffic. Progressive web apps deliver push notifications and offline caching with no intermediary, raising release velocity for smaller operators. iOS retains affluent users with basket values 1.3 times the Android average, supporting higher premium-service penetration but limiting mass-market reach.
By Order Model: Scheduled Services Gain Subscription Traction
On-demand commands 88.63% revenue share, the default for spontaneous food cravings and quick-commerce baskets. However, scheduled and subscription formats will post an 17.95% CAGR as platforms seek cost efficiency and predictable demand.
Grocery subscriptions that bundle weekly staples with preferential pricing now constitute 9% of Nana’s orders. HungerStation’s Quick Market schedules let operators allocate riders more effectively, trimming idle mileage. For enterprises, subscription catering reduces procurement overhead and supports consistent supplier standards, stretching platform use cases into B2B territory.
By End-User: Corporate Segment Emerges as Growth Driver
Individuals generated 85.12% of 2025 turnover, reflecting household adoption. Yet corporate and institutional users will expand at a 15.41% CAGR, fueled by staff meal allowances and health-and-safety rules that favor on-site food provision.
The Saudi Arabia delivery apps market share attributable to corporate accounts could top 20.00% by 2031, aided by bulk-order invoicing APIs and integrated expense-management tools. Hospitals and universities increasingly outsource cafeteria functions to licensed delivery specialists, leveraging the TGA’s operator registry to ensure compliance.
Competitive Landscape
Competition is intensifying, but the market still shows moderate fragmentation. Local leaders Jahez International and HungerStation[4]Delivery Hero SE, “Middle East Strategic Reorganization Announcement – Aug 2024,” deliveryhero.com maintain scale advantages through nationwide rider fleets and legacy restaurant relationships. Meituan’s Keeta reached 10% share within four months of its 2024 launch, proving that subsidies plus strong tech can quickly reshape the order board. Careem, backed by Uber, is deploying multi-vertical “Everything App” functionality to defend share, while Rabbit leverages dark-store mastery honed in Egypt to target 20 million item deliveries by 2026.
Strategic responses emphasize infrastructure and AI. Jahez is testing machine-learning route optimization that has trimmed average drop-off time by 11%. Delivery Hero consolidated foodora, Yemeksepeti, and foodpanda under one Gulf management layer to extract operating synergies and reduce duplicated headcount. Meanwhile, BinDawood and Carrefour are pivoting from pure retailer status toward platform logistics collaborators, co-investing in chilled warehouses that feed marketplace partners.
Regulation also shapes competitive dynamics. TGA licensing and February 2025 labor rules raise compliance costs, favoring capitalized operators. Still, niche platforms focused on pharmaceuticals, electronics, or B2B services find room through specialized SLAs and differentiated fee structures. M&A activity is projected to intensify, with mid-tier incumbents courting logistics specialists to lock in capacity for same-hour windows.
Saudi Arabia Delivery Apps Industry Leaders
MRSOOL Inc.
Jahez International Company For Information Systems Technology
HungerStation LTD (Delivery Hero SE)
Talabat (Delivery Hero SE)
Carrefour Ksa (Majid Al Futtaim Retail)
- *Disclaimer: Major Players sorted in no particular order

Geography Analysis
Riyadh remains the epicenter of innovation owing to policy proximity and dense expatriate clusters. The capital hosts the highest concentration of dark stores and pilots autonomous delivery pods under NEOM’s technology consortium. Jeddah follows, leveraging port access to specialty imports and hosting early launches of Meituan’s Keeta and Xiaoxiang Supermarket. The Eastern Province benefits from petrochemical income, elevating premium basket sizes and pushing platforms to trial chilled-chain grocery modules.
Secondary cities such as Al-Kharj, Hail, and Arar illustrate the next wave of expansion. Lower real-estate costs enable profitable dark-store footprints, while gaps in conventional retail encourage first-time digital adoption. Location accuracy challenges are being solved through proprietary mesh-mapping and increased use of the what3words addressing protocol.
Vision 2030 tourism and industrial mega-projects open new consumer hotspots. NEOM is coding logistics standards for autonomous drones and smart lockers that may cascade to national norms. Cross-province hubs using hub-and-spoke models ensure remote settlements receive twice-daily delivery runs, raising service parity across the Kingdom.
Recent Industry Developments
- April 2025: Rabbit established Saudi operations with a regional headquarters in Riyadh, aiming for 20 million item deliveries by 2026 and USD 542.6 million revenue.
- April 2025: Development Works Food Co. reported losses equal to 27% of capital due to IFRS 16 lease accounting.
- April 2025: Meyar Co. acquired five delivery trucks worth SAR 1.47 million to expand distribution.
- February 2025: New labor amendments introduced stricter staffing rules and penalties up to SAR 500,000 for non-compliant delivery firms.
- January 2025: Keeta expanded to Jeddah and Makkah, partnering with 13,000 restaurants and deploying over 15,000 riders.


Saudi Arabia Delivery Apps Market Report Scope
Transporting goods from the source site to a predetermined destination is referred to as delivery. Freight is mainly handled by road and rail on land, maritime channels, or air transport networks. The market is defined by the revenue generated from various sources, such as delivery fees, commissions, advertising and marketing revenues, online payment fees, etc., on delivery applications such as food, grocery, pharmacy, etc., in the market.
The Saudi Arabia delivery apps market is segmented by service type (food delivery apps, grocery delivery apps, pharmacy delivery apps, and other On-demand delivery apps). The market size and forecasts are provided in terms of value (USD) for all the above segments.
| Food Delivery |
| Grocery Delivery |
| Pharmacy Delivery |
| Other On-Demand Delivery |
| Android |
| iOS |
| Web / PWA |
| On-Demand |
| Scheduled / Subscription |
| Individual Consumers |
| Corporate and Institutions |
| By Service Type | Food Delivery |
| Grocery Delivery | |
| Pharmacy Delivery | |
| Other On-Demand Delivery | |
| By Platform | Android |
| iOS | |
| Web / PWA | |
| By Order Model | On-Demand |
| Scheduled / Subscription | |
| By End-User | Individual Consumers |
| Corporate and Institutions |


Key Questions Answered in the Report
What is the projected value of the Saudi Arabia delivery apps market in 2031?
The market is forecast to reach USD 19.45 billion by 2031, representing a 15.18% CAGR from 2026.
Which service category is expected to grow fastest in Saudi Arabia?
Grocery delivery is projected to post a 14.55% CAGR through 2031, outpacing food, pharmacy, and other on-demand segments.
How significant is the corporate user segment for delivery apps in Saudi Arabia?
Corporate and institutional accounts are expanding at a 15.41% CAGR and could exceed 20.00% of sector revenue by 2031.
Why are web and PWA platforms gaining traction with Saudi consumers?
Progressive web apps eliminate downloads, require less phone storage, and receive zero-rating data bundles, driving a 17.01% CAGR for the channel.
What regulatory body licenses delivery platforms in Saudi Arabia?
The Transport General Authority issues licenses and enforces labor and service-quality standards for all operators.
Page last updated on:


