Saudi Arabia Data Center Market Size and Share
Market Overview
| Study Period | 2020 - 2031 |
|---|---|
| Forecast Data Period | 2026 - 2031 |
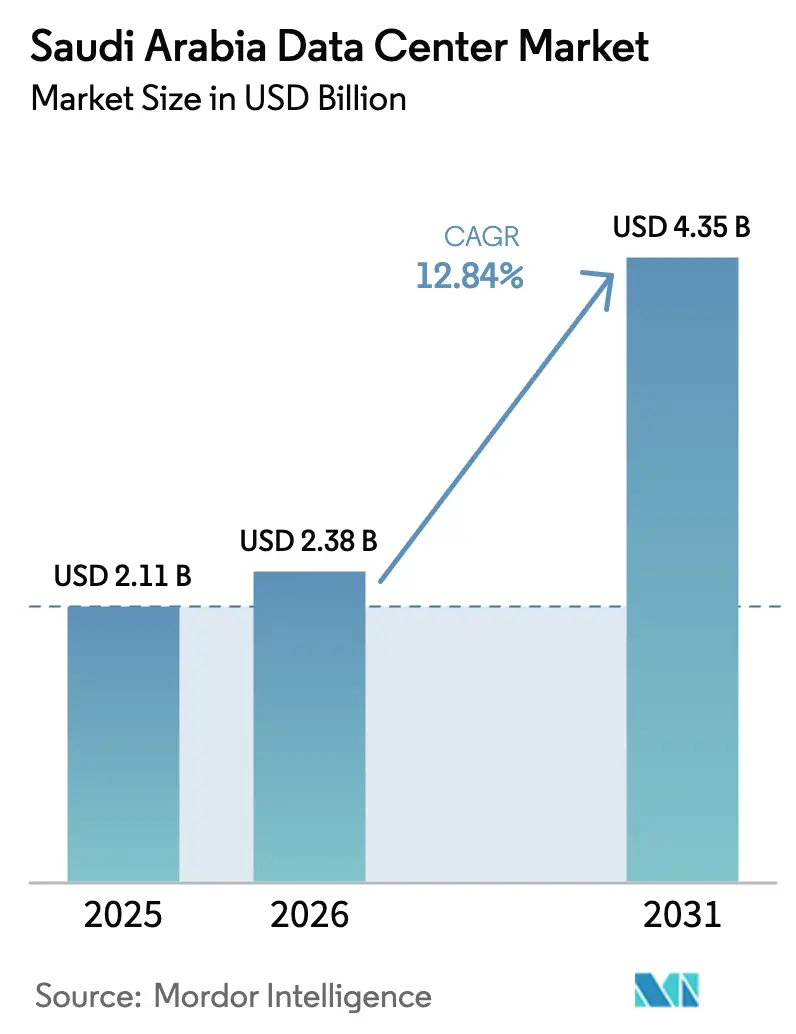
| Base Year Market Size (2025) | USD 2.11 Billion |
| Market Size (2026) | USD 2.38 Billion |
| Market Size (2031) | USD 4.35 Billion |
| Growth Rate (2026 - 2031) | 12.84% CAGR |
| Market Concentration | Medium |
Major Players*Disclaimer: Major Players sorted in no particular order Image © Mordor Intelligence. Reuse requires attribution under CC BY 4.0. | |
Saudi Arabia Data Center Market Analysis by Mordor Intelligence
The Saudi Arabia data center market size is expected to grow from USD 2.11 billion in 2025 to USD 2.38 billion in 2026 and is forecast to reach USD 4.35 billion by 2031 at 12.84% CAGR over 2026-2031. The IT load capacity stood at 0.41 thousand MW in 2025, growing at a CAGR of 19.96%, to reach 1.03 thousand MW by 2030. The market segment shares and estimates are calculated and reported in terms of MW. Rising IT load requirements, which jump from 0.41 thousand MW in 2025 to 1.03 thousand MW in 2030, underline the structural expansion toward sovereign digital infrastructure. Robust hyperscaler capital inflows, Vision 2030 smart-city initiatives, and nationwide fiber and 5G rollouts are accelerating capacity additions even as operators contend with desert-specific cooling costs. Long-term cloud region commitments from AWS, Microsoft, and Google continue to attract ecosystem partners, while the USD 100 billion sovereign AI initiative HUMAIN signals sustained domestic demand for exascale computing. In parallel, edge facility buildouts are gaining momentum to support latency-sensitive 5G and IoT use cases, enhancing regional content delivery and reducing backhaul costs.
Key Report Takeaways
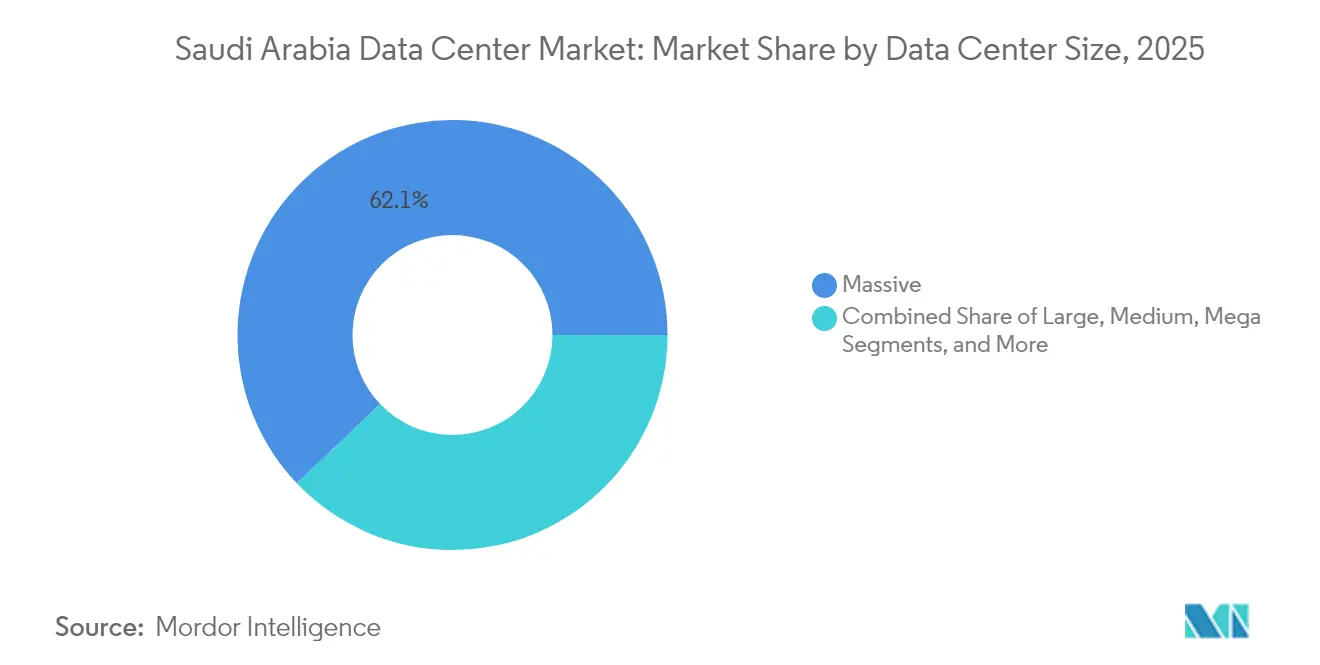
- By data center size, massive facilities led with a 62.12% revenue share in 2025, while large facilities recorded the fastest 19.35% CAGR through 2031.
- By tier type, Tier 4 infrastructure accounted for an 82.21% share of the Saudi Arabia data center market size in 2025 and is advancing at a 20.45% CAGR through 2031.
- By data center type, hyperscale and self-built deployments held 76.34% of the Saudi Arabia data center market share in 2025, whereas edge computing facilities are growing at 21.10% CAGR to 2031.
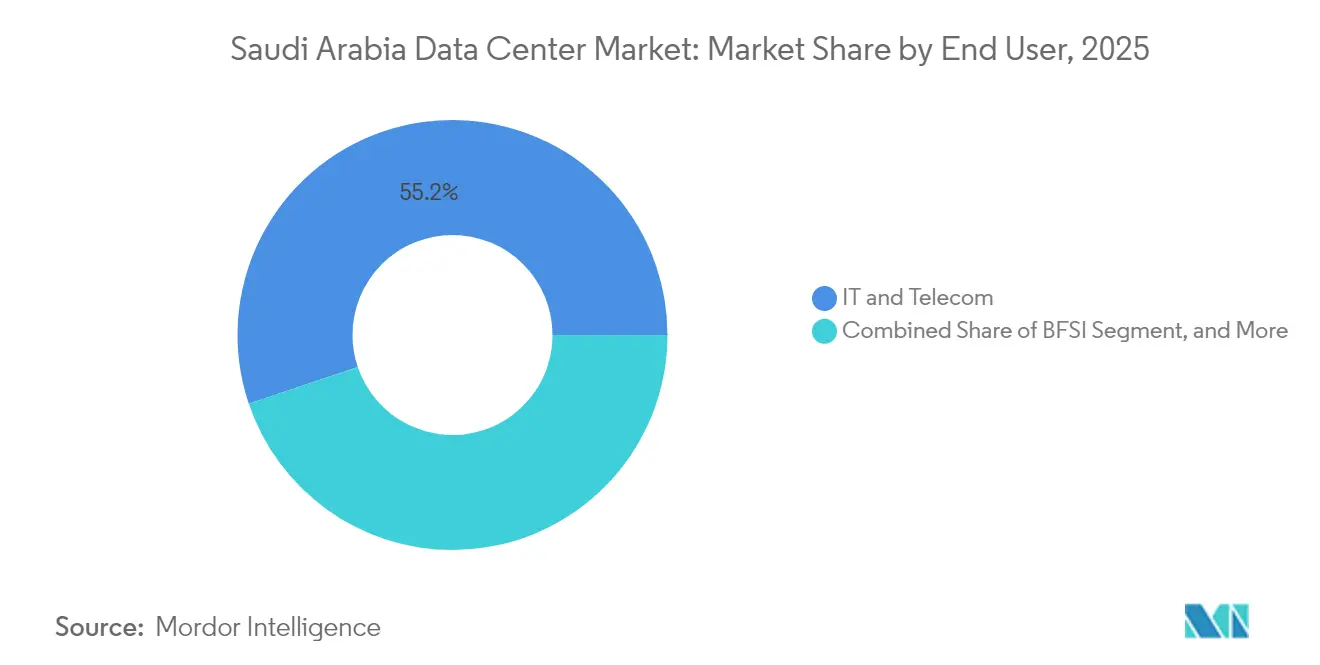
- By end user, IT and telecom collectively commanded 55.18% of 2025 demand, yet BFSI is pacing ahead with a 20.95% CAGR through 2031.
- By hotspot, Riyadh retained 26.40% of installed capacity in 2025, while Dammam is expanding fastest at 15.05% CAGR through 2031.
Note: Market size and forecast figures in this report are generated using Mordor Intelligence’s proprietary estimation framework, updated with the latest available data and insights as of 2026.
Saudi Arabia Data Center Market Trends and Insights
Drivers Impact Analysis*
| Driver | (~) % Impact on CAGR Forecast | Geographic Relevance | Impact Timeline |
|---|---|---|---|
| Rapid Vision 2030 Digital-Government Spend Surge | +3.20% | National, concentrated in Riyadh and Jeddah | Medium term (2-4 years) |
| Hyperscaler Cloud Region Build-outs (AWS, Microsoft, Google) | +4.10% | National, with primary hubs in Riyadh and emerging presence in Dammam | Long term (≥ 4 years) |
| 5G and Nationwide Fiber Backbones Fueling Data Traffic | +2.80% | National rollout, urban areas first | Short term (≤ 2 years) |
| Mega Smart-City Projects (NEOM, Red Sea, Qiddiya) | +2.30% | NEOM (northwest), Red Sea (west coast), Qiddiya (Riyadh vicinity) | Long term (≥ 4 years) |
| Global AI Hub Law Enabling "Data-Embassy" Hosting | +1.90% | National, with regulatory framework administered centrally | Medium term (2-4 years) |
| Cloud Computing Special Economic Zone (CCSEZ) Tax Incentives | +1.40% | CCSEZ designated areas, expanding to multiple regions | Medium term (2-4 years) |
| Source: Mordor Intelligence | |||


Rapid Vision 2030 Digital-Government Spend Surge
Mandatory cloud-first directives require all ministries and public agencies to offload legacy workloads into sovereign infrastructure by 2027. The Saudi Data and Artificial Intelligence Authority’s Million Saudis for AI program aims to graduate 20,000 local experts by 2030, driving persistent demand for Tier 4 capacity. Multi-year procurement contracts already signed by core ministries are creating predictable cash flows for operators, enabling confident large-scale build decisions. HUMAIN’s USD 100 billion backing further locks in a domestic consumption base that de-risks long-tenor infrastructure returns. Public-sector datasets moving into regional clouds intensify security and uptime requirements, reinforcing Tier 4 dominance and spurring new builds in strategic corridors.
Hyperscaler Cloud-Region Build-outs (AWS, Microsoft, Google)
AWS committed USD 5.3 billion to launch its first local cloud region by 2026, while Microsoft established a regional headquarters in Riyadh with additional capacity pipelines to follow. These long-horizon capex plans confirm investor confidence in sustained enterprise migration from on-premises servers. Hyperscaler arrival triggers a multiplier effect: systems integrators, security vendors, content delivery networks, and SaaS providers co-locate to lower latency and interconnect fees. Competitive tension among global providers accelerates rollouts, compresses pricing, and encourages enterprises to repatriate data from foreign jurisdictions to comply with Saudi data-residency rules.
5G and Nationwide Fiber Backbones Fuelling Data Traffic
The Communications, Space and Technology Commission auctioned 600 MHz, 700 MHz, and 3.8 GHz bands in 2024, expanding licensed mobile spectrum by 27% and enabling urban 5G download speeds beyond 250 Mbps.[1]Communications, Space and Technology Commission, “Spectrum Auction Results 2024,” cst.gov.sa Edge compute nodes are proliferating to support real-time analytics for autonomous vehicles, AR/VR, and industrial IoT. Simultaneously, state-backed fiber installs connect second-tier cities, ensuring symmetrical bandwidth for cloud workloads. New subsea cables such as Africa-1 and 2Africa land in Jeddah, positioning the Kingdom as a regional transit hub and enticing global content providers eager to optimize Middle East latency.
Mega Smart-City Projects (NEOM, Red Sea, Qiddiya)
NEOM’s DataVolt partnership lines up USD 5 billion for 1.5 GW of AI-optimized capacity by 2028, creating the world’s first net-zero “compute refinery” powered largely by solar and wind.[2]NEOM Authority, “NEOM DataVolt Partnership Announcement,” neom.com Qiddiya’s tourism and entertainment complex spans 334 square kilometers and targets 48 million annual visitors, each using high-bandwidth immersive services that rely on near-instant processing. The Red Sea Project’s resort clusters call for edge nodes handling environmental monitoring and smart-building controls at remote coastal sites. Developers awarding data-center plots early in the construction cycle give first movers an unmatched foothold in these anchor projects, guaranteeing utilization as population centers come online.
Restraints Impact Analysis*
| Restraint | (~) % Impact on CAGR Forecast | Geographic Relevance | Impact Timeline |
|---|---|---|---|
| High Power-and-Cooling OPEX in Desert Climate | -2.10% | National, most acute in interior regions | Long term (≥ 4 years) |
| Scarcity of Tier-IV-Ready Skilled Workforce | -1.80% | National, with talent concentration in major urban centers | Medium term (2-4 years) |
| GPU and Liquid-Cooling Supply-Chain Bottlenecks | -1.30% | Global supply chain impact, affecting all regions | Short term (≤ 2 years) |
| Heavy Pre-lease Levels Raising Entry Barriers for Newcomers | -0.90% | Riyadh and Jeddah primarily, where hyperscaler commitments are concentrated | Medium term (2-4 years) |
| Source: Mordor Intelligence | |||
High Power-and-Cooling OPEX in Desert Climate
Cooling can account for more than 40% of total operating outlays in summer months, denting profitability relative to temperate-zone facilities. Water scarcity restricts evaporative techniques, steering operators toward capital-intensive liquid cooling and closed-loop chillers. Although Saudi Arabia enjoys some of the world’s cheapest solar LCOE, backup diesel capacity must remain available to offset grid intermittency during peak heat, inflating total capex. Operators experimenting with treated wastewater and lithium-bromide absorption units demonstrate potential OPEX savings but still face scale-up risk. Ultimately, success hinges on designing thermal envelopes that marry energy efficiency with hyperscaler uptime standards.
Scarcity of Tier-IV-Ready Skilled Workforce
Domestic engineers versed in high-density power, immersion cooling, and GPU fabric management remain in short supply. While SDAIA funds scholarships and STC collaborates with technical colleges, the talent pipeline lags demand, forcing operators to import specialists under fast-track visas. Salary inflation for experienced data-center technicians already outpaces other ICT segments, pressuring margins. Knowledge-transfer programs take multiple build cycles to mature, elongating commissioning schedules and raising the risk of operational non-compliance with Tier-IV standards.
*Our forecasts treat driver/restraint impacts as directional, not additive. The impact forecasts reflect baseline growth, mix effects, and variable interactions.
Segment Analysis
By Data Center Size – Massive Facilities Dictate Hyperscale Economics
Massive sites captured 62.12% of 2025 revenue as hyperscalers consolidated compute for AI training and regional cloud services. This dominance reflects economies of scale that lower per-rack power costs and streamline redundancy design. Large facilities, although smaller in footprint, clock a 19.35% CAGR to 2031 as enterprises opt for dedicated premises that bridge the gap between wholesale colocation and in-house builds. Medium installations appeal to regional government entities that need sovereign hosting but lack hyperscale volumes, while small form factors underpin edge-computing use cases along 5G corridors.
Operators bank on land-banking near 380 kV substations, securing grid connections before real-estate values spike. The Saudi Arabia data center market, therefore, gravitates toward two extremes: very large hyperscale parks feeding global clouds, and compact micro-edge boxes processing traffic where it originates. Thermal envelope engineering also differs by size class; massive halls allow shared chill-water plants that drive PUE below 1.25, whereas small edge modules rely on direct-chip cooling to offset space constraints.


By Tier Type – Tier 4 Remains the Gold Standard
Tier 4 facilities accounted for 82.21% of 2025 deployments and are on track for a 20.45% CAGR, reaffirming their status as the bedrock of mission-critical hosting. Banks, ministries, and healthcare platforms insist on 99.995% uptime, forcing operators to invest in fully redundant power trains and distribution paths. The Saudi Arabia data center market size attached to Tier 4 builds will therefore rise faster than overall capacity, reflecting premium pricing for fault tolerance.
Tier 3 maintains a foothold for dev-test and disaster-recovery estates, but capital cost parity is narrowing as vendors release modular Tier-4 building blocks. Tier 1 and Tier 2 footprints shrink each year, limited to non-critical applications like internal batch processing. Meanwhile, the regulatory licensing regime increasingly embeds Tier-4 attributes such as dual power feeds and advanced fire suppression, shortening the economic gap between Tier 3 and Tier 4 and nudging procurement teams toward the higher tier.
By Data Center Type – Hyperscale Dominance with Edge on the Rise
Hyperscale and self-built sites held 76.34% of deployments in 2025, mirroring the shift from traditional hosting to cloud-native architectures. Long-term offtake agreements with AWS, Microsoft, and Google anchor revenue visibility, lowering financing costs and spawning multi-building campuses. Edge facilities, although currently niche, boast a 21.10% CAGR through 2031 as low latency becomes table stakes for AR/VR, telemedicine, and autonomous logistics.
Retail colocation fills the middle layer, catering to SMEs that need rapid deployment without hyperscale customization. Wholesale colocation, bundled with dark-fiber access and cross-connect marketplaces, attracts SaaS providers looking to peer directly with cloud on-ramps. The Saudi Arabia data center market share controlled by colocation will stabilize rather than grow as enterprises leapfrog to public cloud, yet specialized segments like high-frequency crypto trading still prefer proximate, carrier-neutral racks.
By End User – IT and Telecom Lead, BFSI Surges
IT and telecom combined for 55.18% of 2025 consumption as operators containerize core network functions and shift BSS/OSS stacks into cloud instances. Government migration mandates add steady baseline demand, with ministries reserving entire suites in Tier 4 buildings for sensitive workloads. BFSI outpaces all other sectors at 20.95% CAGR, propelled by digital banking licenses and open-API fintech sandboxes that swell transaction data volumes.
E-commerce retailers rely on the Saudi Arabia data center market to host payment gateways and real-time inventory engines, piggybacking on Vision 2030 retail modernization. Manufacturing titans such as Aramco Digital embed edge nodes within refineries for AI-driven predictive maintenance, creating hybrid clouds that span core campuses and field sensors. Media and entertainment studios linked to NEOM’s film district bankroll GPU clusters for CGI rendering, enriching utilization mixes and smoothing revenue seasonality for operators.
Geography Analysis
Riyadh commands 26.40% of installed capacity in 2025, benefitting from proximity to government agencies and an established enterprise cluster. State-backed telecom carriers extend redundant fiber rings across the capital, making it the first waypoint for incoming hyperscalers. Power-grid upgrades and land scarcity, however, nudge new entrants toward suburban industrial parks where 380 kV feeds are easier to secure.
Jeddah follows as the western hub, leveraging submarine cable landings that cut latency to Africa and Europe. Red Sea Global’s tourism buildout expands demand for on-premise edge nodes handling guest analytics and environmental IoT feeds. The city’s diversified merchant base, from logistics to retail, favours carrier-neutral sites interlinked with port and airport FTTH backbones.
The rest of Saudi Arabia category is the growth frontier. Dammam posts a 15.05% CAGR to 2031 on the back of energy-sector diversification and excellent road links into GCC neighbours. NEOM tops future pipelines with a 1.5 GW campus that embeds solar farms and hydrogen backup, redefining what “green” computing means at hyperscale. Secondary metros such as Al-Madinah and Abha see accelerating micro-edge deployments as nationwide 5G coverage nears completion.
Competitive Landscape
Saudi Telecom Company and its carrier-neutral subsidiary center3 anchor the incumbent tier, bundling dark fiber, tower access, and sovereign hosting credentials to lock in large tenants. International entrants led by AWS, Microsoft, and Equinix invest multi-billion-dollar sums to carve out cloud regions and interconnection hubs that meet local data-sovereignty statutes. HUMAIN’s USD 100 billion allocation for AI infrastructure ushers in a sovereign champion with scale on par with global peers, reshaping bargaining power across the supply chain.
Technology differentiation pivots on AI-ready design: liquid cooling, 48 V DC power distribution, and Nvidia GPU cluster orchestration. Operators that master direct-to-chip cooling and immersion tanks gain a thermal advantage in desert climates. Edge specialist DataVolt secures greenfield concessions within NEOM, betting on power purchase agreements tied to onsite renewables to achieve sub-1.2 PUE. Meanwhile, mid-tier players like Khazna and EDGNEX chase regional footprints, aggregating demand from GCC neighbours and offering federated capacity swaps.
M&A whisper activity intensifies as real-estate funds chase stable yield profiles. Private-equity groups court operators with Tier-4 track records, while infrastructure funds price minority stakes below 12× EBITDA, betting on optionality once hyperscaler pre-leases convert into cashflow. Regulatory oversight by the Communications, Space and Technology Commission raises barriers for speculative builds, favouring firms with deep compliance benches and Tier-IV certification histories.[4]center3, “center3 Targets 300 MW Data Center Portfolio,” center3.com
Saudi Arabia Data Center Industry Leaders
ETIHAD ATHEEB TELECOMMUNICATION COMPANY
Etihad Etisalat Company (Mobily)
HostGee Cloud Hosting Inc.
Saudi Telecom Company
SHABAKAH INTEGRATED TECHNOLOGY
- *Disclaimer: Major Players sorted in no particular order


Recent Industry Developments
- May 2025: HUMAIN AI Company debuted with Public Investment Fund backing and plans to install 18,000 Nvidia Blackwell GPUs in a 500 MW data-center cluster.
- March 2025: Alfanar revealed a USD 1.4 billion allocation to roll out new campuses across three provinces, one of the largest private-sector injections to date.
- February 2025: Equinix opened a USD 1 billion cloud-computing site in Riyadh during LEAP 2025, joining twelve other multinationals announcing USD 14.85 billion of tech pledges on day one of the expo.
- January 2025: EDGNEX Data Centres confirmed USD 20 billion for U.S. expansion targeting 2,000 MW, while retaining an active Saudi footprint spanning ten countries.


Saudi Arabia Data Center Market Report Scope
Riyadh are covered as segments by Hotspot. Large, Massive, Medium, Mega, Small are covered as segments by Data Center Size. Tier 1 and 2, Tier 3, Tier 4 are covered as segments by Tier Type. Non-Utilized, Utilized are covered as segments by Absorption.| Large |
| Massive |
| Medium |
| Mega |
| Small |
| Tier 1 and 2 |
| Tier 3 |
| Tier 4 |
| Hyperscale/Self-built | ||
| Enterprise/Edge | ||
| Colocation | Non-Utilized | |
| Utilized | Retail Colocation | |
| Wholesale Colocation | ||
| BFSI |
| IT and ITES |
| E-Commerce |
| Government |
| Manufacturing |
| Media and Entertainment |
| Telecom |
| Other End Users |
| Riyadh |
| Jeddah |
| Rest of Saudi Arabia |
| By Data Center Size | Large | ||
| Massive | |||
| Medium | |||
| Mega | |||
| Small | |||
| By Tier Type | Tier 1 and 2 | ||
| Tier 3 | |||
| Tier 4 | |||
| By Data Center Type | Hyperscale/Self-built | ||
| Enterprise/Edge | |||
| Colocation | Non-Utilized | ||
| Utilized | Retail Colocation | ||
| Wholesale Colocation | |||
| By End User | BFSI | ||
| IT and ITES | |||
| E-Commerce | |||
| Government | |||
| Manufacturing | |||
| Media and Entertainment | |||
| Telecom | |||
| Other End Users | |||
| By Hotspot | Riyadh | ||
| Jeddah | |||
| Rest of Saudi Arabia | |||


Market Definition
- IT LOAD CAPACITY - The IT load capacity or installed capacity, refers to the amount of energy consumed by servers and network equipments placed in a rack installed. It is measured in megawatt (MW).
- ABSORPTION RATE - It denotes the extend to which the data center capacity has been leased out. For instance, a 100 MW DC has leased out 75 MW, then absorption rate would be 75%. It is also referred as utilization rate and leased-out capacity.
- RAISED FLOOR SPACE - It is an elevated space build over the floor. This gap between the original floor and the elevated floor is used to accommodate wiring, cooling, and other data center equipment. This arrangement assist in having proper wiring and cooling infrastructure. It is measured in square feet (ft^2).
- DATA CENTER SIZE - Data Center Size is segmented based on the raised floor space allocated to the data center facilities. Mega DC - # of Racks must be more than 9000 or RFS (raised floor space) must be more than 225001 Sq. ft; Massive DC - # of Racks must be in between 9000 and 3001 or RFS must be in between 225000 Sq. ft and 75001 Sq. ft; Large DC - # of Racks must be in between 3000 and 801 or RFS must be in between 75000 Sq. ft and 20001 Sq. ft; Medium DC # of Racks must be in between 800 and 201 or RFS must be in between 20000 Sq. ft and 5001 Sq. ft; Small DC - # of Racks must be less than 200 or RFS must be less than 5000 Sq. ft.
- TIER TYPE - According to Uptime Institute the data centers are classified into four tiers based on the proficiencies of redundant equipment of the data center infrastructure. In this segment the data center are segmented as Tier 1,Tier 2, Tier 3 and Tier 4.
- COLOCATION TYPE - The segment is segregated into 3 categories namely Retail, Wholesale and Hyperscale Colocation service. The categorization is done based on the amount of IT load leased out to potential customers. Retail colocation service has leased capacity less than 250 kW; Wholesale colocation services has leased capacity between 251 kW and 4 MW and Hyperscale colocation services has leased capacity more than 4 MW.
- END CONSUMERS - The Data Center Market operates on a B2B basis. BFSI, Government, Cloud Operators, Media and Entertainment, E-Commerce, Telecom and Manufacturing are the major end-consumers in the market studied. The scope only includes colocation service operators catering to the increasing digitalization of the end-user industries.
| Keyword | Definition |
|---|---|
| Rack Unit | Generally referred as U or RU, it is the unit of measurement for the server unit housed in the racks in the data center. 1U is equal to 1.75 inches. |
| Rack Density | It defines the amount of power consumed by the equipment and server housed in a rack. It is measured in kilowatt (kW). This factor plays a critical role in data center design and, cooling and power planning. |
| IT Load Capacity | The IT load capacity or installed capacity, refers to the amount of energy consumed by servers and network equipment placed in a rack installed. It is measured in megawatt (MW). |
| Absorption Rate | It denotes how much of the data center capacity has been leased out. For instance, if a 100 MW DC has leased out 75 MW, then the absorption rate would be 75%. It is also referred to as utilization rate and leased-out capacity. |
| Raised Floor Space | It is an elevated space built over the floor. This gap between the original floor and the elevated floor is used to accommodate wiring, cooling, and other data center equipment. This arrangement assists in having proper wiring and cooling infrastructure. It is measured in square feet/meter. |
| Computer Room Air Conditioner (CRAC) | It is a device used to monitor and maintain the temperature, air circulation, and humidity inside the server room in the data center. |
| Aisle | It is the open space between the rows of racks. This open space is critical for maintaining the optimal temperature (20-25 °C) in the server room. There are primarily two aisles inside the server room, a hot aisle and a cold aisle. |
| Cold Aisle | It is the aisle wherein the front of the rack faces the aisle. Here, chilled air is directed into the aisle so that it can enter the front of the racks and maintain the temperature. |
| Hot Aisle | It is the aisle where the back of the racks faces the aisle. Here, the heat dissipated from the equipment’s in the rack is directed to the outlet vent of the CRAC. |
| Critical Load | It includes the servers and other computer equipment whose uptime is critical for data center operation. |
| Power Usage Effectiveness (PUE) | It is a metric which defines the efficiency of a data center. It is calculated by: (𝑇𝑜𝑡𝑎𝑙 𝐷𝑎𝑡𝑎 𝐶𝑒𝑛𝑡𝑒𝑟 𝐸𝑛𝑒𝑟𝑔𝑦 𝐶𝑜𝑛𝑠𝑢𝑚𝑝𝑡𝑖𝑜𝑛)/(𝑇𝑜𝑡𝑎𝑙 𝐼𝑇 𝐸𝑞𝑢𝑖𝑝𝑚𝑒𝑛𝑡 𝐸𝑛𝑒𝑟𝑔𝑦 𝐶𝑜𝑛𝑠𝑢𝑚𝑝𝑡𝑖𝑜𝑛). Further, a data center with a PUE of 1.2-1.5 is considered highly efficient, whereas, a data center with a PUE >2 is considered highly inefficient. |
| Redundancy | It is defined as a system design wherein additional component (UPS, generators, CRAC) is added so that in case of power outage, equipment failure, the IT equipment should not be affected. |
| Uninterruptible Power Supply (UPS) | It is a device that is connected in series with the utility power supply, storing energy in batteries such that the supply from UPS is continuous to IT equipment even during utility power is snapped. The UPS primarily supports the IT equipment only. |
| Generators | Just like UPS, generators are placed in the data center to ensure an uninterrupted power supply, avoiding downtime. Data center facilities have diesel generators and commonly, 48-hour diesel is stored in the facility to prevent disruption. |
| N | It denotes the tools and equipment required for a data center to function at full load. Only "N" indicates that there is no backup to the equipment in the event of any failure. |
| N+1 | Referred to as 'Need plus one', it denotes the additional equipment setup available to avoid downtime in case of failure. A data center is considered N+1 when there is one additional unit for every 4 components. For instance, if a data center has 4 UPS systems, then for to achieve N+1, an additional UPS system would be required. |
| 2N | It refers to fully redundant design wherein two independent power distribution system is deployed. Therefore, in the event of a complete failure of one distribution system, the other system will still supply power to the data center. |
| In-Row Cooling | It is the cooling design system installed between racks in a row where it draws warm air from the hot aisle and supplies cool air to the cold aisle, thereby maintaining the temperature. |
| Tier 1 | Tier classification determines the preparedness of a data center facility to sustain data center operation. A data center is classified as Tier 1 data center when it has a non-redundant (N) power component (UPS, generators), cooling components, and power distribution system (from utility power grids). The Tier 1 data center has an uptime of 99.67% and an annual downtime of <28.8 hours. |
| Tier 2 | A data center is classified as Tier 2 data center when it has a redundant power and cooling components (N+1) and a single non-redundant distribution system. Redundant components include extra generators, UPS, chillers, heat rejection equipment, and fuel tanks. The Tier 2 data center has an uptime of 99.74% and an annual downtime of <22 hours. |
| Tier 3 | A data center having redundant power and cooling components and multiple power distribution systems is referred to as a Tier 3 data center. The facility is resistant to planned (facility maintenance) and unplanned (power outage, cooling failure) disruption. The Tier 3 data center has an uptime of 99.98% and an annual downtime of <1.6 hours. |
| Tier 4 | It is the most tolerant type of data center. A Tier 4 data center has multiple, independent redundant power and cooling components and multiple power distribution paths. All IT equipment are dual powered, making them fault tolerant in case of any disruption, thereby ensuring interrupted operation. The Tier 4 data center has an uptime of 99.74% and an annual downtime of <26.3 minutes. |
| Small Data Center | Data center that has floor space area of ≤ 5,000 Sq. ft or the number of racks that can be installed is ≤ 200 is classified as a small data center. |
| Medium Data Center | Data center which has floor space area between 5,001-20,000 Sq. ft, or the number of racks that can be installed is between 201-800, is classified as a medium data center. |
| Large Data Center | Data center which has floor space area between 20,001-75,000 Sq. ft, or the number of racks that can be installed is between 801-3,000, is classified as a large data center. |
| Massive Data Center | Data center which has floor space area between 75,001-225,000 Sq. ft, or the number of racks that can be installed is between 3001-9,000, is classified as a massive data center. |
| Mega Data Center | Data center that has a floor space area of ≥ 225,001 Sq. ft or the number of racks that can be installed is ≥ 9001 is classified as a mega data center. |
| Retail Colocation | It refers to those customers who have a capacity requirement of 250 kW or less. These services are majorly opted by small and medium enterprises (SMEs). |
| Wholesale Colocation | It refers to those customers who have a capacity requirement between 250 kW to 4 MW. These services are majorly opted by medium to large enterprises. |
| Hyperscale Colocation | It refers to those customers who have a capacity requirement greater than 4 MW. The hyperscale demand primarily originates from large-scale cloud players, IT companies, BFSI, and OTT players (like Netflix, Hulu, and HBO+). |
| Mobile Data Speed | It is the mobile internet speed a user experiences via their smartphones. This speed is primarily dependent on the carrier technology being used in the smartphone. The carrier technologies available in the market are 2G, 3G, 4G, and 5G, where 2G provides the slowest speed while 5G is the fastest. |
| Fiber Connectivity Network | It is a network of optical fiber cables deployed across the country, connecting rural and urban regions with high-speed internet connection. It is measured in kilometer (km). |
| Data Traffic per Smartphone | It is a measure of average data consumption by a smartphone user in a month. It is measured in gigabyte (GB). |
| Broadband Data Speed | It is the internet speed that is supplied over the fixed cable connection. Commonly, copper cable and optic fiber cable are used in both residential and commercial use. Here, optic cable fiber provides faster internet speed than copper cable. |
| Submarine Cable | A submarine cable is a fiber optic cable laid down at two or more landing points. Through this cable, communication and internet connectivity between countries across the globe is established. These cables can transmit 100-200 terabits per second (Tbps) from one point to another. |
| Carbon Footprint | It is the measure of carbon dioxide generated during the regular operation of a data center. Since, coal, and oil & gas are the primary source of power generation, consumption of this power contributes to carbon emissions. Data center operators are incorporating renewable energy sources to curb the carbon footprint emerging in their facilities. |


Research Methodology
Mordor Intelligence follows a four-step methodology in all our reports.
- Step-1: Identify Key Variables: In order to build a robust forecasting methodology, the variables and factors identified in Step-1 are tested against available historical market numbers. Through an iterative process, the variables required for market forecast are set and the model is built on the basis of these variables.
- Step-2: Build a Market Model: Market-size estimations for the forecast years are in nominal terms. Inflation is not a part of the pricing, and the average selling price (ASP) is kept constant throughout the forecast period for each country.
- Step-3: Validate and Finalize: In this important step, all market numbers, variables and analyst calls are validated through an extensive network of primary research experts from the market studied. The respondents are selected across levels and functions to generate a holistic picture of the market studied.
- Step-4: Research Outputs: Syndicated Reports, Custom Consulting Assignments, Databases & Subscription Platforms


