Saffron Market Size and Share
Saffron Market Analysis by Mordor Intelligence
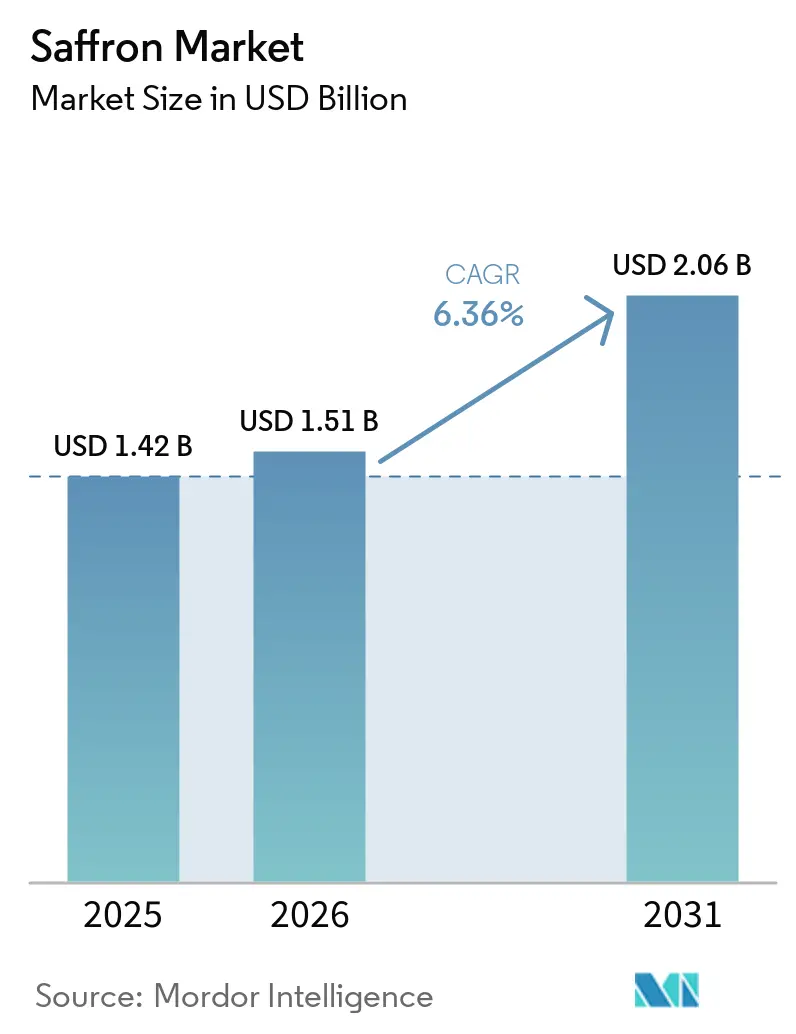
The saffron market size was valued at USD 1.42 billion in 2025 and estimated to grow from USD 1.51 billion in 2026 to reach USD 2.06 billion by 2031, at a CAGR of 6.36% during the forecast period (2026-2031). Limited harvests in Iran and Kashmir have tightened global supply, yet rising demand from premium foods, nutraceuticals, and clean-label cosmetics continues to underpin robust pricing power[1]Source: Reza F. et al., “Saffron Production Declines Under Climate Stress,” Frontiers in Pharmacology, frontiersin.org. Controlled-environment agriculture is gaining ground as growers migrate indoors to protect yields from erratic weather, while digital spice exchanges improve price discovery for buyers and smaller producers. In this setting, the saffron market is poised to reward businesses that marry agronomic innovation with transparent supply chains.
Key Report Takeaways
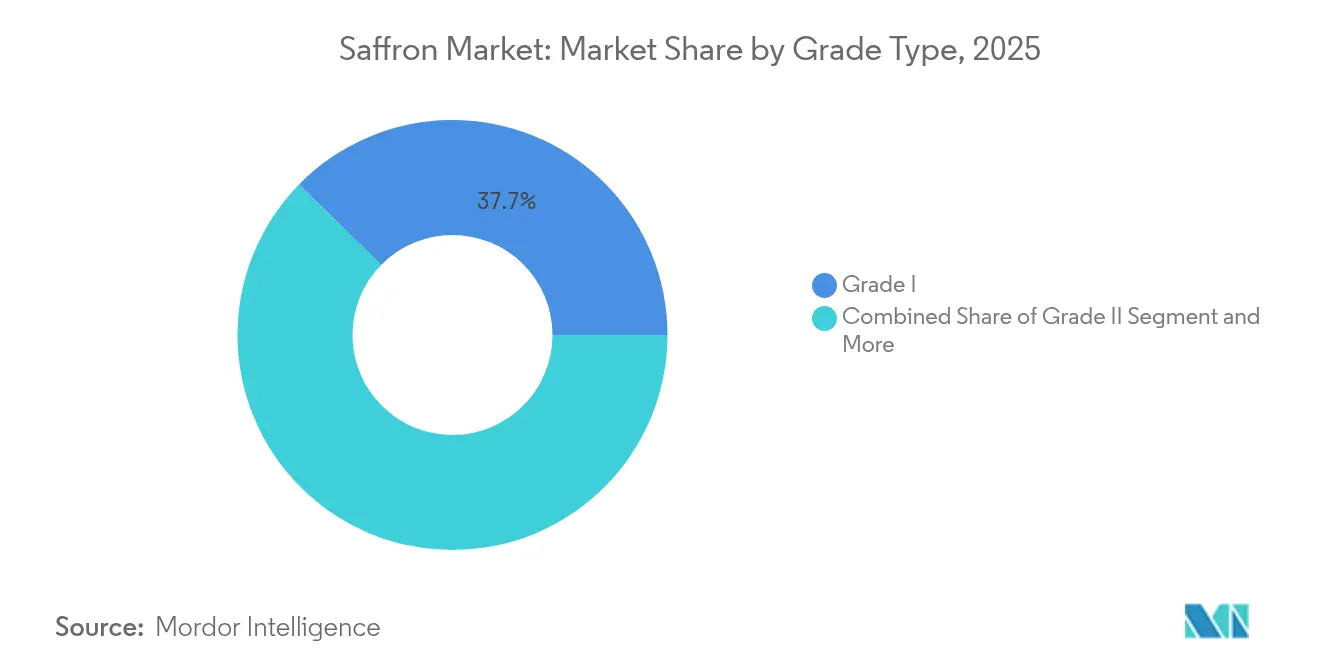
- By grade, Grade I led with 37.65% of the saffron market share in 2025, and it is on track for a 6.12% CAGR through 2031.
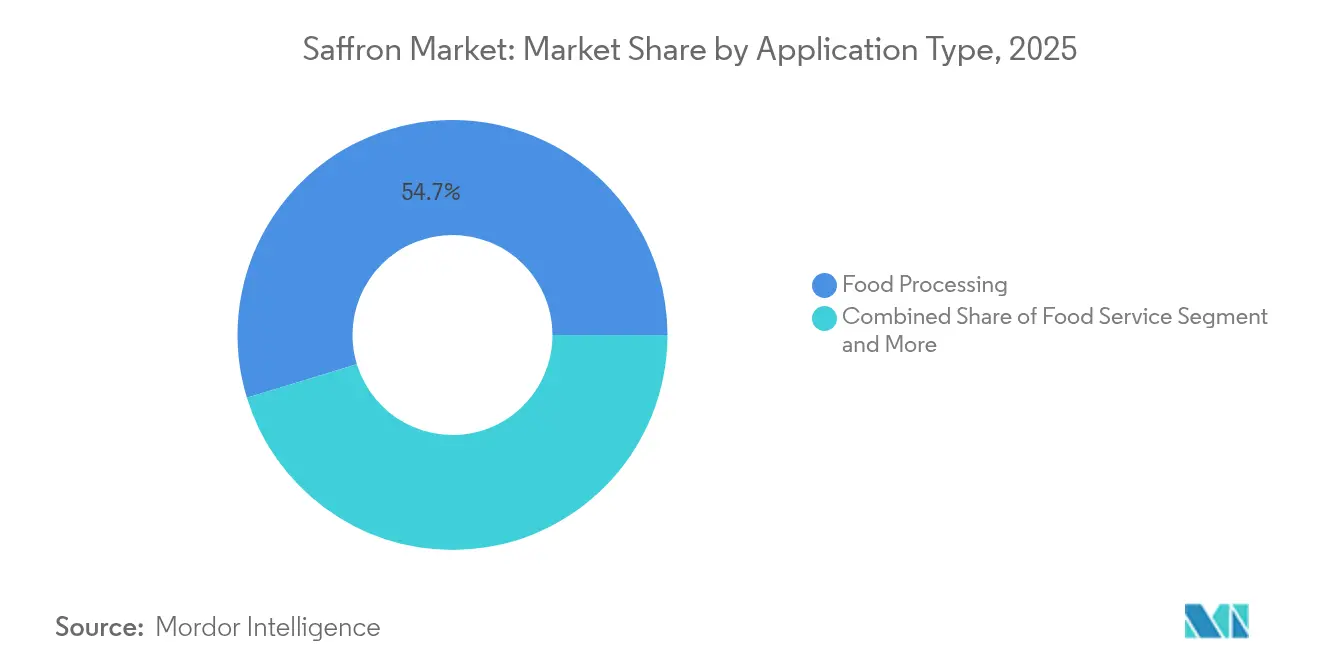
- By application, Food processing retained a 54.72% share of the saffron market size in 2025, and the pharmaceuticals and nutraceuticals segment accounted for 9.05% CAGR, outpacing all other uses.
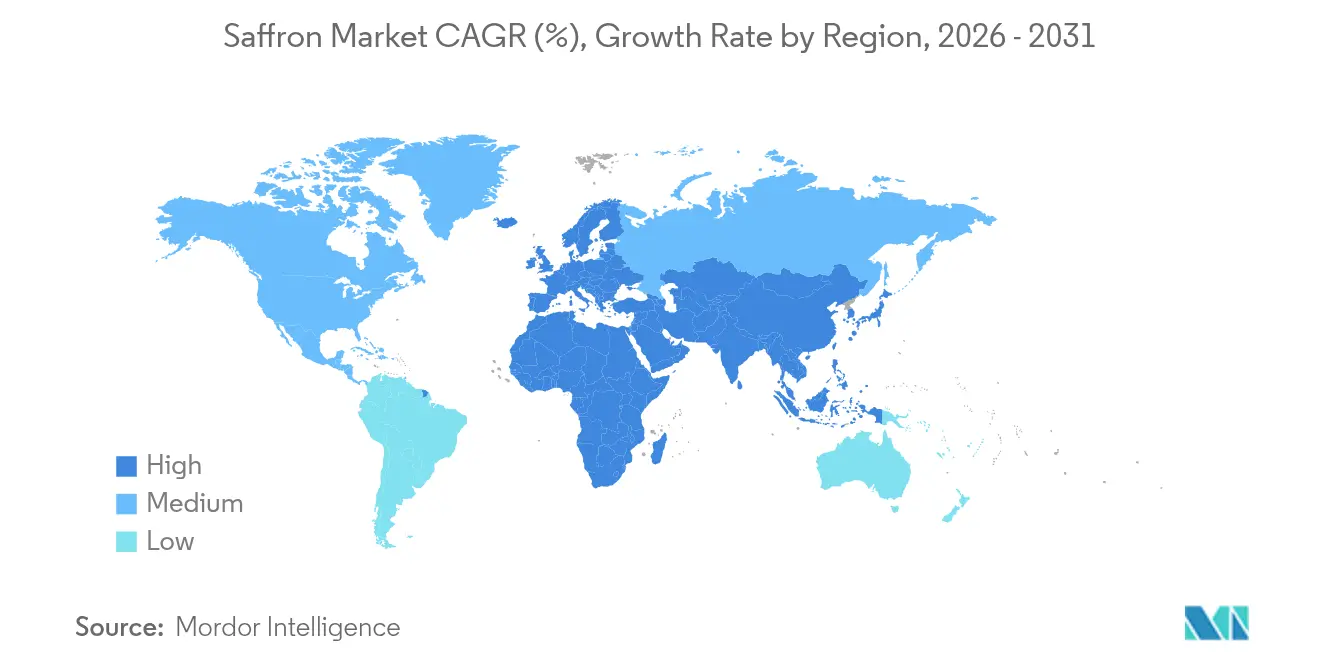
- By geography, Europe held 36.25% of the saffron market size in 2025, while Asia-Pacific is projected to expand at an 8.12% CAGR by 2031.
Note: Market size and forecast figures in this report are generated using Mordor Intelligence’s proprietary estimation framework, updated with the latest available data and insights as of 2026.
Global Saffron Market Trends and Insights
Drivers Impact Analysis*
| Driver | (~) % Impact on CAGR Forecast | Geographic Relevance | Impact Timeline |
|---|---|---|---|
| Rising demand from ready-to-eat ethnic foods | +1.2% | Global, with a concentration in North America and Europe | Medium term (2-4 years) |
| Premiumization of natural cosmetic actives | +0.8% | Europe and North America, expanding to Asia-Pacific | Long term (≥ 4 years) |
| Expansion of nutraceutical SKUs featuring crocin and safranal | +1.5% | Global, led by Asia-Pacific and North America | Medium term (2-4 years) |
| Digitized B2B spice exchanges are improving price discovery | +0.6% | Global, with early adoption in Europe and North America | Short term (≤ 2 years) |
| Farm-level IoT for micro-climate optimization, boosting yields | +0.9% | Iran, India, and Spain, expanding globally | Long term (≥ 4 years) |
| Stricter food-fraud and origin-traceability regulations | +0.7% | Europe and North America, with spillover to other regions | Medium term (2-4 years) |
| Source: Mordor Intelligence | |||
Rising Demand from Ready-to-Eat Ethnic Foods
Large urban centers increasingly favor ready-to-eat biryanis, paellas, and other ethnic dishes that rely on saffron for color and aroma. Food processors value the spice’s ability to deliver both functions without synthetic additives, enabling premium shelf pricing and cleaner ingredient decks. In South Korea’s USD 137 billion retail market, one-third of imported foods originate from the United States, illustrating the broader appetite for authentic flavors in convenient formats[2]Source: USDA Foreign Agricultural Service, “Retail Foods Annual 2025 – South Korea,” usda.gov.
Premiumization of Natural Cosmetic Actives
The beauty sector, valued at USD 280 billion, directs fresh investment toward plant-based actives, with saffron commanding roughly USD 1,600 per kilogram for cosmetic use. Topicals leveraging crocin’s antioxidant properties promise claims tied to radiance and skin-barrier support, allowing brands to position products at prestige price points. L’Oréal’s EUR 41.18 billion (USD 44.57 billion) 2024 revenue, buoyed by “green science” launches, showcases a sustained preference for verified botanical inputs[3]Source: L’Oréal Group, “2024 Annual Report,” loreal-finance.com. The trend locks in demand for Grade I saffron, encouraging growers to invest in stricter post-harvest handling and authenticated supply chains.
Expansion of Nutraceutical SKUs Featuring Crocin and Safranal
Saffron extract exhibits antidepressant efficacy comparable to standard pharmaceuticals, an insight now influencing new supplement launches. Patent filings referencing oncology and neuroprotection widen the addressable health sphere, prompting multinational nutraceutical players to secure long-term supply agreements. Asia-Pacific’s consumer base increasingly adopts natural mood-support capsules, lifting regional forecast volumes and reinforcing the saffron market’s compound annual growth.
Farm-Level IoT for Micro-Climate Optimization, boosting yields
Greenhouse setups equipped with sensors governing temperature, humidity, and salinity expand flowering from five weeks to three months, lifting output per bulb while cutting water use. Automated stigma separation reduces damage rates to 3.8% and trims labor hours that historically exceeded 1,200 per hectare. These efficiencies matter as Iranian yields fell to 140 metric tons in 2023, underscoring the value of controlled environments for stabilizing supply.
Restraints Impact Analysis*
| Restraint | (~) % Impact on CAGR Forecast | Geographic Relevance | Impact Timeline |
|---|---|---|---|
| Volatile farm-gate prices | -0.8% | Global, particularly Iran, India, Spain | Short term (≤ 2 years) |
| High labor intensity despite mechanization gaps | -1.1% | Global, most acute in traditional producing regions | Medium term (2-4 years) |
| Rising synthetic colourant substitution in food service | -0.6% | Global, concentrated in cost-sensitive food service | Medium term (2-4 years) |
| Water stress in primary producing regions | -0.9% | Iran, Spain, India, Morocco | Long term (≥ 4 years) |
| Source: Mordor Intelligence | |||
Volatile Farm-Gate Prices
Saffron prices swing with precipitation, drought lowers harvest volumes yet often boosts crocin concentration, lifting premiums, and the excessive rain damages blooms and increases volatility. Food processors and cosmetic formulators struggle to lock production budgets, and sudden spikes encourage substitution with synthetic colorants or competing botanicals. Iran’s 2023 production slide amplified short-term price shocks for downstream users.
Water Stress in Primary Producing Regions
Semi-arid belts in Iran, Kashmir, and parts of Spain face chronic water scarcity that jeopardizes crom development and stigma length, especially for premium grades. Hydroponic or mist-irrigated greenhouses conserve water but require an upfront investment, often beyond smallholders’ means. As aquifer depletion accelerates, policymakers might ration irrigation in favor of staples, placing a structural cap on acreage and thus dampening long-run saffron market expansion.
*Our forecasts treat driver/restraint impacts as directional, not additive. The impact forecasts reflect baseline growth, mix effects, and variable interactions.
Segment Analysis
By Grade: Premium Quality Commands Market Leadership
Grade I accounted for 37.65% of the saffron market size in 2025 and is growing at a 6.12% CAGR through 2031, reflecting an end-user preference for the deepest crocin levels and highest aromatic intensity. The saffron market benefits because higher margins fund the greenhouse retrofits needed to offset climate variability. Grade II, popular with packaged rice and confectionery makers, enjoys steady but slower growth, while Grades III and IV face substitution threats from synthetic colorants in cost-sensitive food-service channels.
Improvements in controlled lighting have been shown to lift crocin by up to 18%, bolstering Grade I supply, just as clinical research validates saffron’s mental health benefits. Producers leveraging IoT dashboards can now schedule staggered flowering cycles and capture off-season pricing spikes, further entrenching premium grades’ revenue dominance.


By Application: Pharmaceuticals Drive Innovation While Food Processing Anchors Volume
Food processing retained a 54.72% share of the saffron market size in 2025, aided by large batches of paella mixes, confectionery coatings, and premium ready-meal sauces that rely on saffron’s color stability. On the other hand, pharmaceuticals and nutraceuticals segment accounted for 9.05% CAGR, outpacing all other uses. Clinical trials that compare favorably with leading SSRIs underpin new mood-support capsules, while emerging patent activity explores crocetin’s oncology potential. These developments attract venture funding for extraction plants able to deliver pharma-grade purity, signaling future shifts in the saffron market toward higher-value, lower-volume formats.
Cosmetics and personal care use cases ride the beauty-from-within wave, integrating saffron into serums, facial oils, and ingestible powders that promise holistic skin benefits. Meanwhile, large QSR chains experiment with saffron seasoning blends in limited-time offers, although cost pressure remains a brake on mainstream food-service uptake.
Geography Analysis
Europe generated 36.25% of global saffron market revenue in 2025, leveraging stringent quality checks, origin protections, and heat-treatment mandates that favor premium lots over bulk shipments. Spain functions as both producer and consolidator, re-exporting curated batches across the European trading bloc. Retailers increasingly promote single-origin jars featuring PDO seals, and new EU labeling directives heighten penalties for adulteration, thereby rewarding authenticated supply.
Asia-Pacific, forecast for an 8.12% CAGR to 2031, benefits from rising middle-class incomes and the integration of saffron into traditional medicine, modern supplements, and instant beverage sachets. India’s spice-export leadership provides an efficient route to market for premium Kashmiri lots. China’s pharma sector scales up demand for standardized extracts, while South Korea’s USD 20.1 billion agricultural imports reflect openness to saffron-enhanced convenience meals.
North America shows healthy momentum in functional foods and clean-label supplements. In the Middle East, cultural affinity sustains stable household demand, yet geopolitical frictions motivate buyers to diversify away from single-country reliance. Emerging prospects in Chile and Argentina draw on climatic similarities with the Mediterranean basin, offering long-run hedging for global buyers concerned about Iranian water stress.

Recent Industry Developments
- January 2025: Kashmir growers rolled out large-scale indoor saffron farming to counter erratic weather, marking a turning point in regional production strategy.
- October 2024: The European Commission issued updated spice-import guidelines mandating heat treatment and origin verification for saffron shipments.
- May 2024: Iran exported 21 metric tons of saffron, underscoring ongoing international demand despite domestic water stress.


Research Methodology Framework and Report Scope
Market Definitions and Key Coverage
Our study defines the saffron market as the global trade value of raw saffron stigmas obtained from Crocus sativus flowers, captured at farm-gate or first commercial sale before any further processing or infusion into derivative products. This boundary keeps the value chain clean and directly measurable, allowing us to model production, trade, and end-use pull in a single system that, according to Mordor Intelligence, already totals USD 1.42 billion in 2025.
Scope exclusion: finished goods that merely contain saffron as an ingredient, such as ready-to-drink beverages, cosmetics, or nutraceutical blends, are not counted.
Segmentation Overview
- By Grade (Value)
- Grade I
- Grade II
- Grade III
- Grade IV and below
- By Application (Value)
- Food Processing
- Food Service
- Cosmetics and Personal Care
- Pharmaceuticals and Nutraceuticals
- Fragrances and Others
- By Geography (Production Analysis (Volume), Consumption Analysis (Volume and Value), Import Analysis (Volume and Value), Export Analysis (Volume and Value), and Price Trend Analysis)
- North America
- United States
- Canada
- Mexico
- Europe
- Spain
- Italy
- France
- United Kingdom
- Greece
- Russia
- Asia-Pacific
- China
- India
- Afghanistan
- Australia
- South America
- Argentina
- Chile
- Middle East
- Iran
- Turkey
- UAE
- Saudi Arabia
- Africa
- South Africa
- North America
Detailed Research Methodology and Data Validation
Primary Research
Mordor analysts interview growers in Iran, Spain, and India, bulk traders in Dubai, processors in Europe, and food ingredient buyers across North America and Asia-Pacific. These conversations test yield assumptions, grade premiums, seasonality impacts, and emerging demand pockets, filling gaps that desk work alone cannot close.
Desk Research
We begin with structured reviews of public data sets from authorities such as FAO, UN Comtrade, Eurostat, USDA GATS, and India's APEDA, which outline production, export, and price signals. Additional context comes from national horticulture boards, trade association briefs (for example, Iran Saffron Exporters Union), peer-reviewed journals tracking quality grades, and major customs notifications on adulteration alerts. Company filings, investor decks, and reputable press reports supply channel pricing and brand mix clues. D&B Hoovers and Dow Jones Factiva support targeted company intelligence checks. This list is illustrative, not exhaustive; many more records guide data validation.
Market-Sizing & Forecasting
We apply a top-down construct: national harvest volumes are rebuilt from planted area multiplied by average yield, then aligned with trade flows and weighted average export values to produce a 2025 demand pool. Selective bottom-up supplier roll-ups and channel spot checks adjust for informal sales and wastage. Key market fingerprints, grade mix shifts, farm-gate price volatility, organic share penetration, pharma-grade demand growth, and evolving export incentives shape our model. Multivariate regression, anchored on macro variables (GDP per capita, urbanization, wellness spend) and agronomic indicators, extends the view to 2030. Where bottom-up gaps appear, reasoned proxies such as neighboring-country yield curves bridge the data.
Data Validation & Update Cycle
Outputs pass three-layer variance screening, peer review, and senior analyst sign-off. We refresh every year, with interim updates triggered by major weather shocks, policy shifts, or price spikes, ensuring clients always get the latest calibrated baseline.
Why Mordor's Saffron Baseline Stands Firm
Published values often diverge because firms pick different scopes, grade filters, price points, and refresh cadences.
Key gap drivers include: a) omission of lower-grade, bulk export lots that Mordor keeps; b) narrow geographic coverage that overlooks new plantings in Afghanistan and Morocco; c) retail price extrapolations without harvest-to-export discounts; and d) older base years rolled forward without fresh season data.
Benchmark comparison
| Market Size | Anonymized source | Primary gap driver |
|---|---|---|
| USD 1.42 bn (2025) | Mordor Intelligence | - |
| USD 0.64 bn (2024) | Global Consultancy A | Excludes pharmaceutical uptake and organic premium grades |
| USD 0.47 bn (2024) | Industry Association B | Limited to five producing nations; omits re-export mark-ups |
| USD 1.12 bn (2023) | Regional Consultancy C | Uses retail shelf prices and older harvest data |
Taken together, the comparison shows that when proper grade coverage, fresh season metrics, and cross-checked trade values are combined, Mordor's figures provide a balanced, transparent baseline that decision-makers can confidently rely on.


Key Questions Answered in the Report
What is the current size of the saffron market?
The saffron market size reached USD 1.51 billion in 2026 and is forecast to hit USD 2.06 billion by 2031.
Which region leads global demand?
Europe leads with 36.25% revenue share, driven by stringent quality standards and premium culinary and cosmetic applications.
Which application segment is growing fastest?
Pharmaceuticals and nutraceuticals post the highest CAGR at 9.05% through 2031, fuelled by clinical evidence supporting crocin-based supplements.
Why is indoor saffron farming gaining traction?
Greenhouses equipped with IoT sensors protect crops from weather shocks, extend flowering periods and cut water use, stabilising yields amid climate change.
How do anti-fraud regulations affect the market?
Stricter EU labelling and origin-verification rules increase compliance costs but create advantages for suppliers with blockchain or laboratory authentication.
What limits large-scale industrial production of saffron?
Labour-intensive hand-picking, micro-climatic requirements and regional terroir constraints keep production fragmented despite emerging mechanisation.
Page last updated on:


