
Technology, Media and Telecom
5th MayPricing Strategy for Semiconductor Components
3 Min Read
Rugged Server Market Report is Segmented by Type (Semi-Rugged, Fully-Rugged, and More), Enterprise Size (SMEs and Large Enterprises), End-User (Military and Defense, Aerospace, and More), Form Factor (Rack-Mount, Blade, and More), Cooling Type (Passive and Fan-Based/Active), Memory Capacity (Less Than 256 GB, 256 - 512 GB, and More), and Geography. The Market Forecasts are Provided in Terms of Value (USD).
Market Overview
| Study Period | 2019 - 2030 |
|---|---|
| Market Size (2025) | USD 701.85 Million |
| Market Size (2030) | USD 985.12 Million |
| Growth Rate (2025 - 2030) | 7.00 % CAGR |
| Fastest Growing Market | Asia Pacific |
| Largest Market | North America |
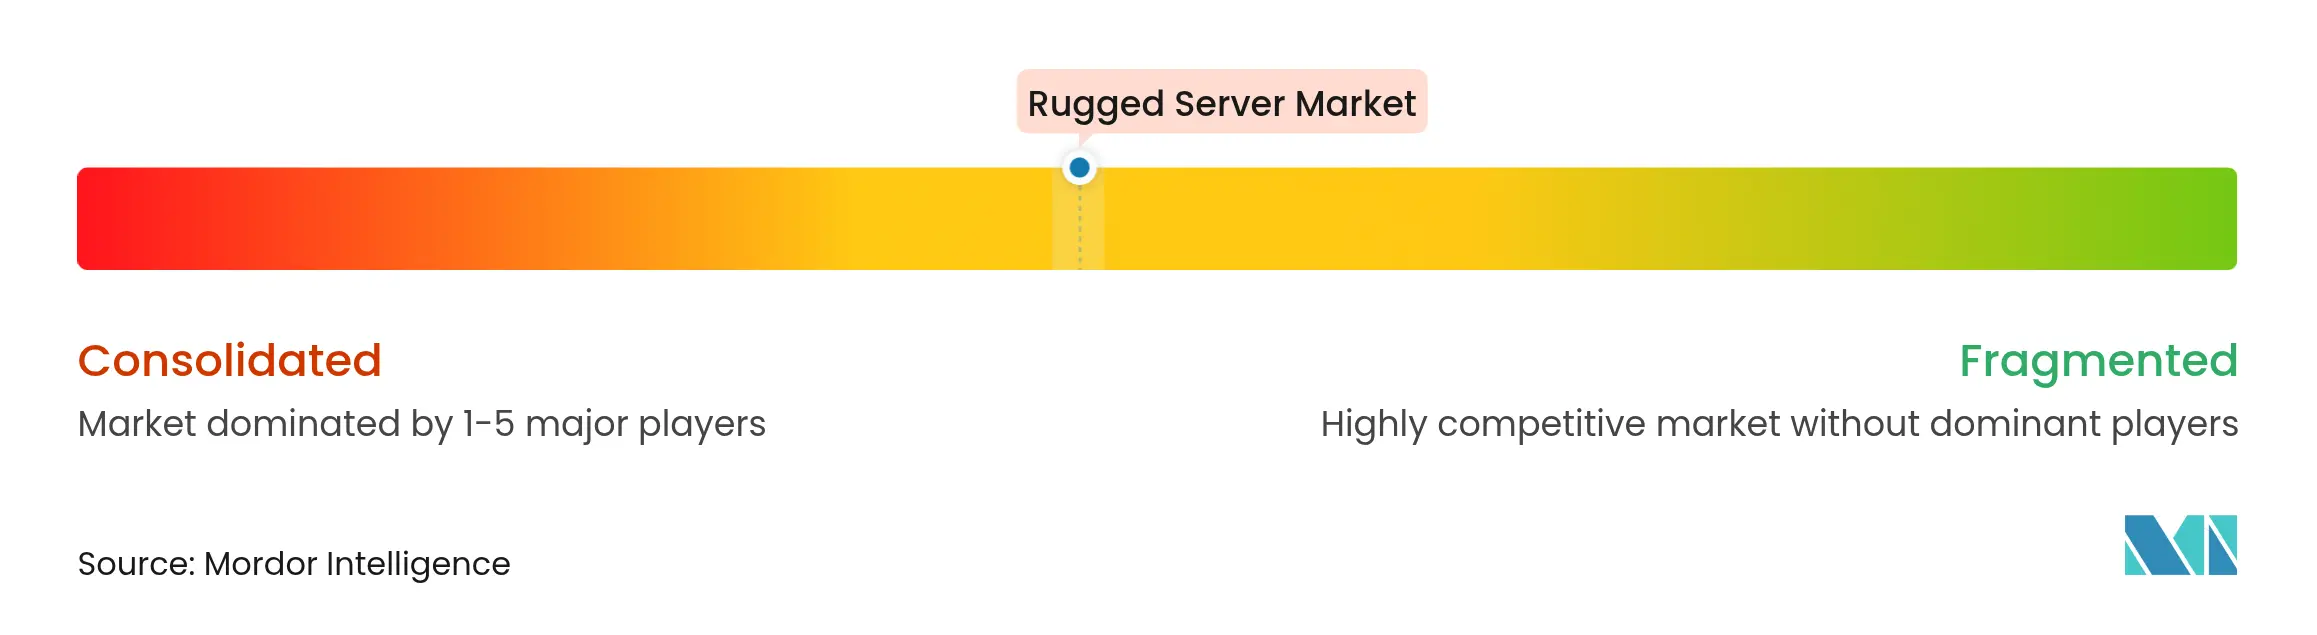
| Market Concentration | Medium |
Major Players *Disclaimer: Major Players sorted in no particular order. Image © Mordor Intelligence. Reuse requires attribution under CC BY 4.0. |
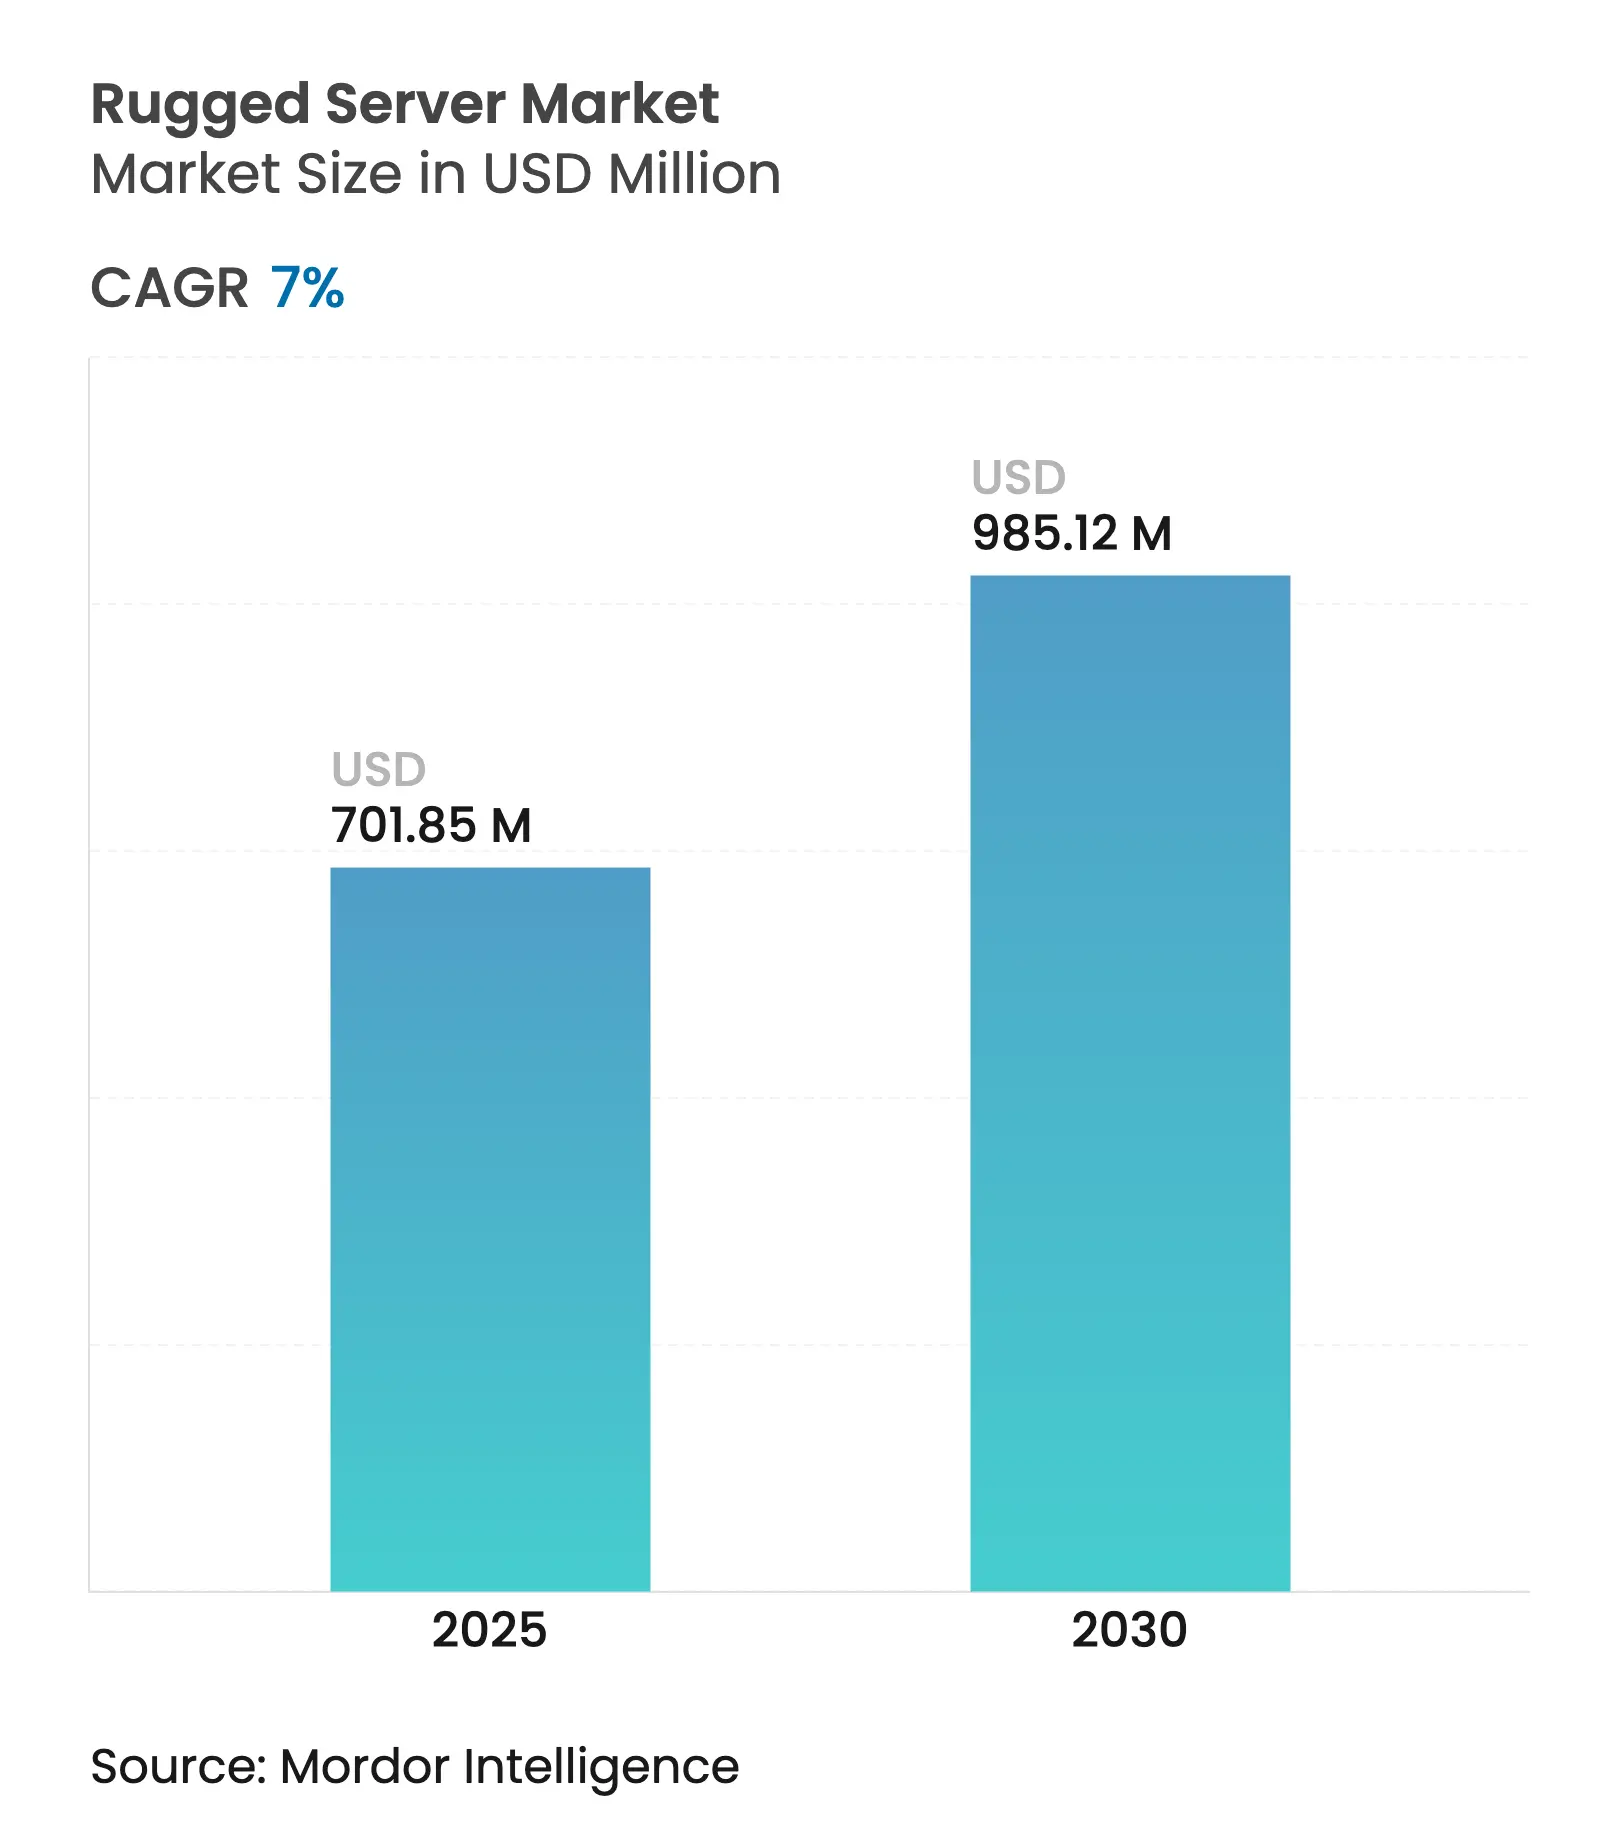
The rugged server market is valued at USD 701.85 million in 2025 and is forecast to reach USD 985.12 million by 2030, advancing at a 7.0% CAGR. Edge-computing build-outs, zero-trust security mandates, and continued defense modernization underpin the upward trajectory. North America retains leadership, supported by high military outlays and mature aerospace supply chains, while Asia-Pacific posts the fastest rise as China and India digitize defense and factory floors. Fully-rugged platforms hold sway thanks to MIL-STD-grade tolerance, yet ultra-rugged variants are expanding as uncrewed vehicles and remote sites call for greater shock and temperature endurance. Vendor activity centers on integrating cyber-hardening, AI acceleration, and modular SWaP-optimized form factors to meet mission-specific demands.
Key Report Takeaways
Drivers Impact Analysis
| Driver | (~) % Impact on CAGR Forecast | Geographic Relevance | Impact Timeline | |||
|---|---|---|---|---|---|---|
Increasing
demand in defense and aerospace
Increasing
demand in defense and aerospace
| +2.1% | North America, Europe, Asia-Pacific | Medium term (2-4 years) | (~) % Impact on CAGR Forecast:
+2.1%
| Geographic Relevance:
North
America, Europe, Asia-Pacific
| Impact Timeline:
Medium
term (2-4 years)
|
Industrial
automation and IIoT expansion
Industrial
automation and IIoT expansion
| +1.7% | Global, Asia-Pacific focus | Long term (≥ 4 years) | |||
Edge-computing
roll-outs in harsh sites
Edge-computing
roll-outs in harsh sites
| +1.5% | Global | Medium term (2-4 years) | |||
Modular
SWaP-optimized servers for UAVs and UGVs
Modular
SWaP-optimized servers for UAVs and UGVs
| +0.9% | North America, Europe | Medium term (2-4 years) | |||
Zero-trust
cyber-hardening mandates
Zero-trust
cyber-hardening mandates
| +0.6% | North America, Europe | Short term (≤ 2 years) | |||
| Source: Mordor Intelligence | ||||||
Increasing demand in defense and aerospace
Massive investments in autonomous systems and AI-enabled battlefield networks are fueling rugged server uptake across air, land, and sea platforms. In 2024, the U.S. Department of Defense issued thousands of contracts above USD 25,000 for hardened computing upgrades, signaling entrenched replacement cycles for legacy hardware[1]U.S. Department of Defense, “Contracts For Dec. 1, 2024,” defense.gov. Platforms such as Mercury Systems’ RES HD blade series allow rapid module swaps while sustaining classified data handling in contested zones. SOSA-aligned mission computers, including the ROCK3 launched in 2025, demonstrate how certification and security now guide system architecture, not simply physical durability. European forces follow suit through NATO tactical cloud pilots, cementing a medium-term demand pipeline for high-reliability compute nodes.
Industrial automation and IIoT expansion
Manufacturers are moving analytics from central data centers to shop-floor assets, exposing servers to vibration, dust, and fluctuating temperatures. Siemens’ new Simatic IPC BX-59A with integrated NVIDIA GPU offers 25-fold AI acceleration for quality control at the edge, cutting inspection latency while coping with ambient heat and debris. Automotive paint shops and semiconductor fabs are early adopters, using rugged enclosures to house predictive-maintenance algorithms that must run continuously. These deployments expand the rugged server market addressability beyond traditional defense segments, especially across Asia-Pacific, where electronics firms pursue lights-out factories.
Edge-computing roll-outs in harsh sites
Retail chains, energy utilities, and telecom operators are extending compute resources to unmanned rooms, curbside cabinets, and offshore platforms. Dell’s PowerEdge XR series delivers rack-class performance inside shortened, sealed chassis able to withstand dust, humidity, and a wide temperature span. NativeEdge management software reduces truck rolls by enabling remote BIOS and firmware control, aligning with zero-touch maintenance objectives. As 5G expands and AI inference happens closer to sensors, rugged server demand aligns with broader edge-infrastructure CAPEX flows.
Modular SWaP-optimized servers for UAVs and UGVs
Unmanned systems impose tight limits on size, weight, and power, yet require high compute density for autonomy and sensor fusion. Mercury Systems’ NanoSWITCH FLEX provides managed Ethernet switching in an IP67 case that rides aboard drones and ground robots while tolerating -40 °C to 71 °C extremes. Comparable fanless mission computers weigh under 2 kg, enabling longer flight endurance. Defense primes increasingly specify modular payload bays, enabling server refresh through plug-and-play cards rather than airframe redesigns, lifting demand for short-depth, conduction-cooled motherboards.
Zero-trust cyber-hardening mandates
U.S. Executive Orders and NATO directives push defense agencies toward hardware root-of-trust, secure boot, and encrypted storage on every deployed node. Mercury Systems’ acquisition of Star Lab in 2025 underscores how embedded security software now shapes procurement criteria. Vendors integrate FPGA-based cryptography and tamper detection to pass Defense Federal Acquisition Regulation Supplement (DFARS) clauses. Short-term impacts are significant in North America and Europe as programs rush to meet compliance deadlines.
Restraints Impact Analysis
| Restraint | (~) % Impact on CAGR Forecast | Geographic Relevance | Impact Timeline | |||
|---|---|---|---|---|---|---|
High
initial capital cost
High
initial capital cost
| -0.8% | Global, higher in emerging markets | Short term (≤ 2 years) | (~) % Impact on CAGR Forecast:
-0.8%
| Geographic Relevance:
Global,
higher in emerging markets
| Impact Timeline:
Short
term (≤ 2 years)
|
COTS
non-rugged substitutes gaining spec upgrades
COTS
non-rugged substitutes gaining spec upgrades
| -0.5% | Global | Medium term (2-4 years) | |||
Traceable,
ITAR-compliant supply-chain constraints
Traceable,
ITAR-compliant supply-chain constraints
| -0.4% | North America, Europe | Medium term (2-4 years) | |||
| Source: Mordor Intelligence | ||||||
High initial capital cost
Rugged servers are often priced at 2-3 times comparable commercial units, stretching SME budgets. Acquisition outlays are compounded by specialized mounting kits, environmental testing, and user training. Financing schemes and pay-as-you-use contracts are emerging to soften the burden. Semi-rugged SKUs, positioned between consumer and military grades, open a bridge market but still face resistance where operational risk tolerance remains high.
COTS non-rugged substitutes gaining spec upgrades
Mainstream server vendors now add conformal coating, advanced cooling, and extended temperature ratings to data-center models, blurring category lines. ASUS displayed liquid-assisted cooling and reinforced sockets on its 2024 platforms aimed at AI clusters, indirectly threatening dedicated rugged suppliers by narrowing performance deltas[2]ASUS, “Extreme Cooling Solutions Unveiled at CloudFest 2024,” asus.com. Over the medium term, differentiation will rely more on secure provenance, MIL-STD validation, and bespoke chassis shapes than on raw component specification.
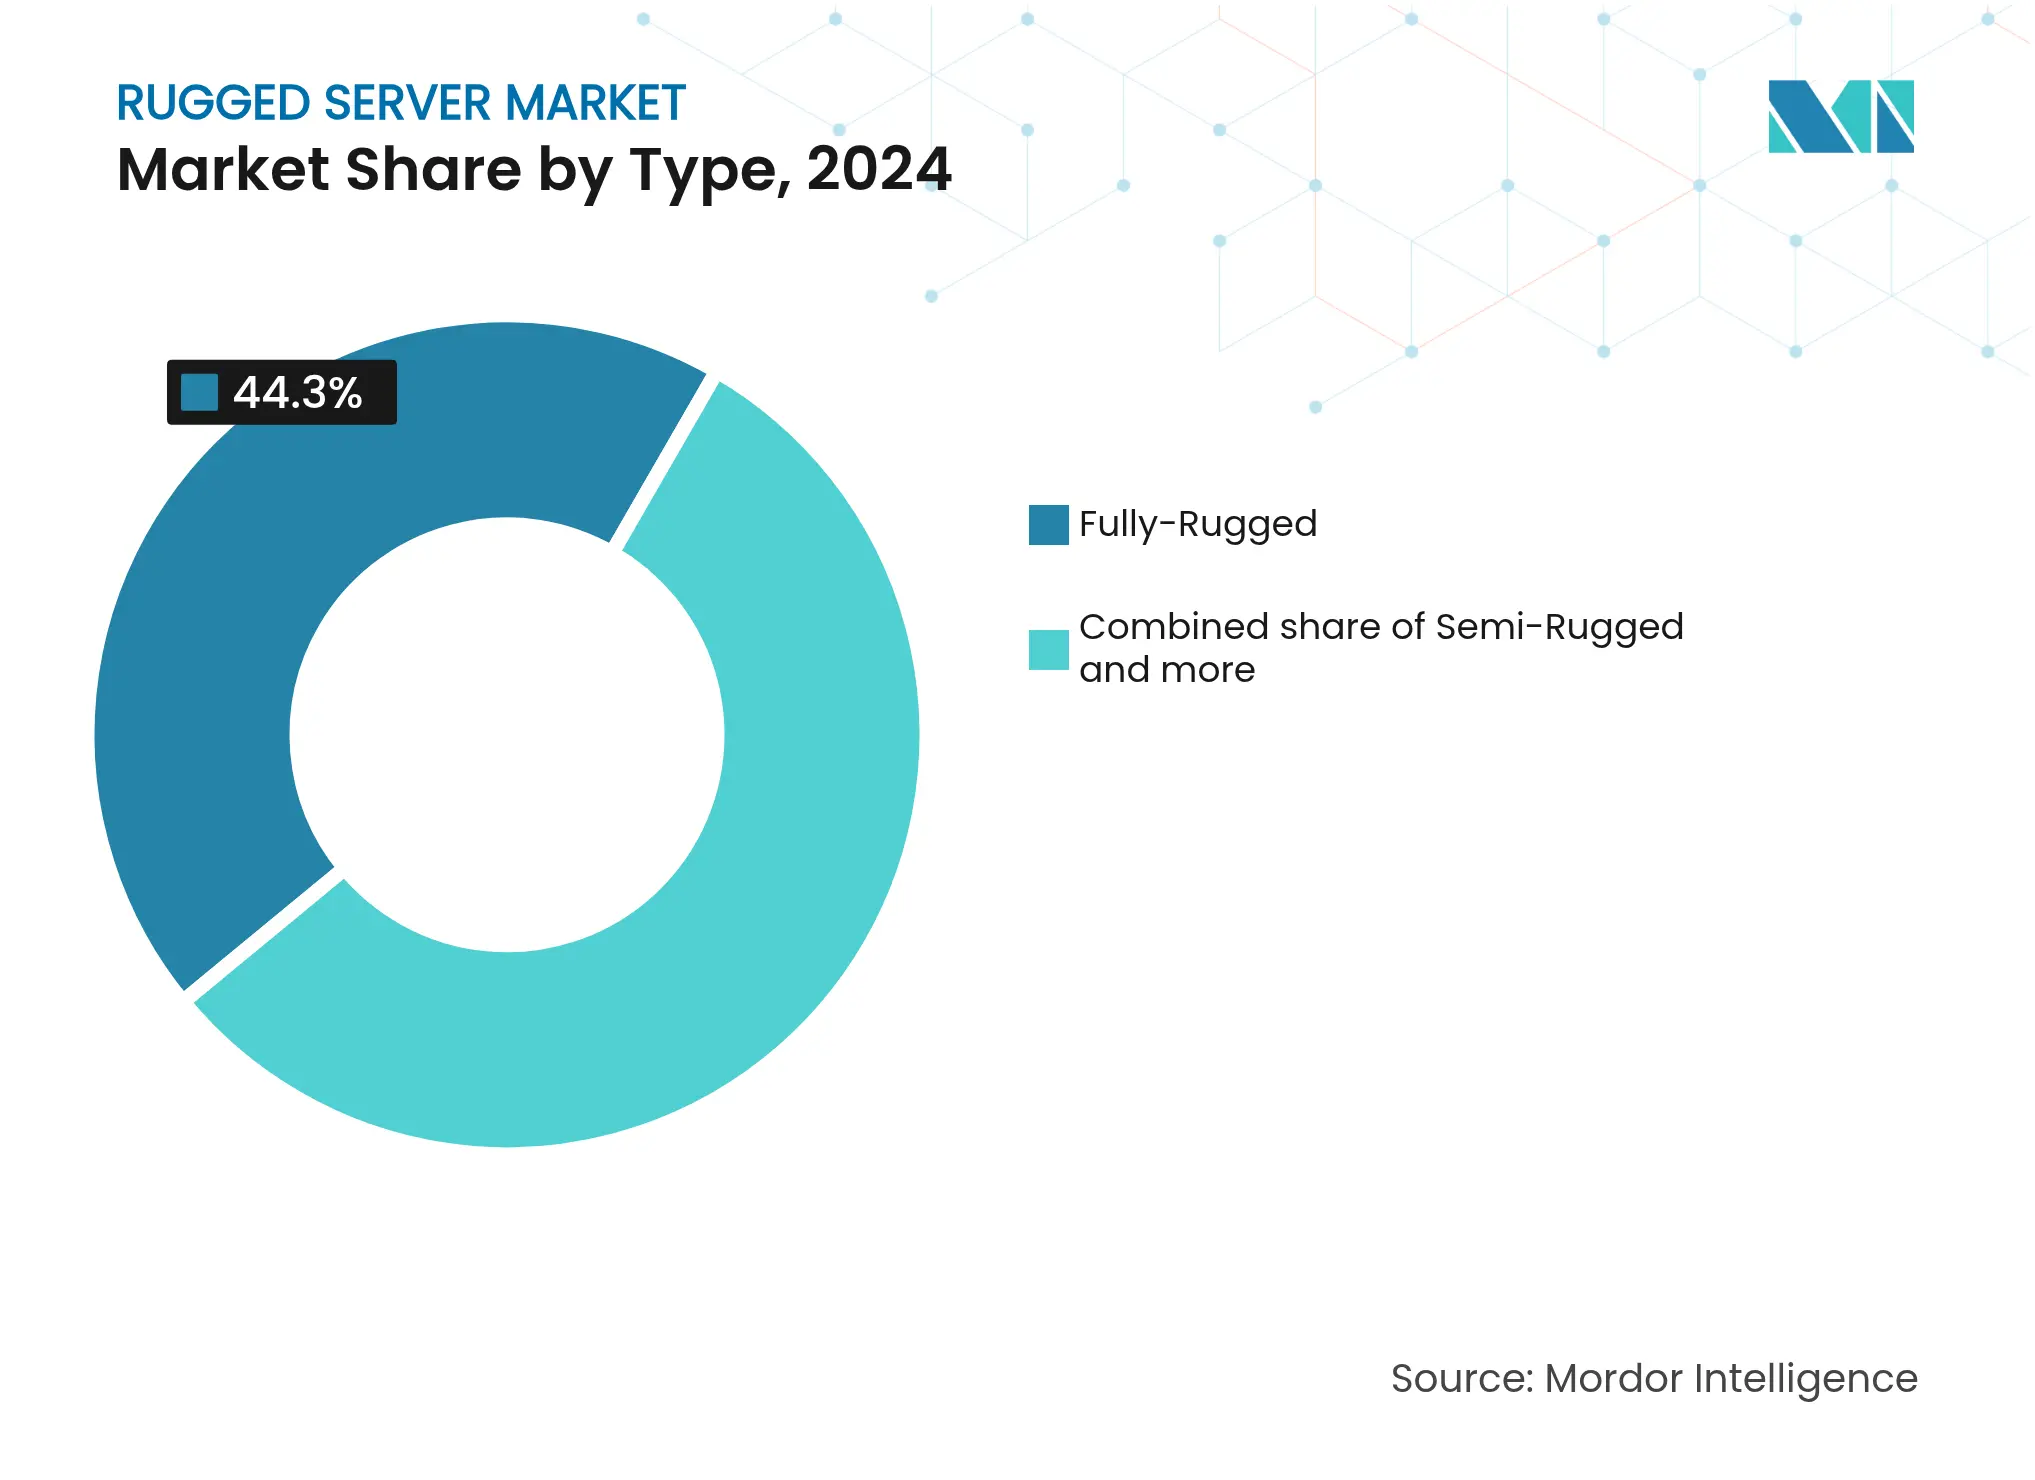
By Type: Ultra-rugged servers penetrate extreme deployments
Ultra-rugged configurations post the fastest 7.3% CAGR through 2030 thanks to drone swarms, Arctic monitoring, and deep-sea stations. Crystal Group’s RE3423M, sealed to IP67 and shock-rated to 40 g, illustrates market appetite for hermetically sealed processing nodes that function without pressurization or HVAC. Fully-rugged units maintain leadership with a 44.3% share by balancing compute density with standard MIL-STD-810 certification. Semi-rugged fills transitional needs where airflow is available and budgets remain tight. The rugged server market continues to fragment into mission-specific SKUs rather than consolidated form factors.
By Enterprise Size: SMEs accelerate edge adoption
SMEs are set to grow at 7.9% CAGR as modular appliances allow point-solution rollouts. Advantech’s NVIDIA Jetson-powered MIC-770 V3 brings AI inference and fanless cooling into sub-USD 5,000 budgets, removing historical entry barriers[3]Advantech, “MIC-770 V3 Wins IoT Edge Computing Excellence Award,” advantech.com. Large enterprises hold 65.7% share on account of broad fleet deployments across factories, depots, and forward operating bases. They drive demand for centralized management frameworks that span both data-center and field assets, nudging rugged server vendors to support mainstream software stacks such as Red Hat and VMware.
By End-user: Aerospace sets the growth pace
Aerospace leads future expansion at 7.5% CAGR as aircraft migrate to distributed processing for fly-by-wire and sensor fusion. Mercury Systems’ SOSA-aligned ROCK3 shows 20× performance gains while meeting DO-178C safety rules, revealing the direction for cockpit and UAV payload servers. Military and defense still command a 30% share due to continual upgrade cycles, but now emphasize AI model hosting and cyber-resilience. Telecom and IT sectors adopt rugged gear for rural 5G edge nodes, while oil, gas, and mining continue to need explosion-proof enclosures.

Recognized by Experts. Trusted by Leaders.
A trusted intelligence partner to global decision-makers across 90+ countries.


By Form Factor: Modular designs create flexibility
Modular/short-depth units achieve a 7.4% CAGR through 2030, driven by vehicle, shipboard, and roadside cabinet installations where space is limited. The ATMOS Server Stack integrates a 32-core Intel Xeon and NVIDIA L4 GPU in a 2U-sized sealed case, demonstrating high compute-per-litre density. Rack-mount servers remain dominant with a 48% share, favored for permanent command centers. Blade systems thrive where rapid swap-out is vital, and VPX standards dominate sensor pods requiring tight integration with RF front ends.
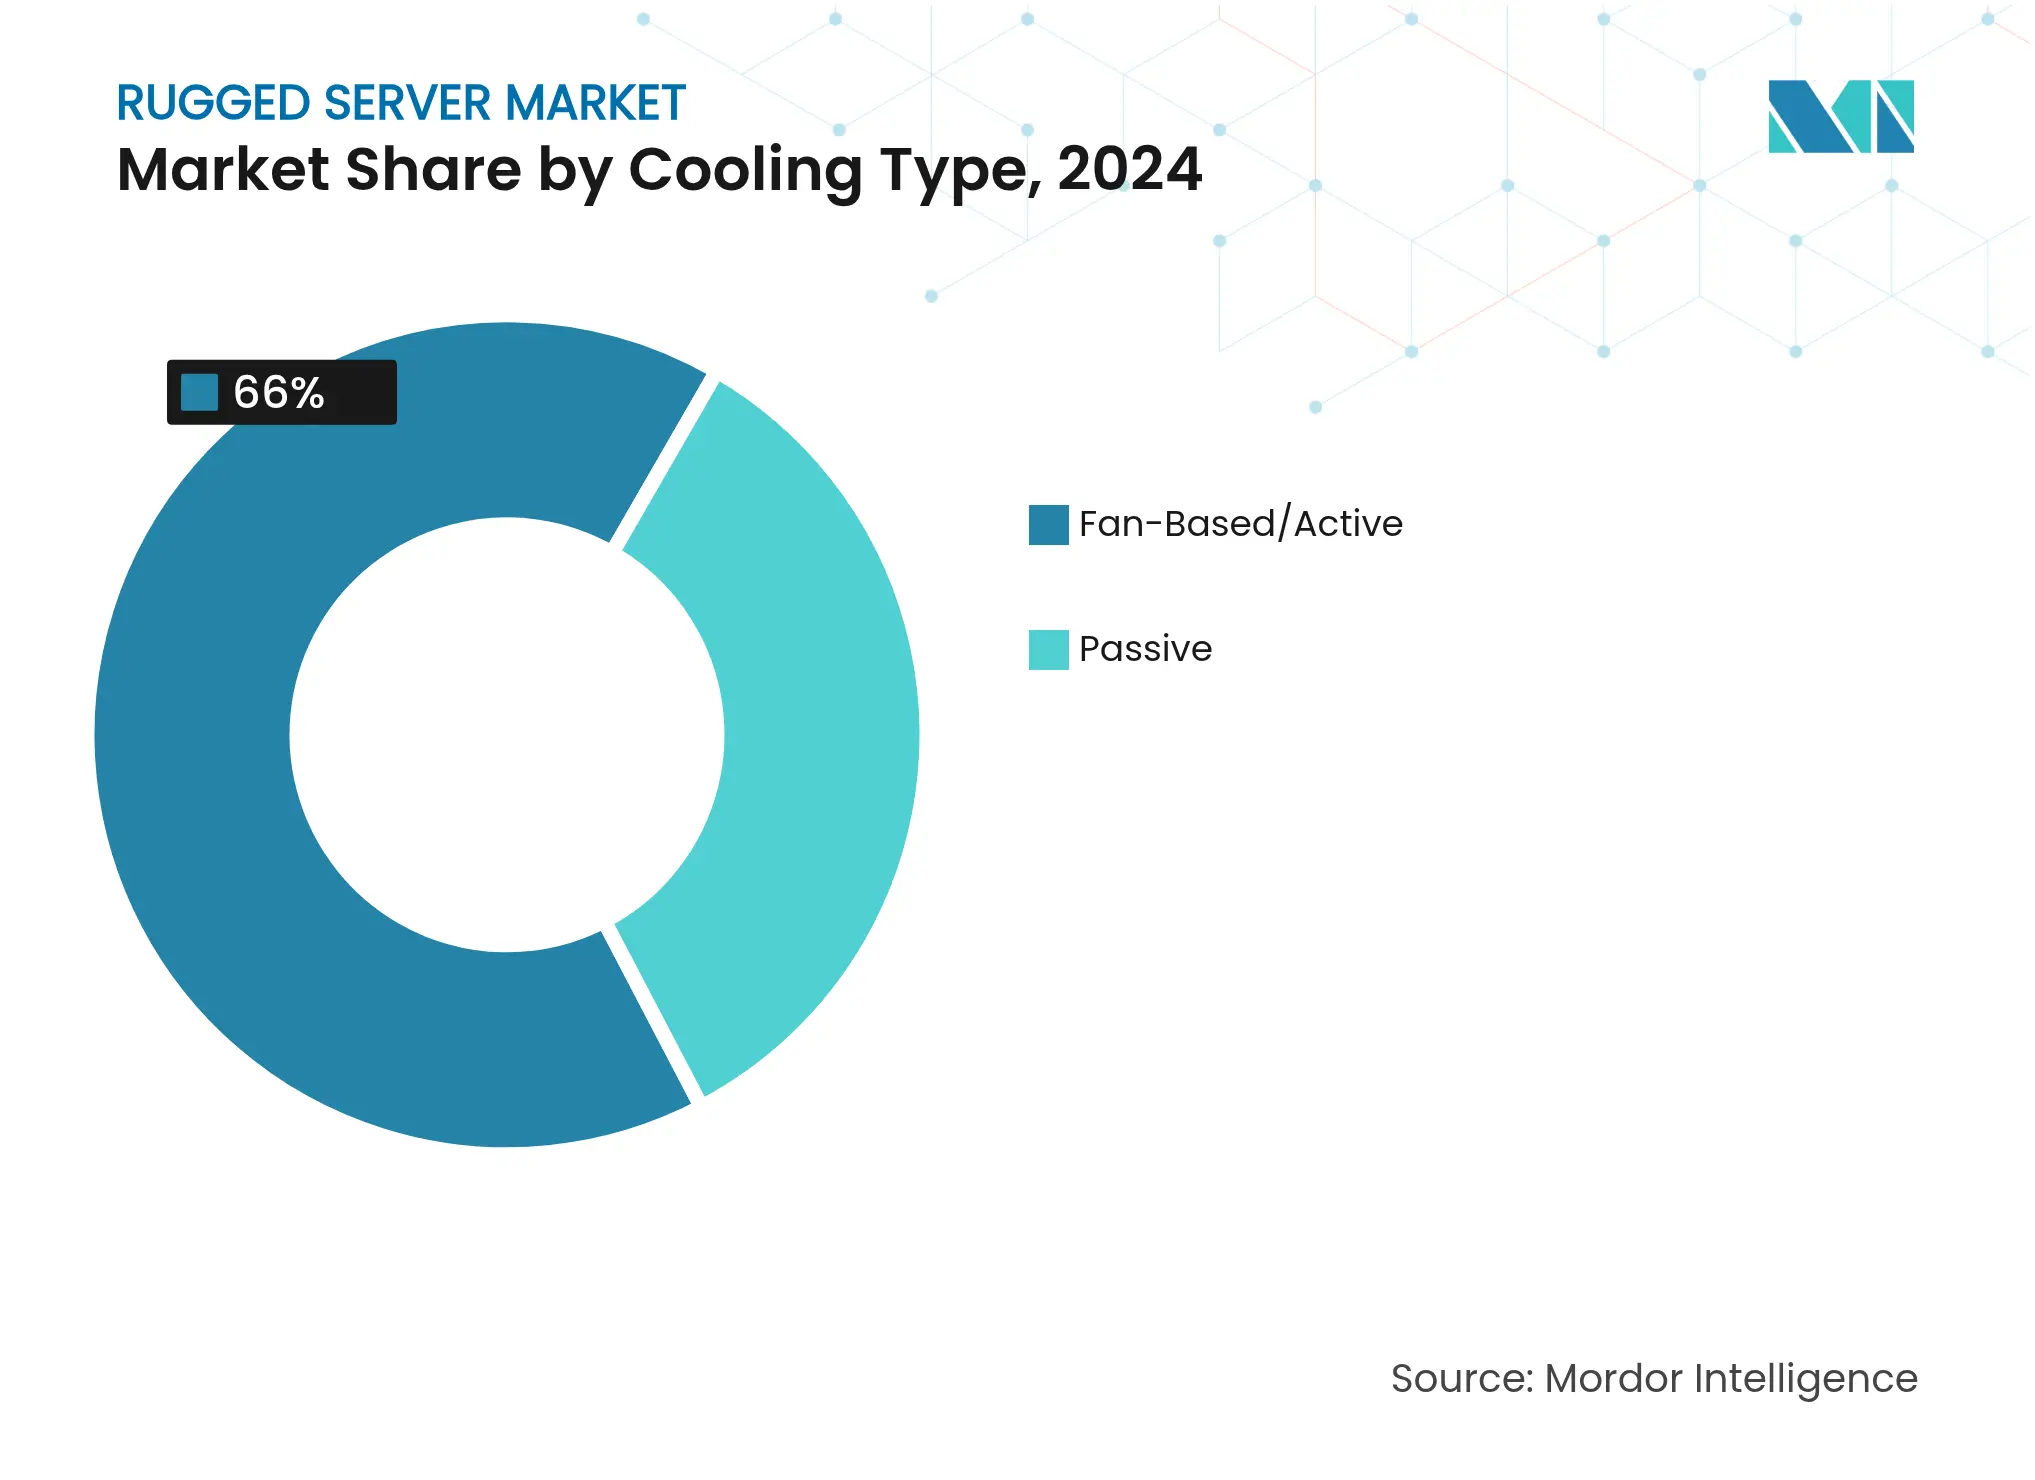
By Cooling Type: Passive systems gain reliability edge
Passive cooling climbs at 7.5% CAGR on the promise of zero moving parts. Neousys’ fanless design sustains full CPU load at 70 °C ambient, proving feasibility for desert or engine-room placement[4]Neousys Technology, “Fanless Computer Withstands 70 °C Operation,” neousys-tech.com. Active fan solutions still control 66% share because AI accelerators and high-core CPUs generate heat that conduction plates alone cannot dissipate. Hybrid liquid loops appear in specialized builds, such as KAYTUS V3’s two-phase cold plates designed for edge AI clusters.
By Memory Capacity: More than 1 TB tiers support AI
High-capacity SKUs above 1 TB sprint at 8.3% CAGR as multi-sensor fusion and on-board model training underline the need for local data staging. Meanwhile, 256-512 GB keeps the largest 46% slice of the rugged server market size, covering most real-time control applications. Suppliers balance DIMM count against shock tolerance, driving innovation in board stiffeners and power conditioning.
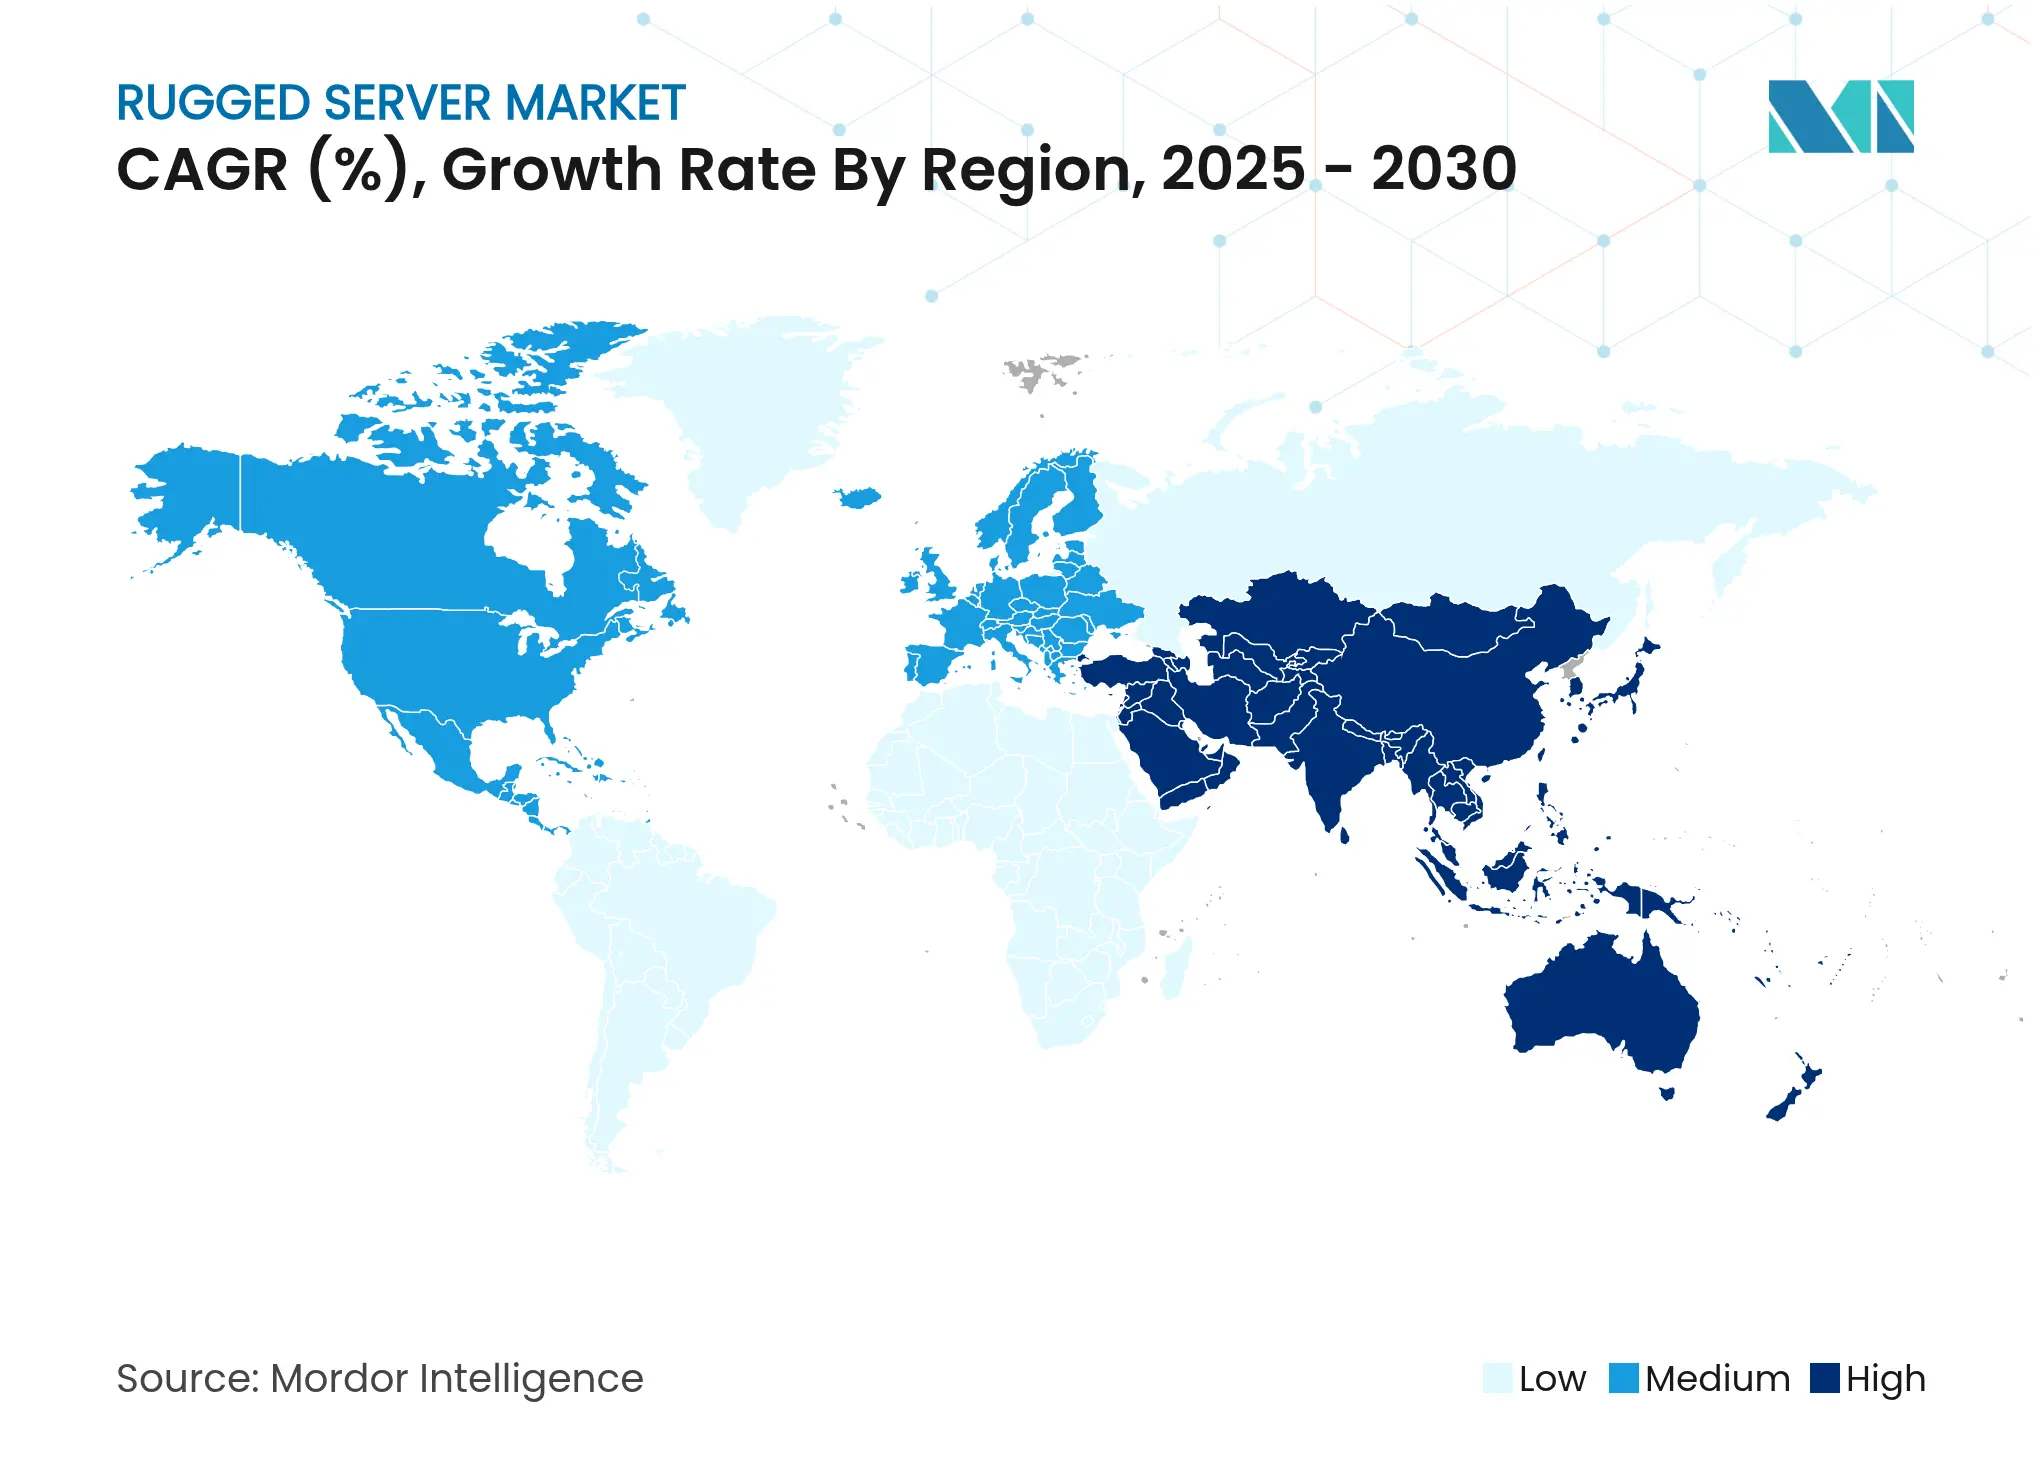
North America commands a 38% share, anchored by U.S. defense procurement and the presence of Dell Technologies, Mercury Systems, and Crystal Group. Federal investments in autonomous combat vehicles and secure communications channel substantial funding into rugged server platforms[5]U.S. Department of Defense, “Contracts For Dec. 1, 2024,” defense.gov. Industrial users, notably in aerospace manufacturing along the U.S. Sun Belt, expand the regional base.
Asia-Pacific registers the fastest 8.1% CAGR to 2030. China and India raise defense outlays for secure tactical networks, while electronics export hubs deploy rugged edge nodes to converge OT and IT. The evolving U.S.–South Korea tech pact highlights South Korean memory and foundry depth, reinforcing supply chains for rugged server components.
Europe maintains solid demand through the United Kingdom, Germany, and France as each pursues sovereign data infrastructure. Energy grids and rail operators adopt hardened compute for substation monitoring and wayside analytics. South America, led by Brazil, introduces rugged servers into homeland-security programs and Industry 4.0 lines in São Paulo state. The Middle East and Africa rely on ruggedized compute for oil-field telemetry and border surveillance, where temperature extremes test equipment limits.
Market Concentration
Market concentration is moderate. Diversified IT giants co-exist with niche specialists. Mercury Systems broadened its portfolio by acquiring Star Lab, embedding anti-tamper software into hardware to serve classified programs. Siemens fuses rugged IPCs with GPU acceleration, claiming 25-fold AI speed-ups that shorten quality-control cycles. Crystal Group and Trenton Systems exploit agility to deliver platform-specific chassis, especially for ultra-rugged or fanless builds. Acquisition pipelines focus on cybersecurity and AI middleware to extend beyond physical ruggedness toward secure, autonomous edge solutions.

*Disclaimer: Major Players sorted in no particular order
1. INTRODUCTION
2. RESEARCH METHODOLOGY
3. EXECUTIVE SUMMARY
4. MARKET LANDSCAPE
5. MARKET SIZE AND GROWTH FORECASTS (VALUES)
6. COMPETITIVE LANDSCAPE
7. MARKET OPPORTUNITIES AND FUTURE OUTLOOK
Market Definitions and Key Coverage
Segmentation Overview
Detailed Research Methodology and Data Validation
Primary Research
Desk Research
Market-Sizing and Forecasting
Data Validation and Update Cycle
Why Mordor's Rugged Server Baseline Earns Stakeholder Trust
Benchmark comparison
| Market Size | Anonymized source | Primary gap driver | ||
|---|---|---|---|---|
USD 701.85 M | Mordor Intelligence | - | Anonymized source:Mordor Intelligence | Primary gap driver:- |
USD 713.2 M | Regional Consultancy A | Counts rugged industrial PCs and applies single global ASP | ||
USD 643.8 M | Global Consultancy B | Uses 2023 currency baseline and excludes modular short-depth servers | ||
USD 652.0 M | Industry Association C | Relies on 2020 to 2021 shipment ratios with no recent defense orders |
Pricing Strategy for Semiconductor Components
3 Min Read
Accelerating Additive Manufacturing Adoption in India
3 Min Read
Unlocking Saudi Arabia’s Regional Tourism Growth Potential
5 Min Read
When decisions matter, industry leaders turn to our analysts. Let’s talk.