Data Center Blade Server Market Size and Share
Market Overview
| Study Period | 2020 - 2031 |
|---|---|
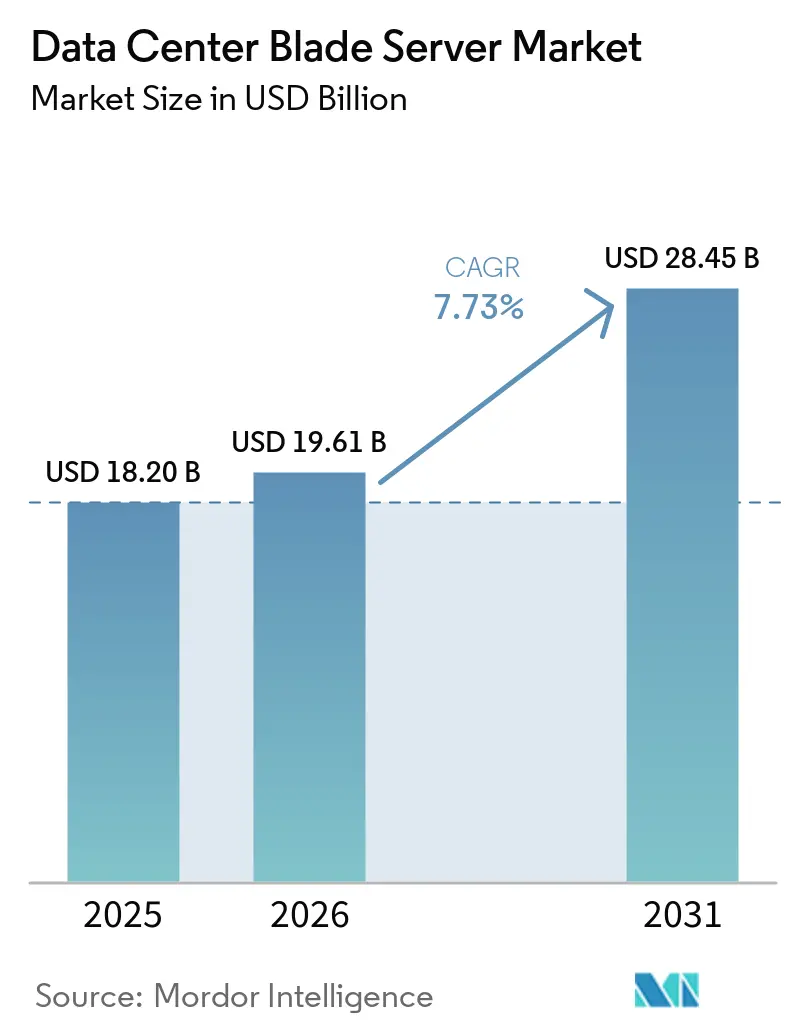
| Market Size (2026) | USD 19.61 Billion |
| Market Size (2031) | USD 28.45 Billion |
| Growth Rate (2026 - 2031) | 7.73% CAGR |
| Fastest Growing Market | Asia-Pacific |
| Largest Market | North America |
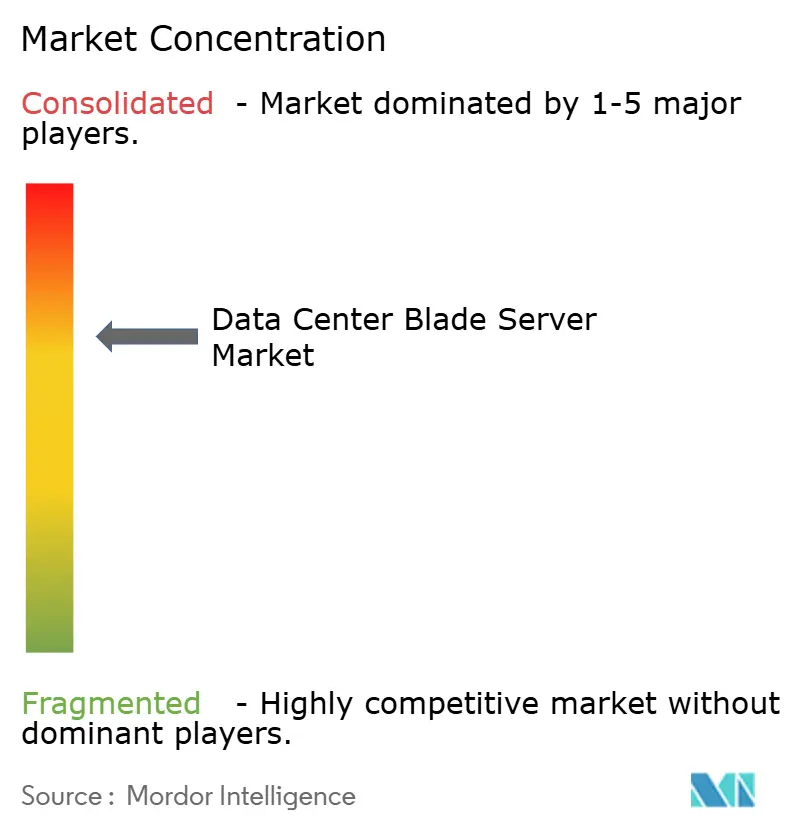
| Market Concentration | Medium |
Major Players *Disclaimer: Major Players sorted in no particular order Image © Mordor Intelligence. Reuse requires attribution under CC BY 4.0. | |
Data Center Blade Server Market Analysis by Mordor Intelligence
Data Center Blade Server market size in 2026 is estimated at USD 19.61 billion, growing from 2025 value of USD 18.2 billion with 2031 projections showing USD 28.45 billion, growing at 7.73% CAGR over 2026-2031. Rising deployment of AI and machine-learning workloads is reshaping compute density requirements, pushing vendors toward composable, disaggregated blade designs that separate compute, storage and networking resources. This architectural shift enables higher utilization and rapid workload re-allocation, while direct liquid cooling, silicon-photonics backplanes and advanced chassis management software help operators manage rack power envelopes that now exceed 30 kW. North America retains scale leadership, yet Asia-Pacific is growing faster on the back of large greenfield builds in India, China and Singapore. Colocation facilities remain the largest customer group, but hyperscalers are setting the technical agenda as they move to purpose-built AI blade systems that deliver higher rack-level efficiency.
Key Report Takeaways
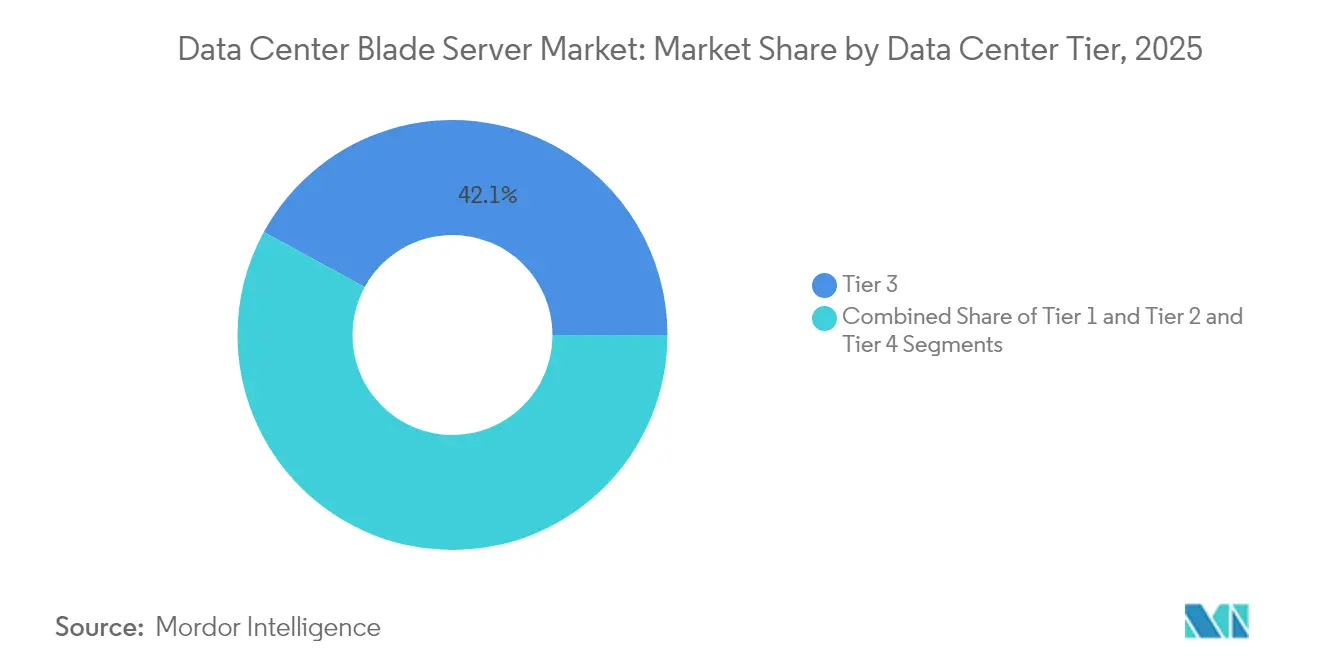
- By data-center tier, Tier 3 facilities led with 42.05% of Data Center Blade Server market share in 2025, while Tier 4 sites are projected to grow at a 11.63% CAGR to 2031.
- By form factor, half-height blades accounted for 48.02% revenue share in 2025; quarter-height and micro-blades are forecast to expand at a 13.39% CAGR through 2031.
- By application, virtualization and private cloud held 38.85% of the Data Center Blade Server market size in 2025; AI/ML workloads are set to grow at a 15.62% CAGR between 2026-2031.
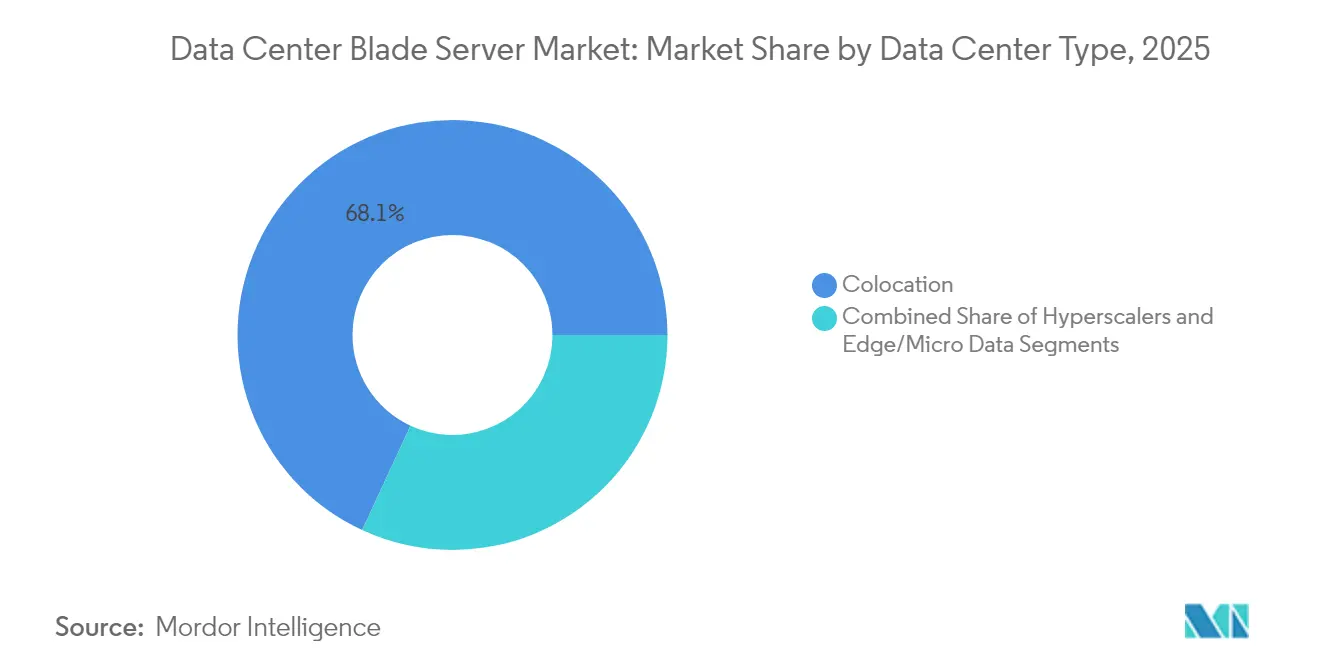
- By data-center type, colocation captured 68.10% share of the Data Center Blade Server market size in 2025, whereas hyperscalers are advancing at a 12.47% CAGR over the same period.
- By end-use industry, BFSI commanded 26.00% share in 2025, and IT-and-Telecom workloads are expected to post an 10.78% CAGR to 2031.
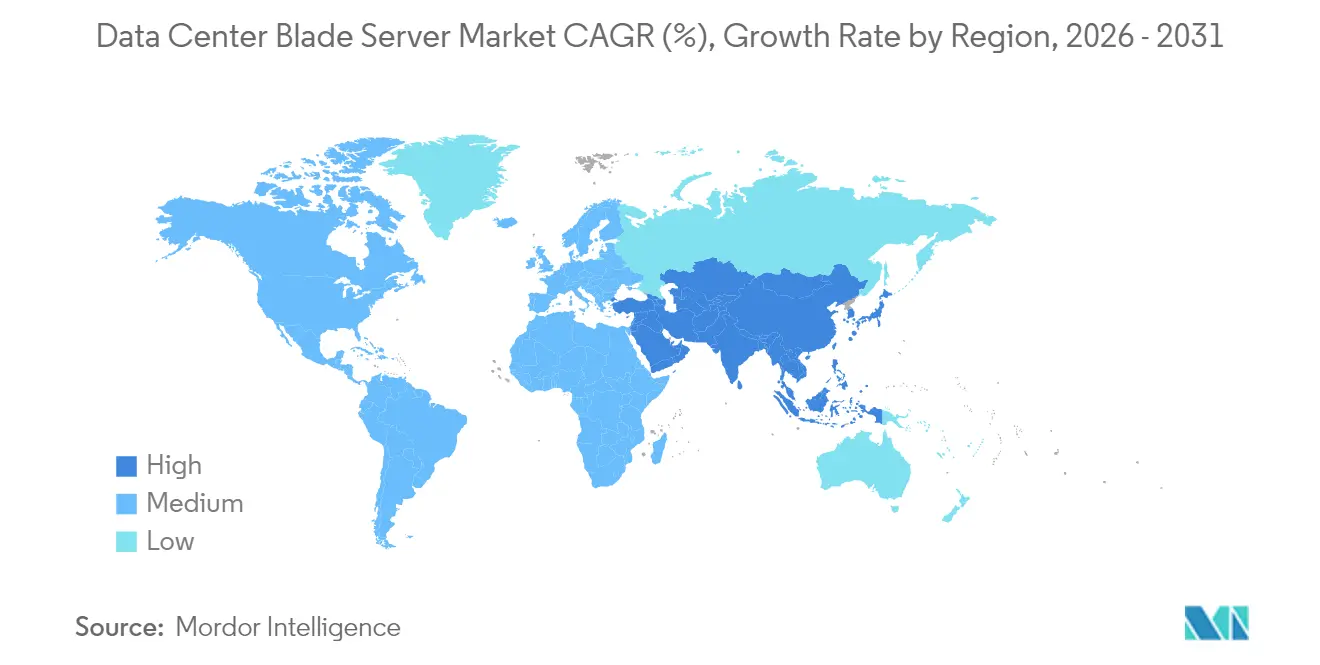
- Regionally, North America led with 41.88% share in 2025; Asia-Pacific exhibits the fastest growth at 11.92% CAGR through 2031.
Note: Market size and forecast figures in this report are generated using Mordor Intelligence’s proprietary estimation framework, updated with the latest available data and insights as of 2026.
Global Data Center Blade Server Market Trends and Insights
Drivers Impact Analysis*
| Driver | (~) % Impact on CAGR Forecast | Geographic Relevance | Impact Timeline |
|---|---|---|---|
| Surging rack-level power density accommodates AI/ML workloads | 2.8% | Global, with early gains in North America, APAC core | Medium term (2-4 years) |
| Edge-cloud convergence accelerating deployment in micro-modular DCs | 1.9% | Global, spill-over to emerging markets | Long term (≥ 4 years) |
| High server consolidation ratios lower OPEX and real-estate cost | 1.5% | North America & EU, expanding to APAC | Short term (≤ 2 years) |
| Liquid-cooling ready chassis gaining regulatory incentives (EU, Singapore) | 1.2% | EU core, Singapore, expanding to hot climate regions | Medium term (2-4 years) |
| Growing hyperscaler preference for composable disaggregated blades | 2.1% | Global hyperscale markets | Medium term (2-4 years) |
| Evergreen hardware refresh cycles (Opex model) | 0.8% | Enterprise markets globally | Long term (≥ 4 years) |
| Source: Mordor Intelligence | |||
Surging Rack-Level Power Density Accommodates AI/ML Workloads
AI inference and training clusters now push rack envelopes from 10-15 kW toward 30-50 kW. The Open Compute Project’s OSAI specification targets 250 kW to 1 MW rack architectures, encouraging blade vendors to integrate high-efficiency voltage regulators and direct liquid cooling.[1]Open Compute Project, “OCP Open Systems for Artificial Intelligence Vision,” opencompute.org Dell’s PowerEdge XE9680L demonstrates how chassis-level airflow, cold-plate loops, and AI-specific accelerators can coexist without thermal throttling. The International Energy Agency projects that AI-focused data centers could consume 945 TWh by 2030, which keeps power-efficient blade design at the center of operator strategies.[2]International Energy Agency, “Energy and AI,” iea.org
Edge-Cloud Convergence Accelerating Deployment in Micro-Modular DCs
5G rollouts and ultra-low-latency services push compute to the network edge, spawning demand for micro-modular data centers that can ship pre-wired and pre-cooled. Google’s patent for modular edge facilities confirms the importance of secure, multitenant rack assemblies with integrated power and heat exchange. Telecom operators are allocating a sizeable share of their USD 600 billion CAPEX plan to such edge sites, giving blade vendors an opening to supply quarter-height nodes tailored for constrained footprints
High Server Consolidation Ratios Lower OPEX and Real-Estate Cost
New generation dual-socket blades powered by high-core-count CPUs can replace racks of legacy equipment. Supermicro illustrates that one H14 Hyper DP server can execute 3.78× the transactions of four older units, saving up to USD 2.8 million across five years on licensing, energy, and space costs. Lenovo’s refresh studies show a 392% ROI when legacy four-socket towers are swapped for dense 4U blades, a narrative resonating with Tier 3 operators looking to recover floor space
Liquid-Cooling Ready Chassis Gaining Regulatory Incentives
The EU Ecodesign Regulation 2019/424 and Singapore’s data-center siting framework both reward facilities that adopt efficient cooling. HPE has already shipped 200,000 direct-liquid-cooled nodes and is advancing 100% fanless variants aimed at the next AI refresh cycle. Vendors able to bundle cooling distribution units with blade shelves gain a head start in the bidding process for newly permitted sites.[3]Hewlett Packard Enterprise, “HPE AI Day Transcript,” hpe.com
Restraints Impact Analysis*
| Restraint | (~) % Impact on CAGR Forecast | Geographic Relevance | Impact Timeline |
|---|---|---|---|
| CapEx spike from silicon photonics and 800 Gb E backplane migration | -1.4% | Advanced markets with high-speed requirements | Short term (≤ 2 years) |
| Supplier concentration in proprietary chassis ecosystems | -0.9% | Global, with higher impact in enterprise segments | Medium term (2-4 years) |
| Skill-gap in managing multi-fabric, disaggregated architectures | -1.1% | Global, acute in emerging markets | Long term (≥ 4 years) |
| Delayed ORAN/5G monetisation lengthening ROI for telco DCs | -0.7% | Telecom-heavy markets, particularly APAC and EU | Medium term (2-4 years) |
| Source: Mordor Intelligence | |||
CapEx Spike from Silicon-Photonics and 800 GbE Backplane Migration
Switching to photonic integrated circuits and 800 GbE fabrics unlocks latency and bandwidth gains but demands new chassis, mid-plane connectors and retimer cards. National agencies acknowledge the efficiency upside yet caution that early deployments bear heavy capital costs, particularly for mid-sized enterprises. Research into memory disaggregation over CXL suggests a multi-year payback, forcing operators to stagger upgrades
Supplier Concentration in Proprietary Chassis Ecosystems
Blade platforms often lock customers into vendor-specific mid-planes, mezzanine cards and management suites. Proprietary ecosystems from major incumbents inflate lifecycle costs and complicate hybrid cloud strategies. Industry groups such as the Open Compute Project respond with open chassis initiatives, though migration remains incremental because enterprises have extensive legacy images and tools aligned to current vendors
*Our forecasts treat driver/restraint impacts as directional, not additive. The impact forecasts reflect baseline growth, mix effects, and variable interactions.
Segment Analysis
By Data-Center Tier: Tier 4 Drives Innovation Adoption
Tier 3 facilities owned 42.05% of the Data Center Blade Server market in 2025, as their N+1 redundancy profile aligns with mainstream enterprise SLAs. Tier 4 sites, though smaller in count, are forecast to grow at 11.63% CAGR thanks to fault-tolerance demands from AI training clusters. This momentum positions Tier 4 as the proving ground for 100% liquid-cooled chassis and silicon-photonics interconnects.
Operators of Tier 1 and Tier 2 facilities, typically serving edge aggregation or branch workloads, adopt standardized blades to maintain cost discipline while gaining better automation. The Infrastructure Masons report links 90% of current power growth to AI model training, a load now propagating into even modest sites that must accommodate higher power draw and rack density. As a result, vendors are packaging kits that retrofit lower-tier rooms with containment aisles and rear-door heat exchangers, preserving momentum for the wider Data Center Blade Server market.


By Form Factor: Micro-Blades Reshape Edge Deployments
Half-height blades delivered 48.02% revenue in 2025, supporting dual-socket CPUs, ample DIMM slots and PCIe expansion for most virtualization and database tasks. They remain the workhorse of enterprise colocation racks. Full-height models continue to serve quad-socket, memory-bound workloads such as in-memory analytics.
Quarter-height and micro-blade nodes are the fastest-growing slice at 13.39% CAGR because they fit 16-32 compute sleds per 10U shelf, ideal for limited edge footprints. Vendors now integrate GPU accelerators into these compact sleds, enabling real-time inference at cell-tower sites. Compatibility with Open Rack v3 specifications allows mixed deployment inside the same cabinet, sustaining the Data Center Blade Server market’s edge expansion narrative.
By Application/Workload: AI/ML Transforms Server Requirements
Virtualization and private cloud workloads still command 38.85% of the Data Center Blade Server market size in 2025, leveraging the high memory bandwidth and hot-swap networking built into modern chassis. These environments value the consolidated management plane that blades provide across thousands of VMs.
AI and ML clusters, however, exhibit the strongest trajectory with a 15.62% CAGR as every sector integrates generative models into daily operations. OEMs respond by offering OCP-compliant sleds that host eight GPUs linked through NVLink and powered by 1000 W OCP Plus connectors. Storage-centric blades now embed EDSFF drives to feed these accelerators with sustained PCIe Gen 5 bandwidth, ensuring that the Data Center Blade Server market remains the compute backbone for data-intensive algorithms.
By Data-Center Type: Hyperscalers Drive Technical Innovation
Colocation providers held 68.10% share of the Data Center Blade Server market size in 2025, monetizing high-density cages on a per-kilo-Watt model. Popularity among SMEs and regulated industries sustains this dominance. Many new colo builds in India and Malaysia include chilled-water rear-door exchangers to qualify for AI workloads.
Hyperscalers register a 12.47% CAGR through 2031, using custom blade designs to accelerate AI training, database sharding and large-scale storage. OCP’s OSAI rack architecture was largely authored by hyperscaler engineers, underscoring their influence on roadmap priorities. Enterprises follow their lead by piloting smaller composable blade pools for latency-sensitive applications, adding further depth to the Data Center Blade Server market.
By End-Use Industry: BFSI Leads Adoption Curve
The BFSI vertical accounted for 26.00% of Data Center Blade Server market share in 2025, reflecting the sector’s appetite for deterministic latency and multi-layer redundancy in payment, risk and fraud platforms. High-core AMD and Intel blades power large-scale Monte Carlo simulations and high-frequency trading.
Telecom and cloud service providers are on an 10.78% CAGR path as they roll out 5G and ORAN frameworks that depend on edge clouds and containerized network functions. Dell’s Bare Metal Orchestrator automates blade provisioning into these telco clouds, mirroring hyperscaler methodologies. Healthcare, manufacturing, energy and public-sector agencies all lift blade demand by introducing AI inference pipelines into regulated settings, further broadening the Data Center Blade Server market.
Geography Analysis
North America controlled 41.88% of the Data Center Blade Server market in 2025, fueled by hyperscale campuses in Northern Virginia, Texas and Silicon Valley. The Lawrence Berkeley National Laboratory calculated 176 TWh of US data-center electricity use in 2023, raising urgency for liquid-cooled blades that cut facility PUEs. Canada and Mexico add incremental demand through regional sovereign-cloud and disaster-recovery zones.
Asia-Pacific is the fastest-growing theater at 11.92% CAGR from 2026-2031. China deploys massive AI cloud clusters, while India needs to expand installed capacity from 1.35 GW to 5 GW by 2030 to keep pace with digital-economy targets. Policy frameworks in Singapore award capacity licenses preferentially to designs that include high-density blades and heat-recovery chillers. Japan and Australia extend the edge footprint along subsea cable landing stations, embedding quarter-height blades for content caching. Europe shows steady expansion under strict efficiency and data-sovereignty rules. Ecodesign 2019/424 revisions encourage blade chassis that support warm-water cooling above 35 °C, easing integration with district-heat loops. The Middle East and Africa attract investment for cloud on-ramps serving fintech and gaming customers. South America’s installations cluster around Brazil’s internet exchange hubs, where operators deploy composable blades to meet seasonal traffic peaks. These regional dynamics reinforce the global relevance of the Data Center Blade Server market.

Competitive Landscape
The Data Center Blade Server market features established platforms from Dell Technologies, Hewlett Packard Enterprise and Cisco Systems that combine servers, storage and fabric management under unified toolsets. These leaders supplement x86 blades with ARM and GPU options to keep pace with AI and zero-trust workloads. Supermicro accelerates share gains by delivering building-block chassis that integrate direct liquid cooling and PCIe Gen 5 fabrics while shortening lead times through modular mass customization.
Competition pivots around vertical integration in silicon and cooling. Dell’s latest blades pair AMD EPYC 9005 CPUs with DLC cold-plates, and HPE ships fanless liquid-immersed nodes for rack-scale AI factories. Cisco reinforces its UCS line with unified fabric chips that collapse Ethernet and Fibre Channel traffic into a single lane, lowering cabling costs.
White-space opportunities lie in open-standard mid-planes that mitigate vendor lock-in and in edge-optimized micro-blades delivering 40 Gbit uplinks within 250 mm depths. Start-ups such as Liqid enable composable flash and GPU pools that attach over PCIe fabric, letting operators re-balance resources dynamically. Regulatory pressure from ENERGY STAR 4.0 continues to push the ecosystem toward higher efficiency targets, ensuring that power-and-cooling innovation remains central to competitive strategy
Data Center Blade Server Industry Leaders
Cisco Systems Inc.
Hewlett Packard Enterprise Co
Dell, Inc.
Huawei Technologies
Lenovo Group
- *Disclaimer: Major Players sorted in no particular order

Recent Industry Developments
- May 2025: Dell Technologies released the PowerEdge M7725 blade server, designed for high-density computing with two AMD EPYC 9005 Series processors and Direct Liquid Cooling, compliant with Open Rack v3 specifications.
- March 2025: Supermicro introduced a petascale all-flash storage blade using the NVIDIA Grace CPU, supporting 983 TB per node and scaling to 39.3 PB per rack.
- January 2025: The Open Compute Project launched the Open Systems for AI (OSAI) initiative to standardize modular AI server racks supporting 250 kW–1 MW power envelopes. Open Compute Project
- January 2025: Supermicro began volume shipments of max-performance servers featuring Intel Xeon 6900 processors with direct-to-chip liquid cooling for AI and HPC workloads. Supermicro
- October 2024: Hewlett Packard Enterprise highlighted progress in direct liquid cooling and hybrid-cloud blades, noting shipment of over 200,000 DLC nodes since 2018. Hewlett Packard Enterprise
- September 2024: The Open Compute Project Global Summit showcased disaggregated blade prototypes and generative-AI rack designs with automated coolant distribution. Open Compute Project


Research Methodology Framework and Report Scope
Market Definitions and Key Coverage
Our study defines the data center blade server market as the annual value of newly built x86- and ARM-based blade nodes plus their first-time chassis sold into hyperscale, colocation, enterprise, and edge facilities worldwide. Each node must operate as an independent server while sharing power, cooling, and management inside a multi-slot enclosure.
Scope exclusion: Refurbished units, aftermarket chassis upgrades, rack or tower servers, and standalone fabric switches fall outside this scope.
Segmentation Overview
- By Data-Center Tier
- Tier 1 and 2
- Tier 3
- Tier 4
- By Form Factor
- Half-height Blades
- Full-height Blades
- Quarter-height / Micro-blades
- By Application / Workload
- Virtualisation and Private Cloud
- High-Performance Computing (HPC)
- Artificial Intelligence/Machine Learning and Data Analytics
- Storage-centric
- Edge / IoT Gateways
- By Data Center Type
- Hyperscalers/Cloud Service Provider
- Colocation Facilities
- Enterprise and Edge
- By End-use Industry
- BFSI
- IT and Telecom / CSPs
- Healthcare and Life-Sciences
- Manufacturing and Industry 4.0
- Energy and Utilities
- Government and Defence
- By Geography
- North America
- United States
- Canada
- Mexico
- Europe
- United Kingdom
- Germany
- France
- Italy
- Spain
- Rest of Europe
- Asia-Pacific
- China
- Japan
- India
- Singapore
- Australia
- Malaysia
- Rest of Asia-Pacific
- South America
- Brazil
- Chile
- Argentina
- Rest of South America
- Middle East
- United Arab Emirate
- Saudi Arabia
- Turkey
- Rest of Middle East
- Africa
- South Africa
- Nigeria
- Rest of Africa
- North America
Detailed Research Methodology and Data Validation
Primary Research
Mordor analysts interviewed data-center operators, OEM product managers, and integrators across North America, Europe, and Asia-Pacific. These discussions clarified live chassis utilization, shipment mix between half- and full-height blades, and the premium paid for liquid-ready frames, enabling us to adjust preliminary desk figures and stress-test cost trajectories.
Desk Research
We began with public datasets from bodies such as the Uptime Institute, the U.S. Energy Information Administration, China's MIIT, and Eurostat, which quantify data-center counts, power density, and server refresh cycles. Trade associations like the Open Compute Project, the Ethernet Alliance, and the Japan Data Center Council supplied adoption ratios for high-density enclosures. Corporate filings, investor decks, and patent libraries accessed through D&B Hoovers and Questel helped us map vendor revenue splits and emerging cooling designs. News and deal screens on Dow Jones Factiva added pricing clues from recent hyperscale frame contracts. This list is illustrative; many other open-source and proprietary references informed our desk analysis.
Market-Sizing & Forecasting
A top-down build converts installed rack capacity and utilization rates into an addressable blade compute pool before applying blade penetration ratios that we validated through interviews. Select bottom-up checks, sampled OEM shipments and channel ASP × volume, were layered on to fine-tune totals. Key variables include data-center megawatt additions, average server refresh interval, workload mix shifting toward AI/ML, growing edge footprints, and average rack-level power density. We forecast with a multivariate regression that links blade uptake to those drivers and then scenario-test currency and energy-price swings. Data gaps were bridged with midpoint assumptions vetted by at least two industry experts.
Data Validation & Update Cycle
Outputs pass anomaly checks against customs records, quarterly vendor disclosures, and IDC shipment indices. A second analyst reviews variances, after which results enter our report. We refresh the model every twelve months and reopen it sooner if a material event, such as a major silicon launch or hyperscale merger, alters market calculus.
Why Mordor's Data Center Blade Server Baseline Commands Confidence
Published values often diverge because studies differ on whether they fold rack servers into totals, the cadence at which new AI cabinets reset ASPs, and how quickly edge pods roll out.
Key gap drivers include scope leakage into rack platforms, optimistic ASP escalation, limited regional coverage, or slower refresh assumptions. Mordor's model fixes scope on blade-only hardware, aligns currencies quarterly, and updates load factors annually, giving decision-makers a steady, transparent baseline.
Benchmark comparison
| Market Size | Anonymized source | Primary gap driver |
|---|---|---|
| USD 18.20 B | Mordor Intelligence | - |
| USD 20.63 B | Global Consultancy A | Includes rack blades; assumes uniform 9 % ASP rise |
| USD 26.86 B | Research House B | Treats chassis revenue as recurring; smaller geography set |
| USD 19.75 B | Industry Tracker C | Uses shipment units without live price normalization |
Taken together, the comparison shows that our disciplined scope, timely refresh, and dual-layer sizing keep Mordor's numbers balanced and repeatable, offering stakeholders a dependable yardstick amid shifting server architectures.


Key Questions Answered in the Report
What is the current Data Center Blade Server Market size?
The Data Center Blade Server Market is projected to register a CAGR of 7.73% during the forecast period (2026-2031)
What is the current size of the Data Center Blade Server market?
The Data Center Blade Server market size stands at USD 19.61 billion in 2026 and is projected to reach USD 28.45 billion by 2031.
Which data-center tier deploys the most blade servers today?
Tier 3 facilities lead with 42.05% market share because their N+1 redundancy balances uptime and cost for mainstream enterprise workloads.
How fast is the AI/ML workload segment growing inside blade environments?
AI/ML workloads on blades are forecast to expand at a 15.62% CAGR from 2026-2031, far outpacing traditional virtualization.
Why are liquid-cooled blades gaining traction?
Regulations in the EU and Singapore reward efficient cooling, and AI racks often exceed 30 kW, making direct liquid cooling essential for performance and energy savings
Which region is expanding blade server capacity the fastest?
Asia-Pacific is the fastest-growing region, poised for a 11.92% CAGR as countries such as India, China and Singapore build new hyperscale and edge sites.
What factors restrain wider blade adoption in mid-sized enterprises?
High upfront CapEx for silicon-photonics backplanes and reliance on proprietary chassis ecosystems slow deployment for operators with constrained budgets.
Page last updated on:


