
Robotic Assisted Surgery Systems Market Size and Share
Market Overview
| Study Period | 2020 - 2031 |
|---|---|
| Market Size (2026) | USD 12.76 Billion |
| Market Size (2031) | USD 23.86 Billion |
| Growth Rate (2026 - 2031) | 13.33 % |
| Fastest Growing Market | North America |
| Largest Market | Asia Pacific |
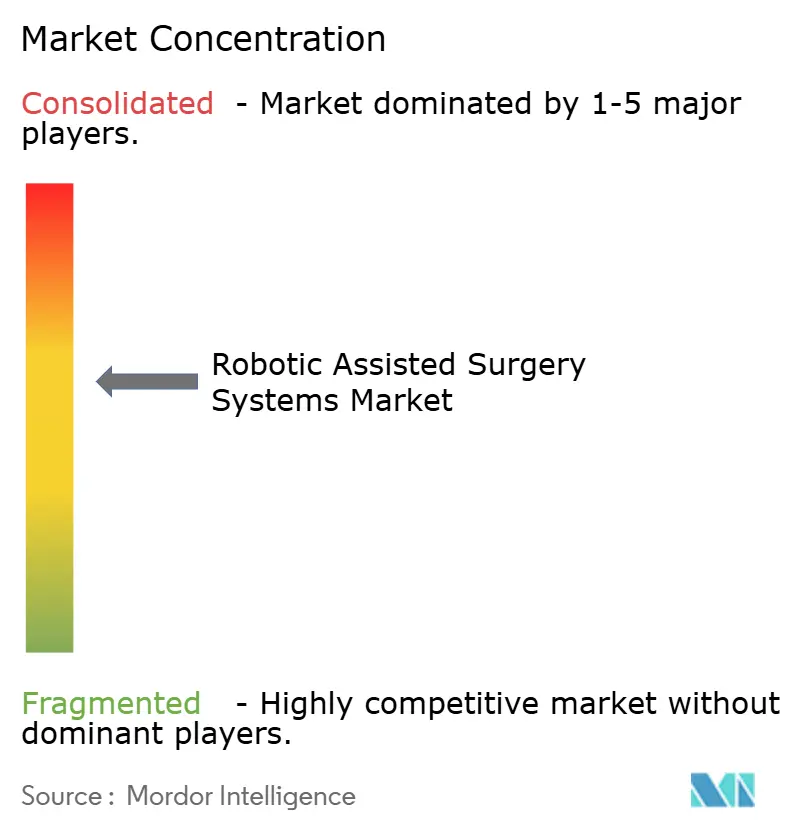
| Market Concentration | Medium |
Major Players *Disclaimer: Major Players sorted in no particular order Image © Mordor Intelligence. Reuse requires attribution under CC BY 4.0. | |
Robotic Assisted Surgery Systems Market Analysis by Mordor Intelligence
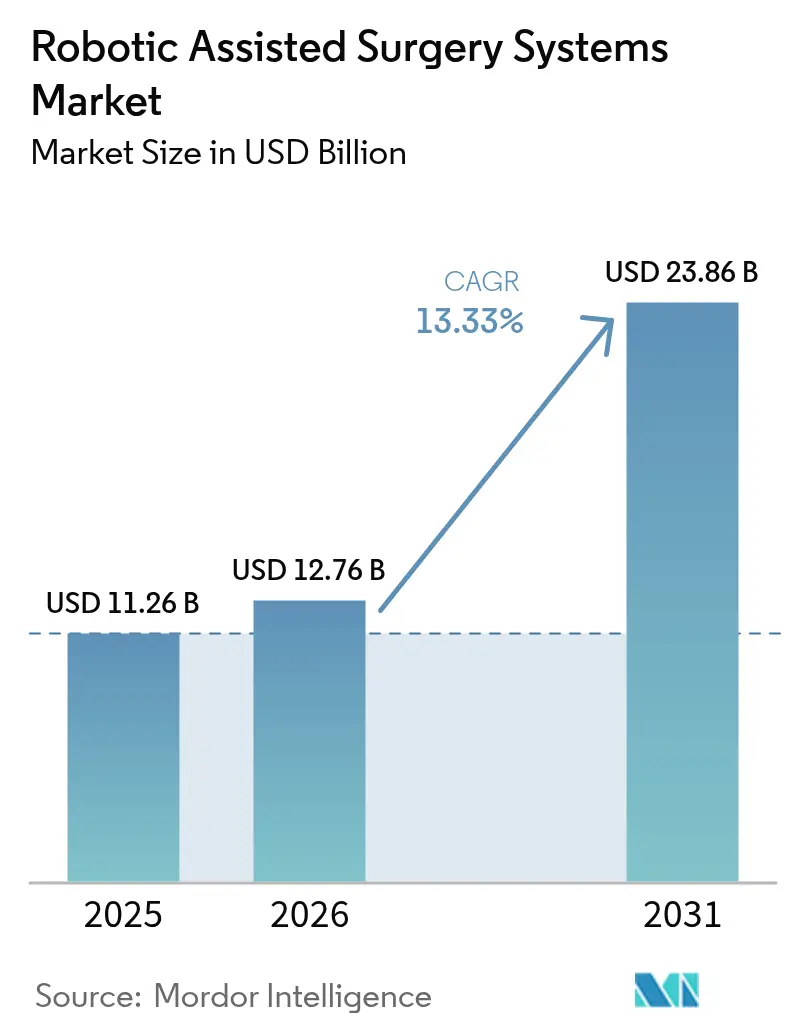
The Robotic Assisted Surgery Systems Market size is expected to increase from USD 11.26 billion in 2025 to USD 12.76 billion in 2026 and reach USD 23.86 billion by 2031, growing at a CAGR of 13.33% over 2026-2031.
Rising demand for minimally invasive procedures, growing surgeon preference for ergonomic consoles, and steady reimbursement support in major economies are sustaining the double-digit trajectory. Hospitals and ambulatory surgery centers are deploying platforms to shorten patient recovery windows, standardize outcomes, and monetize data-driven software modules. Regulatory clarity has improved since the U.S. Food and Drug Administration (FDA) introduced its three-tier autonomy framework in 2024, encouraging vendors to embed artificial intelligence into next-generation systems. Competitive intensity is accelerating as domestic manufacturers in Asia-Pacific undercut incumbent pricing by 30% to 40%, forcing established suppliers to refresh value propositions around haptics, interoperability, and recurring software revenue.
Key Report Takeaways
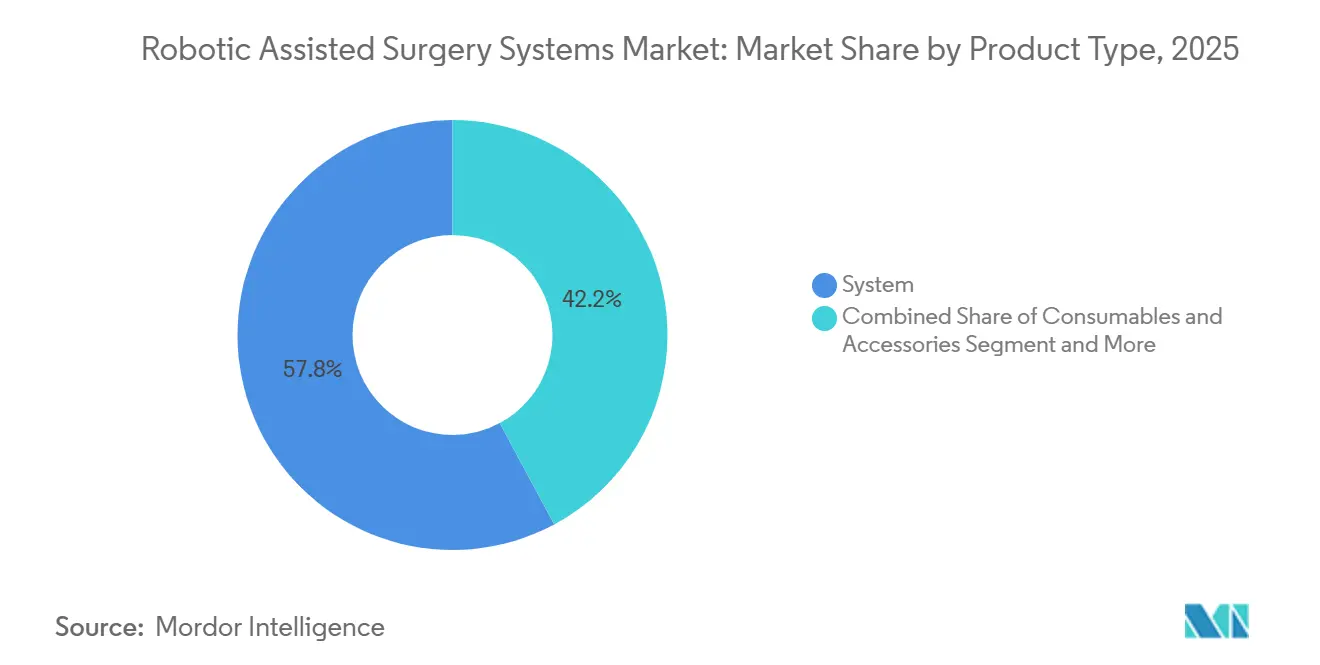
- By product type, systems commanded 57.84% of robotic assisted surgery systems market share in 2025, while Software & services is forecast to grow at a 15.65% CAGR through 2031, reflecting a shift toward recurring digital revenue.
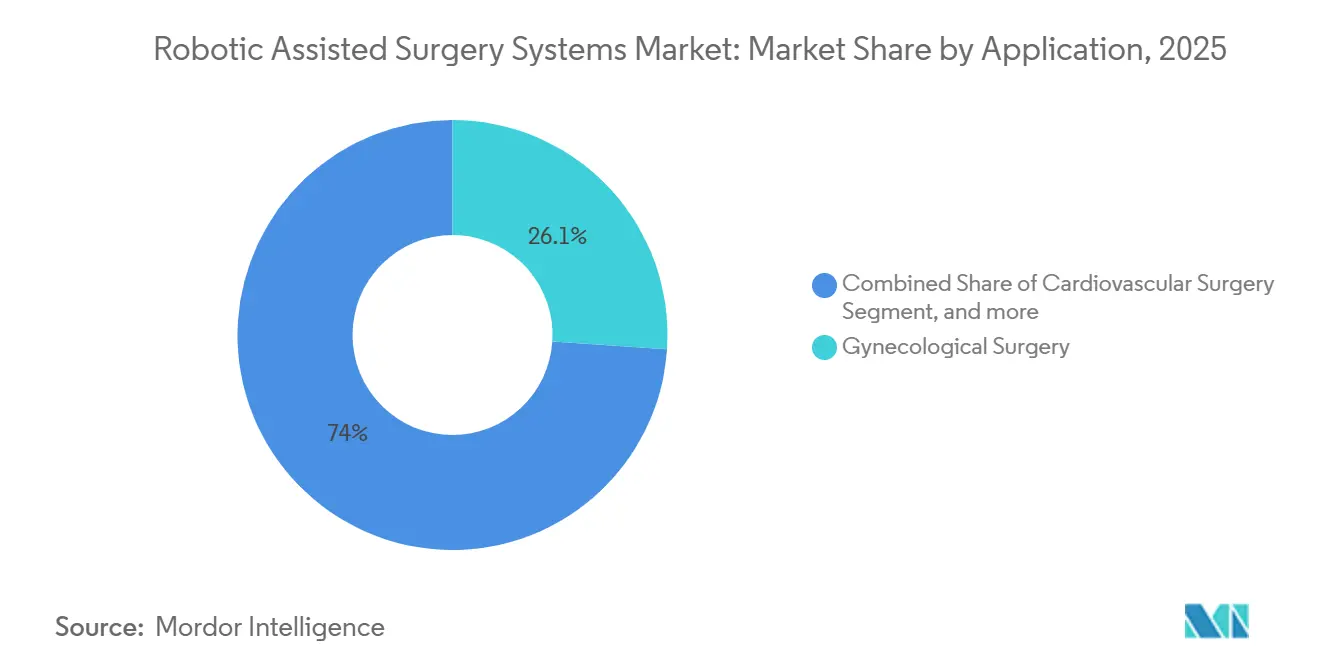
- By application, gynecological surgery led with 26.05% share in 2025; Neurosurgery is projected to expand at a 16.11% CAGR through 2031 as stereotactic frame integration gains clinical traction.
- By end user, hospitals held 45.62% share in 2025, yet ambulatory surgery centers are expected to advance at a 16.43% CAGR to 2031 on payer incentives for outpatient procedures.
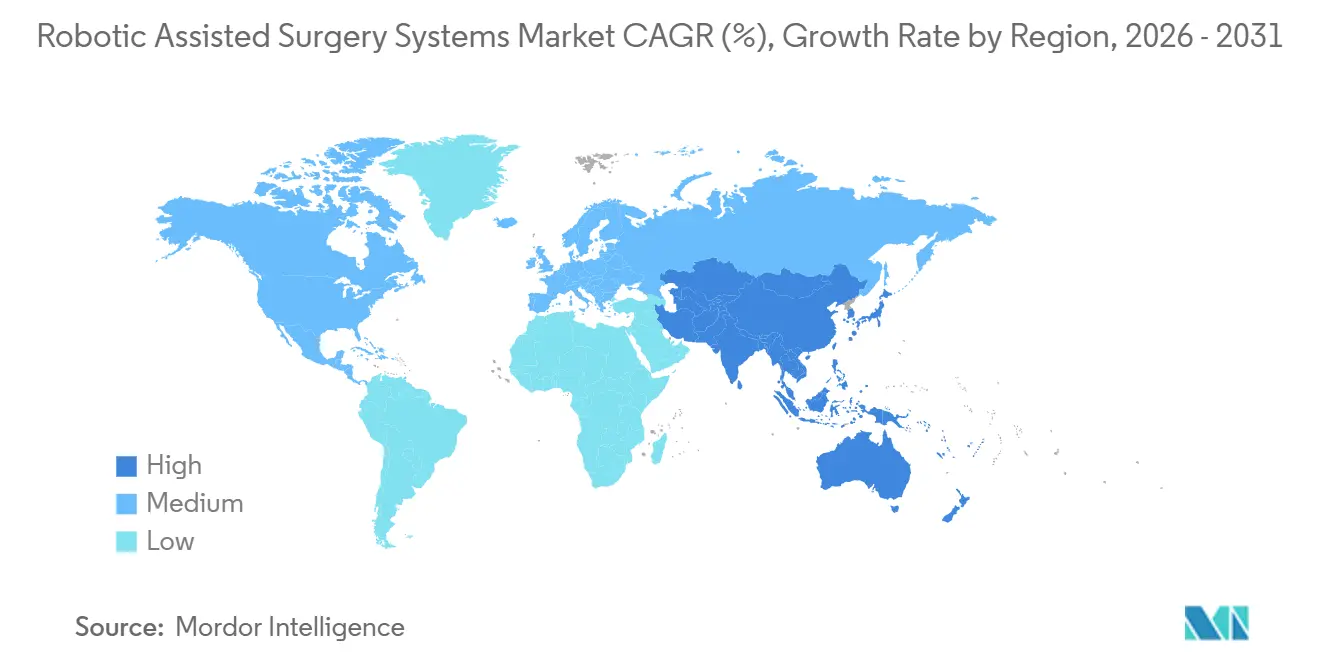
- By geography, North America accounted for 43.54% share in 2025, whereas Asia-Pacific is set to grow at a 14.65% CAGR driven by cost-competitive domestic platforms.
Note: Market size and forecast figures in this report are generated using Mordor Intelligence’s proprietary estimation framework, updated with the latest available data and insights as of 2026.
Market Trends and Insights
Drivers Impact Analysis of Robotic Assisted Surgery Systems Market*
| Driver | (~) % Impact on CAGR Forecast | Geographic Relevance | Impact Timeline |
|---|---|---|---|
| Technological Advancements in Surgical Robotics | +3.2% | Global, with early adoption in North America and Western Europe | Medium term (2-4 years) |
| Growing Preference for Minimally Invasive Procedures | +2.8% | Global, particularly strong in North America, Europe, and urban Asia-Pacific | Short term (≤ 2 years) |
| Increasing Geriatric Patient Base and Disease Incidence | +2.1% | Global, with pronounced impact in Japan, South Korea, and Southern Europe | Long term (≥ 4 years) |
| Expanding Clinical Evidence Supporting Robotic Outcomes | +1.9% | North America and Europe, gradually extending to Asia-Pacific | Medium term (2-4 years) |
| Rising Investments and Funding in Digital Surgery Platforms | +1.7% | North America, Europe, and China | Short term (≤ 2 years) |
| Surgeons' Demand for Precision, Consistency, and Efficiency | +1.6% | Global, with strongest pull in high-volume tertiary centers | Medium term (2-4 years) |
| Source: Mordor Intelligence | |||
Technological Advancements in Surgical Robotics
Continuous hardware and software iterations are shrinking performance gaps with open surgery. The FDA cleared Intuitive Surgical’s da Vinci 5 in March 2024, enabling real-time haptic feedback that helps surgeons differentiate tissue planes. Machine-learning navigation modules lowered positive margin rates in robotic prostatectomy by 18% in a 2025 multi-center study published in The Lancet Digital Health[1]The Lancet Digital Health, “AI Boundary Detection in Prostatectomy,” lancetdigitalhealth.com. Level-3 autonomous functions now account for 6% of cleared devices, indicating regulatory acceptance of conditional autonomy. Modular designs, such as CMR Surgical’s Versius, allow deployment in operating rooms 30% smaller than those of legacy multi-port platforms, widening the addressable facilities. These features collectively reinforce the robotic-assisted surgery systems market growth outlook.
Growing Preference for Minimally Invasive Procedures
Payers and patients increasingly favor shorter stays and faster returns to work. The American Association of Gynecologic Laparoscopists reported that robotic hysterectomy accounted for 57% of benign cases at U.S. academic centers in 2025, up 9 percentage points in 2 years, citing lower blood loss and faster discharge[2]American Association of Gynecologic Laparoscopists, “Robotic Hysterectomy Trends 2025,” aagl.org. Stryker’s registry of 8,400 total knee arthroplasties found 92% patient satisfaction at 12 months when the Mako robot was used, versus 84% with manual tools. Ambulatory surgery centers secure 15%-20% higher reimbursement than laparoscopy, yet only 8% had installed a robot by mid-2025 due to capital hurdles. Vendors are introducing leasing plans and single-port designs to close this gap, a move expected to accelerate the penetration of robotic-assisted surgery systems.
Increasing Geriatric Patient Base and Disease Incidence
Demographic aging enlarges the pool of candidates who benefit from minimally invasive approaches. Japan’s population over 65 hit 29.1% in 2025, and robotic colorectal cancer procedures rose 22% year-on-year as surgeons sought to limit physiologic stress in frail patients. The U.S. National Cancer Institute forecasts 299,010 prostate cancer diagnoses in 2026, with 85% of patients opting for robotic radical prostatectomy, citing better continence and potency outcomes. Orthopedic demand follows a similar arc; the American Academy of Orthopaedic Surgeons projects a 5.2% annual increase in total knee replacements among seniors through 2030, strengthening the robotic-assisted surgery systems industry's revenue base.
Expanding Clinical Evidence Supporting Robotic Outcomes
Peer-reviewed studies increasingly demonstrate superiority in select indications. A 2024 JAMA Surgery meta-analysis covering 12,800 patients showed that robotic rectal resection lowered anastomotic leak rates to 4.2% compared with 7.1% for laparoscopy. The European Association of Urology upgraded robotic partial nephrectomy to preferred status in its 2025 guidelines due to shorter warm ischemia times and improved margin control. Globus Medical’s ExcelsiusGPS cut pedicle screw misplacement to 1.8% against 5.4% for freehand fluoroscopy, according to a 2025 Spine journal study. Yet NICE concluded robotic hysterectomy adds GBP 1,200 per procedure without incremental quality-adjusted life years, limiting U.K. National Health Service uptake.
Restraints Impact Analysis of Robotic Assisted Surgery Systems Market*
| Restraint | (~) % Impact on CAGR Forecast | Geographic Relevance | Impact Timeline |
|---|---|---|---|
| High Capital and Operational Expenditure | -2.4% | Global, most acute in emerging markets and mid-tier hospitals | Short term (≤2 years) |
| Stringent and Fragmented Regulatory Requirements | -1.3% | Europe (MDR) and China (NMPA) | Medium term (2-4 years) |
| Data Security and Patient Privacy Concerns | -0.9% | Global, pronounced where cross-border data transfer is restricted | Short term (≤2 years) |
| Technical Limitations and Steep Learning Curve | -1.1% | Global, especially in low-volume centers lacking specialized training | Medium term (2-4 years) |
| Source: Mordor Intelligence | |||
High Capital and Operational Expenditure
A da Vinci Xi costs roughly USD 2 million, with annual service contracts of USD 150,000-200,000 and disposable instruments adding USD 2,000-3,500 per case. Health Affairs calculated a 7.2-year payback for a 400-bed hospital performing 300 cases annually under Medicare tariffs, exceeding the typical 5-year hurdle rate[3]Health Affairs, “Hospital ROI on Surgical Robotics,” healthaffairs.org. Rural U.S. hospitals cite capital limits as the top adoption barrier, and exclusive instrument tie-ins prompted an ongoing Federal Trade Commission probe in 2024 that alleges 30%-40% price inflation. Import duties and currency swings further constrain emerging-market uptake, capping near-term robotic assisted surgery systems market size in those regions.
Stringent and Fragmented Regulatory Requirements
Europe’s Medical Device Regulation mandates full clinical evaluation even for FDA-cleared robots, adding 12-18 months and up to EUR 2 million in costs per platform. China’s 2025 cybersecurity rules require local data storage and annual penetration tests, delaying product registrations by up to nine months. The FDA’s autonomy framework compels Level-3 devices to provide clinical evidence from at least 200 procedures, a hurdle smaller firms struggle to meet. Region-specific software classifications force vendors to maintain separate code bases, elongating commercialization timelines and damping the robotic assisted surgery systems market’s near-term velocity.
*Our forecasts treat driver/restraint impacts as directional, not additive. The impact forecasts reflect baseline growth, mix effects, and variable interactions.
Robotic Assisted Surgery Systems Market Segment Analysis
By Product Type:
Software Subscriptions Outpace Hardware SalesSystems captured 57.84% of robotic assisted surgery systems market share in 2025, underscoring the capital-intensive nature of platform rollout. Nevertheless, Software & Services is projected to surge at a 15.65% CAGR through 2031 as hospitals prioritize training simulators, AI navigation, and analytics dashboards that deepen recurring revenue. The robotic assisted surgery systems market size for Software & Services is expected to expand faster than Systems, supported by Medtronic’s Touch Surgery Enterprise, which booked USD 180 million in 2025 recurring sales across 420 hospitals.
Instrument consumables scale directly with volume. Intuitive’s installed base delivered 1.9 million procedures in 2025, translating into roughly USD 5.7 billion instrument revenue. Open-architecture platforms such as Hugo RAS promote third-party integration, while CMR Surgical’s Versius lowers the entry price by 40%, accelerating adoption in mid-tier facilities. Navigation robots like Globus Medical’s ExcelsiusGPS addressed spinal screw accuracy, fueling double-digit procedure growth in 2025.



By Application:
Neurosurgery Surges as Gynecology MaturesGynecological Surgery held 26.05% of the robotic-assisted surgery systems market share in 2025 after years of hysterectomy and myomectomy validation. However, Neurosurgery is forecast to post a 16.11% CAGR to 2031 as platforms combine stereotaxy with real-time imaging. The robotic assisted surgery systems market size for neurosurgical procedures is poised to expand as Medtronic’s Mazor X Stealth Edition gains cranial clearance and clinical data show 62% fewer lead-placement errors in epilepsy surgery.
Cardiovascular applications remain nascent, with robotic-assisted coronary bypass under 2% penetration due to anastomotic complexity. Orthopedics continues robust growth: Stryker’s Mako surpassed 1,400 installations worldwide in 2025, supported by registry evidence linking robotic planning to 92% patient satisfaction. Flexible single-port systems from Intuitive Surgical and Medicaroid unlock transoral and transvaginal routes, broadening use cases without expanding incision counts.
By End User:
ASCs Gain Momentum as Payers Shift OutpatientHospitals accounted for 45.62% share in 2025, leveraging scale economies and 24/7 staffing. Ambulatory Surgery Centers, though only 8% penetrated, are projected to grow at 16.43% CAGR as commercial insurers reward outpatient settings with 15%-20% reimbursement premiums. The robotic assisted surgery systems market size for ASC deployments is rising as vendors introduce leasing contracts pegged to a 150-case annual threshold, attainable for high-volume urology or gynecology centers.
Specialty clinics focus on orthopedics and ophthalmology, where concentrated case mixes shorten payback to under four years. Academic and research institutes remain early adopters, conducting beta trials for Johnson & Johnson’s Ottava at 12 sites in the United States and Europe ahead of an anticipated late-2026 clearance. These institutes feed a pipeline of surgeons who expect robotic infrastructure in future workplaces, reinforcing long-run demand.
Geography Analysis
North America Robotic Assisted Surgery Systems Market
North America commanded 43.54% share in 2025, sustained by dense installed bases and dedicated CPT codes that shield hospital margins. The United States alone had performed roughly 12 million cumulative da Vinci procedures by January 2026, demonstrating entrenched use. Canada diverted CAD 150 million (USD 110 million) in 2025 to deploy robots in 18 community hospitals, targeting reductions in oncology wait times. Mexico’s social security system installed 14 platforms in 2024 to curb complications from open surgery among diabetic patients.
APAC Robotic Assisted Surgery Systems Market
Asia-Pacific is forecast to grow at a 14.65% CAGR through 2031, driven by cost-competitive domestic makers. MicroPort’s Toumai, priced at CNY 8 million (USD 1.1 million), enabled penetration into Tier 2‒3 Chinese cities. Japan’s Medicaroid logged 85 hinotori installations by end-2025 after national insurance extended coverage to robotic gastric resection, pushing volumes up 34% year-on-year. India remains attractive, as CMR Surgical plans to place Versius in 12 hospitals by late 2025, tapping a self-pay market sensitive to upfront pricing. South Korea and Australia support adoption through subsidies and fast-track software approvals, respectively.
Europe, Middle East and South America Robotic Assisted Surgery Systems Market
Europe faces slower uptake under the Medical Device Regulation and mixed reimbursement. Germany’s statutory insurance covers robotic prostatectomy, but the U.K.’s National Health Service restricts use to complex cases after NICE’s 2024 cost-effectiveness ruling. Medtronic’s Hugo RAS secured 42 European installations by late 2025, targeting private hospitals in France and Italy where fee-for-service models finance innovation. In the Middle East, the United Arab Emirates equipped eight public hospitals with robots between 2024-2025, while Brazil’s pilot reimbursement in São Paulo performed 1,200 procedures in its first year.

Regulatory Landscape
Robotically assisted surgical equipment is regulated under risk-based frameworks that increasingly differentiate hardware from software-driven functions. In the United States, computer-assisted and robotically assisted surgical systems are regulated by the FDA (including product code SCV) and commonly follow 510(k) or De Novo pathways, with consensus standards such as IEC 80601-2-77 (2023) used to support safety and performance expectations. In 2024, the FDA introduced a three-tier autonomy framework, which has also shaped evidence expectations for higher-autonomy functions embedded into surgical robotics.
In Europe, the Medical Device Regulation (MDR) continues to drive longer approval timelines through expanded clinical evaluation and technical documentation requirements. The Medical Device Coordination Group (MDCG) updated Annex VIII classification interpretation with MDCG 2021-24 Rev. 1 in April 2026, increasing scrutiny for borderline classifications that can affect notified-body routes. In China, the National Medical Products Administration (NMPA) announced ten measures in July 2025 (Announcement No. 63) that prioritize high-end medical devices, explicitly including surgical robots, signaling expedited review intent alongside ongoing cybersecurity and local data-storage requirements that affect connected-software modules.
Value Chain Analysis
The value chain spans multi-tier component ecosystems through OEM integration and hospital deployment. Upstream suppliers provide precision-machined parts, specialty coatings, sensors, actuators, cameras/optics, and embedded electronics that feed into system-level assembly and software integration. Instrument manufacturing also relies on high-volume, high-tolerance processes and sterilization-ready materials. OEMs then validate systems clinically and through regulatory submissions, bundle navigation/imaging and analytics modules, and build service organizations for installation, uptime, and training, with distribution moving through direct sales and regional partners depending on geography and regulatory readiness.
Key constraints sit in qualification and capacity for high-precision instruments and sub-assemblies, where post-processing throughput has emerged as a shared bottleneck for robotic instruments and orthopedic-device production. Supply concentration is visible in manufacturing clusters, including high-end robotic joint component production in Germany's Tuttlingen region and broad mid-range subsystem capacity in China's Shenzhen and Suzhou corridors. This makes dual sourcing and long-term CDMO partnerships more important. Recent supplier-side order flow, such as NN, Inc. receiving purchase orders in July 2026 to manufacture components for a robotic-assisted surgery platform, also illustrates how scale-up demand propagates upstream as installed bases and procedure volumes expand.
Competitive Landscape
The robotic assisted surgery systems market remains moderately concentrated: Intuitive Surgical controls an estimated 60%-65% global installed base, buoyed by a consumables engine that generated USD 5.7 billion in instrument revenue during 2025. Fragmentation is accelerating as CMR Surgical’s USD 600 million Series D and 40% lower-priced Versius platform gain traction in mid-tier hospitals across India and Europe. Medtronic’s Hugo RAS, with open-architecture software and CE mark since 2021, reached 42 European installs by end-2025, focusing on urology and general surgery niches underserved by da Vinci.
Johnson & Johnson’s Ottava, now slated for late-2026 regulatory submission after delays, is running limited-market trials at 12 academic centers, leaving interim share to competitors. In spine, Globus Medical’s ExcelsiusGPS benefited from NuVasive’s navigation assets post-2024 acquisition and delivered double-digit procedure growth in 2025. Orthopedic robotics is dominated by Stryker’s Mako, which crossed 1,400 global installations and is expanding into ambulatory joint-replacement centers. Super-microsurgery represents an emerging micro-niche: Medical Microinstruments’ Symani earned CE mark in 2024 for lymphatic repair with sub-millimeter instruments.
Software differentiation is the next battleground. About 6% of devices cleared by the FDA in 2024 qualified for Level-3 conditional autonomy, and vendors are embedding AI for boundary detection, predictive maintenance, and remote proctoring to capture subscription margins. Europe’s MDR lengthens launch cycles by 12-18 months, favoring well-capitalized incumbents capable of funding additional trials and audits.
Robotic Assisted Surgery Systems Industry Leaders
Medtronic
Stryker Corporation
Zimmer Biomet
Intuitive Surgical
Johnson & Johnson (Ethicon/Auris)
- *Disclaimer: Major Players sorted in no particular order
Robotic Assisted Surgery Systems Market Companies Covered in this Report
- Asensus Surgical
- Brain Lab
- CMR Surgical
- Globus Medical
- Intuitive Surgical
- Johnson & Johnson (Ethicon/Auris)
- Medical Microinstruments (MMI)
- Medicaroid
- Medtronic
- Meere Company
- MicroPort MedBot
- Renishaw
- Siemens Healthineers (Corindus Vascular)
- Smiths Group
- Stryker
- Think Surgical
- Titan Medical
- Zimmer Biomet

Market Opportunities and Future Outlook
An opportunity area is the expansion of robotic platforms into higher-throughput soft-tissue segments and more cost-sensitive care settings through indication breadth, modularity, and footprint reduction. Medtronic received FDA clearance for Hugo RAS in urology in December 2025, and by June 2026, it had submitted additional 510(k) filings to expand into general and gynecologic specialties. This illustrates how expanding labeled use can open new procedure pools without changing core capital equipment. Table-mounted and handheld robotics platforms also create whitespace for sites constrained by operating room space and capital budgets, particularly where ambulatory surgery centers have limited robot penetration despite payer incentives.
Manufacturing and go-to-market restructuring is another near-term lever as vendors pursue closer control of supply and commercial execution. Intuitive Surgical expanded internal manufacturing capacity, including a Bulgaria 3D endoscope facility opened in July 2025 and construction activity at its Mexicali campus announced in April 2026, while also moving toward direct regional operations through its March 2026 acquisition of Southern European distribution businesses. On the supply side, capacity partnerships such as Microbot Medical's June 2026 strategic manufacturing agreement with Sanmina, while outside the core multi-port soft-tissue segment, signals broader momentum toward scaling robotics-related production with established electronics and manufacturing partners. Together, these moves support the industry's shift toward resilient, multi-region supply networks for robotics platforms and associated disposables.
Recent Industry Developments in Robotic Assisted Surgery Systems Market
- July 2026: Stryker announced the U.S. commercial launch of Mako RPS (Robotic Power System) for total knee replacement, extending the Mako portfolio into handheld robotics. The announcement broadens robotics adoption pathways for orthopedic programs that want robotic assistance without a full room-based platform change. It also strengthens Stryker's position in procedure-standardization workflows.
- June 2026: Medtronic submitted 510(k) filings to the U.S. FDA to expand the Hugo robotic-assisted surgery system into general and gynecologic specialties in the United States. This action aims at a larger soft-tissue procedure base and supports broader hospital utilization of existing installations. It also increases competitive pressure in categories where da Vinci has been entrenched.
- December 2025: Medtronic announced FDA clearance of the Hugo robotic-assisted surgery system for urologic surgical procedures in the United States. The clearance established a U.S. entry point for Hugo's soft-tissue roadmap. It also gave health systems another option for building multi-specialty minimally invasive surgery programs beyond single-vendor ecosystems.


Robotic Assisted Surgery Systems Market Report Scope and Research Methodology
Market Definition and Coverage
This market covers revenue generated from robotic-assisted surgery platforms and the related items required to perform procedures, as these systems are installed and used by hospitals and ambulatory surgical centers across major regions.
Scope exclusions: We exclude non-robotic minimally invasive tools, basic laparoscopic equipment, and stand-alone imaging systems that do not function as part of a robotic surgery setup.
Segments Covered in This Report
- By Product Type
- System
- Surgical Robot
- Navigation System
- Consumables & Accessories
- Software & Services
- System
- By Application
- Gynecological Surgery
- Cardiovascular Surgery
- Neurosurgery
- Orthopedic Surgery
- Laparoscopy / General Surgery
- Urology
- Thoracic Surgery
- Otolaryngology (ENT)
- Other Applications
- By End User
- Hospitals
- Ambulatory Surgery Centers
- Specialty Clinics
- Academic & Research Institutes
- Geography
- North America
- United States
- Canada
- Mexico
- Europe
- Germany
- United Kingdom
- France
- Italy
- Spain
- Rest of Europe
- Asia-Pacific
- China
- Japan
- India
- Australia
- South Korea
- Rest of Asia-Pacific
- Middle East & Africa
- GCC
- South Africa
- Rest of Middle East & Africa
- South America
- Brazil
- Argentina
- Rest of South America
- North America
Data Sources, Market Sizing, and Validation
Desk Research
Desk research was used to set the backbone for the model, so the market total stays anchored to procedure demand and published healthcare activity. We referenced public sources such as the FDA device databases and safety communications, the US Centers for Medicare and Medicaid Services (CMS) for procedure and reimbursement signals, and the OECD health statistics series for surgery and hospital capacity indicators.
To keep the regional story consistent, we also reviewed sources such as the World Health Organization (WHO), World Bank health expenditure datasets, and selected peer reviewed clinical journals that track robotic procedure adoption and outcomes in key specialties. Along with this, we used company filings and investor presentations to understand installed base discussion, upgrade cycles, and typical revenue streams across systems and recurring items. We also relied on paid subscriptions for company financials and intelligence, plus patent databases, to map product launches and technology direction. The sources listed here are illustrative only, and many other public documents and datasets were also used for data collection, cross-checking, and clarification.
Primary Interviews and Surveys
Primary work was used to pressure test the desk assumptions, and then to fill gaps that public data cannot answer cleanly, such as typical replacement cycles and how fast robotic utilization scales after installation. We spoke with a mix of hospital procurement stakeholders, surgeons and OR managers, and industry specialists across major geographies, which helped us align adoption rates, pricing direction, and service and accessory attach behavior to what is seen in real purchasing and usage patterns.
Distribution of primary research fieldwork respondents
| Company type | Respondent position | Region |
|---|---|---|
| Top tier: 37% | CXOs: 14% | APAC: 37% |
| Mid tier: 45% | Functional/Unit leaders: 30% | EMEA: 36% |
| Smaller Players: 18% | Managers: 56% | Americas: 27% |
Market-Sizing & Forecasting
For sizing, we used a top-down demand pool build that starts from procedure volumes and robotic suitability by major surgical areas, then adjusts for adoption and access limits by region. Once the procedure pool was set, we reconstructed value using a practical split across system placements, recurring consumables and accessories, plus software and services that scale with utilization.
To reduce drift from business reality, we corroborated results with selective bottom-up approximations, including sampled average selling prices for systems, typical utilization per installed unit, and channel checks on accessory and service attachment. Inputs that mattered most included installed base growth pace, replacement and upgrade timing, average robot utilization per week, service contract penetration, and the direction of system ASPs under competitive tendering. Where data was thin, especially for smaller countries, we used proxy indicators such as hospital infrastructure, surgical staffing, and health spend trends, and then adjusted outputs based on primary feedback.
For forecasting, scenario analysis was used so the model can reflect how procedure growth, capacity constraints, and training effects can shift adoption speed in different regions. We selected the final forecast path after checking that each scenario matched the range of expectations stated by interviewees on utilization ramp, pricing movement, and the timing of new clinical indications.
Data Validation & Update Cycle
We validated the model through multiple checks so the final number is not dependent on a single assumption. Outputs were compared with independent signals such as procedure growth rates, hospital capital spending direction, and the pace of new system installations discussed in public materials, and then reviewed again when large variances showed up.
Before sign-off, the work goes through a multi-step internal review where assumptions are rechecked, units and currency conversions are verified, and outliers are investigated until the logic is consistent across regions and years. If a major mismatch is found, the team re-contacts relevant experts to re-test the assumption and update the model. Reports are refreshed annually, and interim updates are made when material events occur, followed by a final pre-delivery pass so clients receive the most current view.
Mordor Intelligence's Robotic Assisted Surgery Systems Market Size Compared Against Other Published Estimates
Published market numbers for robotic-assisted surgery systems can vary a lot, even when they appear to measure the same revenue pool. Differences usually come from what is counted in the revenue pool, what year is treated as the anchor, and how pricing and utilization are assumed to move over the forecast window.
The table points to a spread that is largely explained by scope and build logic. Some estimates fold in broader surgical robotics themes or procedure value, while others stay closer to device revenue, and the gap grows when aggressive utilization ramps or pricing inflation are assumed without clear checks against hospital capacity and purchasing cycles.
Benchmark comparison
| Source | Market Size | Gaps in Research Methodology |
|---|---|---|
| Mordor Intelligence | USD 12.76 B (2026) | |
| Industry Publisher A | USD 14.80 B (2024) | Uses a wider surgical robotics framing and a different base year, which can pull in adjacent robotic platforms beyond core robotic-assisted surgery system revenue and inflate the near-term total. |
| Regional Consultancy B | USD 11.80 B (2025) | Likely reflects a tighter adoption case and earlier price normalization, and it may undercount recurring software, service, and accessory value that grows with installed base utilization. |
The main takeaway is that scope and the anchor year drive most of the distance between figures, and then pricing and utilization assumptions amplify it over time. In Mordor Intelligence's model, the total is tied to robotic-assisted surgery system revenue, and it is split across systems plus recurring consumables and accessories and software and services, which are then checked against procedure growth and capacity signals so the trajectory stays traceable and repeatable.


Key Questions Answered in the Report
What was the robotic assisted surgery systems market size in 2026?
It stood at USD 12.76 billion and is forecast to reach USD 23.86 billion by 2031.
Which product category is growing fastest?
Software & Services is projected to expand at a 15.65% CAGR through 2031 on rising demand for training simulators, AI navigation, and analytics.
Why are ambulatory surgery centers adopting robotics?
Commercial payers grant 15%-20% reimbursement premiums for robotic outpatient procedures, helping ASCs justify investment and fueling a 16.43% CAGR outlook.
Which region will see the quickest growth?
Asia-Pacific is expected to grow at 14.65% CAGR, driven by lower-priced domestic systems from companies such as MicroPort and Medicaroid.
Who holds the largest robotic assisted surgery systems market share?
Intuitive Surgical leads with about 60%-65% of the global installed base thanks to its long-established da Vinci platform.
Page last updated on:


 Your data is secure and never sold or shared.


