
Global Surgical Navigation Systems Market Size and Share
Market Overview
| Study Period | 2020 - 2031 |
|---|---|
| Market Size (2026) | USD 10.83 Billion |
| Market Size (2031) | USD 20.51 Billion |
| Growth Rate (2026 - 2031) | 13.62 % |
| Fastest Growing Market | Asia Pacific |
| Largest Market | North America |
| Market Concentration | High |
Major Players *Disclaimer: Major Players sorted in no particular order Image © Mordor Intelligence. Reuse requires attribution under CC BY 4.0. | |
Global Surgical Navigation Systems Market Analysis by Mordor Intelligence
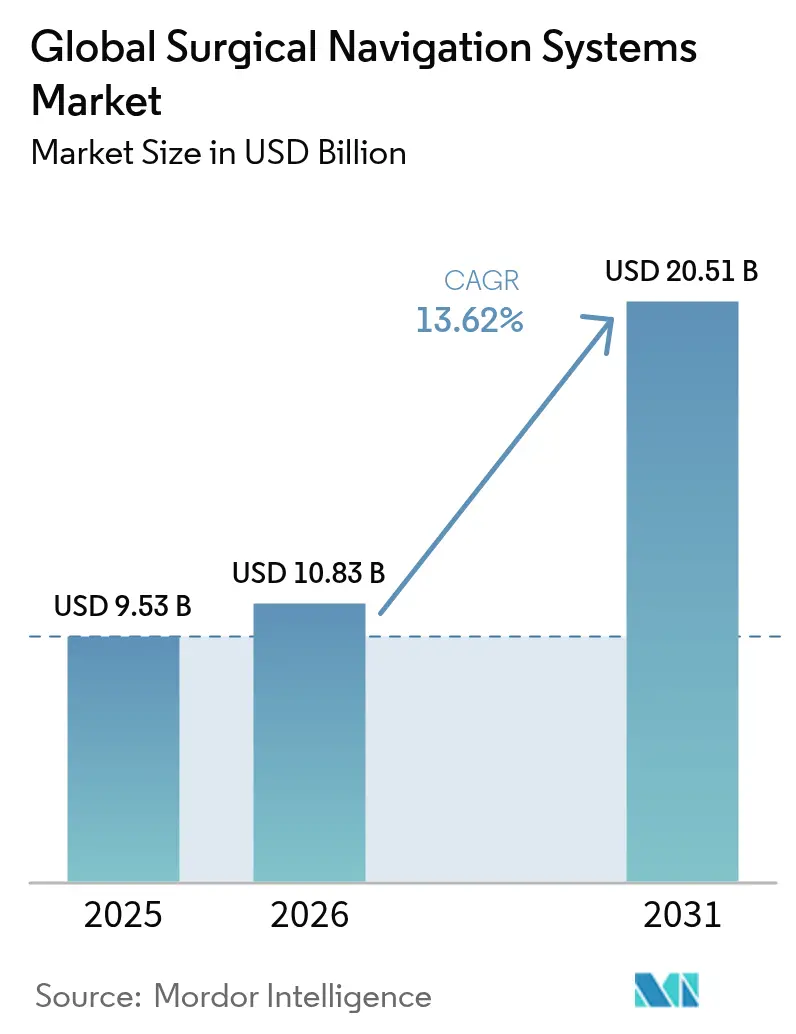
The surgical navigation systems market size is expected to grow from USD 9.53 billion in 2025 to USD 10.83 billion in 2026 and is forecast to reach USD 20.51 billion by 2031 at 13.62% CAGR over 2026-2031. The acceleration reflects widespread migration toward precision-guided, minimally invasive procedures that cut revision rates and shorten patient recovery timelines. Higher clinical complexity in spine, neurosurgery, and orthopedic cases pushes hospitals to invest in image-guided technologies, while AI-enabled planning tools shrink operative time and improve implant positioning accuracy. Broader reimbursement coverage and bundled-payment models reward providers that demonstrate outcome gains, further lifting adoption. Rapid infrastructure expansion across Asia Pacific creates fresh demand for connected platforms that slot into hybrid operating rooms. Vendors differentiate by fusing 3D imaging with machine-learning algorithms, but must also navigate cybersecurity rules and a shortage of trained technicians that could slow roll-outs.
Key Report Takeaways
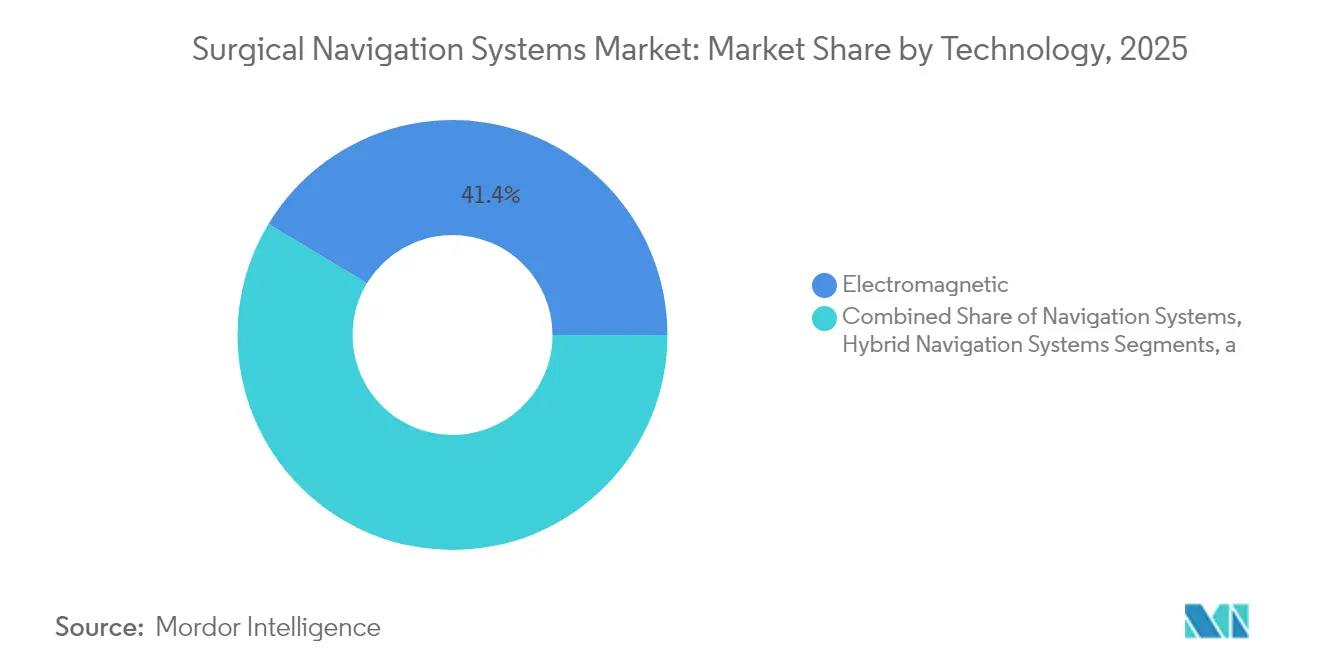
- By technology, electromagnetic systems led with 41.36% of the surgical navigation systems market share in 2025; optical systems posted the quickest 8.12% CAGR through 2031
- By application, neurosurgery accounted for 39.25% share of the surgical navigation systems market size in 2025, while ENT procedures expanded the fastest at 7.95% CAGR to 2031
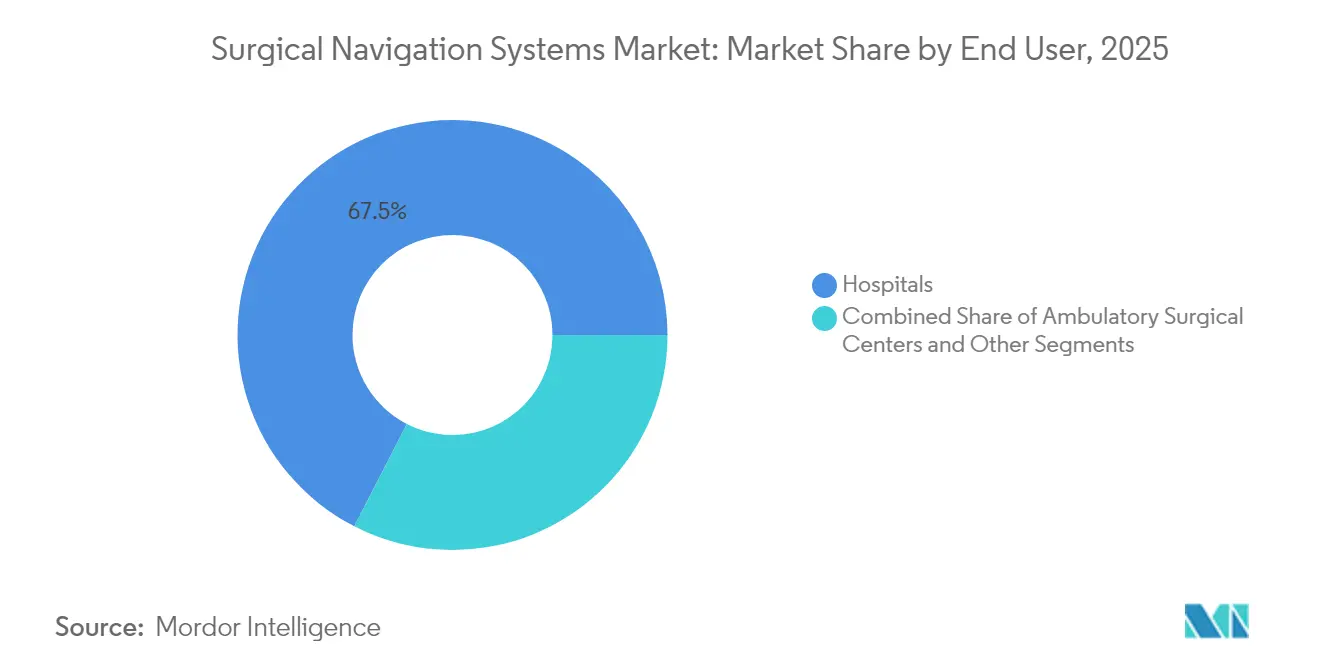
- By end user, hospitals & academic medical centers held 67.45% revenue share in 2025; ambulatory surgical centers recorded the highest 8.68% CAGR through 2031
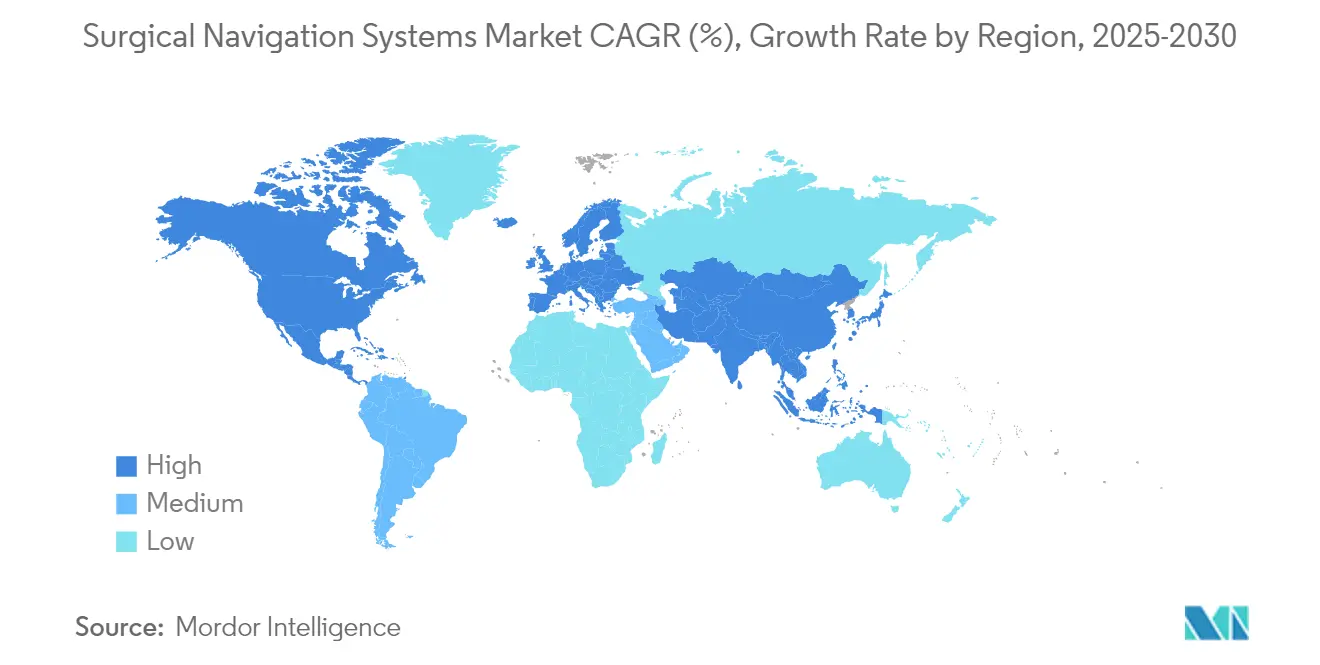
- By geography, North America dominated with a 37.85% share in 2025; Asia Pacific is the fastest-growing region at an 7.76% CAGR through 2031
Note: Market size and forecast figures in this report are generated using Mordor Intelligence’s proprietary estimation framework, updated with the latest available data and insights as of 2026.
Market Trends and Insights
Drivers Impact Analysis of Global Surgical Navigation Systems Market*
| Driver | (~) % Impact on CAGR Forecast | Geographic Relevance | Impact Timeline |
|---|---|---|---|
| Increasing Prevalence of Complex Surgical Cases | 3.20% | Global, with concentration in North America & Europe | Medium term (2-4 years) |
| Rising Adoption of Minimally Invasive and Robotic Procedures | 2.80% | North America & EU leading, APAC rapidly adopting | Short term (≤ 2 years) |
| Continuous Innovations In 3D Imaging and AI Algorithms | 2.10% | Global, with R&D centers in North America & Europe | Long term (≥ 4 years) |
| Broader Reimbursement and Funding for Advanced OR Technologies | 1.90% | North America & Europe primarily | Medium term (2-4 years) |
| Rapid Infrastructure Expansion in Emerging Healthcare Markets | 1.70% | APAC core, spill-over to MEA | Long term (≥ 4 years) |
| Integration Of Navigation Platforms with Hybrid Operating Rooms | 1.40% | Global, advanced healthcare systems | Medium term (2-4 years) |
| Source: Mordor Intelligence | |||
Increasing Prevalence of Complex Surgical Cases
Eighty-four percent of complex spinal deformity operations now rely on navigation to achieve grade A screw accuracy versus 50-80% under fluoroscopy, cutting revision-surgery costs that average USD 33,939 per case.[1]Silvia G. González, “Fluoroscopy Use in Minimally Invasive Spine Surgery,” mini-invasive-surgery.com Aging populations with multi-morbidity enlarge case volumes, so providers justify the capital outlay by linking precision guidance to lower complication rates and shorter stays. Demand therefore stays resilient even in budget-tight environments, bolstering the surgical navigation systems market. Vendors bolstered by long clinical track records further raise confidence among surgeons, accelerating refresh cycles in high-volume centers.
Rising Adoption of Minimally Invasive and Robotic Procedures
Robotic-assisted total knee arthroplasty already represents 13% of US volume, and navigation is integral for accurate bone resection and implant alignment. Surgeons typically achieve proficiency after only 12-17 robotic cases, lowering the learning-curve barrier. Outpatient facilities capture these procedures, backed by Medicare rates that favor ambulatory settings and yielded USD 28.7 billion in savings between 2011 and 2018.[3]Medicare Payment Advisory Commission, “Report to the Congress: Medicare and the Health Care Delivery System,” medpac.gov This migration sustains multi-year tailwinds for the surgical navigation systems market as precision tools become essential for safe minimally invasive approaches
Continuous Innovations in 3D Imaging and AI Algorithms
Machine-learning engines now classify tissue and track instruments in real time, trimming cognitive load on surgeons and boosting operative accuracy. FDA guidance published in 2025 clarifies expectations for AI-enabled devices, encouraging vendors to embed decision-support modules. Augmented-reality overlays cut intra-operative blood loss by 43% and lower complication rates by 24% during laparoscopic cases. These enhancements transform navigation from “map” to “co-pilot,” making adoption a strategic imperative across health systems and expanding the surgical navigation systems market.
Broader Reimbursement and Funding for Advanced OR Technologies
Dedicated CPT code +61783 supports computer-assisted spine procedures in the United States, while evolving value-based contracts reward technologies that reduce complications. European DRG systems still display tariff inconsistencies, yet bundled-payment pilots show hospitals can recoup investments through lower revision incidence. Vendors, therefore, position navigation as a cost-avoidance lever rather than a discretionary upgrade, sustaining momentum in capital-budget cycles.
Restraints Impact Analysis of Global Surgical Navigation Systems Market*
| Restraint | (~) % Impact on CAGR Forecast | Geographic Relevance | Impact Timeline |
|---|---|---|---|
| High Capital and Lifecycle Expenditure Requirements | -2.10% | Global, particularly emerging markets | Short term (≤ 2 years) |
| Prolonged Multiregional Regulatory Approval Processes | -1.80% | Global, with variations by region | Medium term (2-4 years) |
| Shortage Of Skilled Clinical and Technical Personnel | -1.50% | Global, acute in rural and emerging markets | Long term (≥ 4 years) |
| Escalating Cybersecurity and Data Privacy Concerns | -1.20% | Global, heightened in developed markets | Medium term (2-4 years) |
| Source: Mordor Intelligence | |||
High Capital and Lifecycle Expenditure Requirements
Acquiring an O-arm with navigation can cost USD 589,205 over four years, and 77% of spine surgeons cite price as the top barrier to adoption. Pay-per-procedure leases and manufacturer financing packages attempt to soften the blow, but smaller hospitals and emerging-market providers still struggle. Cost anxiety may cap first-time installs, though economic models prove positive returns in high-volume centers that avoid expensive revision surgeries. As vendors introduce modular upgrades, they aim to flatten spending curves and defend growth in the surgical navigation systems market.
Escalating Cybersecurity and Data-Privacy Concerns
FDA’s 2024 pre-market rule compels manufacturers to document threat-mitigation plans for any “cyber device”.[2]FDA, “Cybersecurity in Medical Devices: Quality System Considerations,” fda.gov Because navigation consoles interface with PACS and cloud dashboards, hospitals must reinforce network segmentation, endpoint protection, and incident response. These investments raise the total cost of ownership and may lengthen procurement cycles. High-profile ransomware attacks heighten board-level scrutiny, delaying some deployments despite the clinical upside, and creating a headwind for the surgical navigation systems market.
*Our forecasts treat driver/restraint impacts as directional, not additive. The impact forecasts reflect baseline growth, mix effects, and variable interactions.
Global Surgical Navigation Systems Market Segment Analysis
By Technology:
Electromagnetic Reliability Meets Optical MomentumElectromagnetic platforms held 41.36% of the surgical navigation systems market share in 2025 due to their proven performance in anatomy, where line-of-sight is obstructed. Hospitals appreciate their ability to track instruments through soft tissue without cumbersome reflectors. However, optical solutions are catching up; aided by faster cameras and AI-based markerless tracking, they chart an 8.12% CAGR. The segment’s ascent reveals that operating rooms value quicker set-up and lower drift errors in a crowded surgical field, nudging facilities toward dual-modality suites that can toggle between tracking modes.
Hybrid configurations combine coils and cameras within a unified cart, letting surgeons switch mid-procedure modalities. Fluoroscopy-based and CT-based navigation secure niche demand in trauma and complex spine but face radiation-exposure scrutiny. Emerging modalities such as augmented-reality headsets and MRI-adaptive electromagnetic probes sit in the “Others” bucket and promise step-change gains once price and regulatory paths mature. These innovations help sustain the long-run expansion of the surgical navigation systems market.



By Application:
Neurosurgery Leads, ENT Surges AheadNeurosurgery retained 39.25% of revenue share in 2025, with craniotomies and deep-brain stimulation heavily reliant on sub-millimeter guidance for tumor margins and electrode placement. Yet ENT procedures will climb fastest at 7.95% CAGR as endoscopic sinus and cochlear implant cases proliferate. Image-guided cochlear implantation reports mean operative time of 24.4 minutes with negligible tracking errors, uplifting surgeon confidence, and patient throughput. Orthopedic, trauma,a and spine surgeries also expand as robotic systems become routine in joint arthroplasty and deformity correction. Cardiac and thoracic teams employ navigation for minimally invasive valve repairs, while dental and maxillofacial specialists explore guided implant workflows. These broadening indications enlarge the surgical navigation systems market size and shift product-development roadmaps toward versatile, multi-specialty consoles.
By End User:
ASC Momentum Disrupts Hospital DominanceHospitals account for 67.45% of revenue owing to complex case mix and integrated imaging infrastructure. However, ambulatory surgical centers clock the swiftest 8.68% CAGR as knee, shoulder, and spine procedures move to outpatient suites, propelled by lower infection risk and faster discharge. ASCs saved Medicare USD 28.7 billion between 2011 and 2018 and may generate USD 73.4 billion more savings through 2028, underscoring payer support for migration. Consequently, vendors now offer smaller-footprint carts and subscription models tailored to ASC budgets, widening the addressable surgical navigation systems market. Specialty clinics round out demand by focusing on single-discipline excellence, often leveraging navigation to gain referral advantage in competitive urban corridors.
Geography Analysis
North America Surgical Navigation Systems Market
North America captures 37.85% of 2025 revenue, supported by strong reimbursement, widespread hybrid-OR buildouts and early uptake of AI modules. The United States leads regional growth, helped by CPT pathways that reimburse stereotactic navigation in spine and brain procedures, while Canada expands provincial funding for capital upgrades. Mexico’s cross-border device-supply agreements make high-end consoles more accessible to private hospitals. Nonetheless, saturation in metropolitan centers steers the North American surgical navigation systems market toward replacement rather than first-time purchases, nudging manufacturers to highlight workflow and cybersecurity upgrades rather than raw accuracy gains.
APAC Surgical Navigation Systems Market
Asia Pacific is the fastest-growing arena at an 7.76% CAGR through 2031. China prioritizes domestic neuro-robot programs, and National Medical Products Administration reforms have cut approval times for innovative platforms, encouraging local and foreign entrants alike. Japan and South Korea leverage robust electronics supply chains to accelerate OEM partnerships, while India’s burgeoning medical-tourism clusters demand cost-efficient yet advanced navigation consoles.
EMEA and LATAM Surgical Navigation Systems Market
Europe shows steady but variable uptake due to multi-layer reimbursement and CE-mark timelines. Germany and France adopt early owing to strong hospital budgets and surgeon lobbying, yet tariff ambiguities in DRG systems can delay procurement in Italy and Spain. Cross-border research consortia keep innovation vibrant, while the EU AI Act could harmonize digital-health standards, easing region-wide launches. Middle East & Africa’s spending spurt in GCC states and South Africa opens fresh lanes for vendors, whereas Latin America’s macro volatility tempers near-term installs outside Brazil’s private network. Over the forecast period these mixed drivers collectively reinforce the long-run expansion of the surgical navigation systems market.

Regulatory Landscape
Surgical navigation systems are regulated as medical devices across major markets, with software, connectivity, and imaging or robotics integration drawing heightened scrutiny. In the EU, the EU MDR 2017/745 framework governs clinical evaluation, postmarket surveillance, PMCF and PSUR obligations, and lifecycle governance for software-driven systems. The 2026 milestones cited include January 2026, when ClearPoint Neuro obtained EU MDR certification for ClearPoint Navigation Software v3.0.2, February 2026, when Synaptive Medical achieved EU MDR CE marking for Modus Nav, and April 2026, when Medtronic secured CE Mark for the Stealth AXiS navigation system, along with June 2026 CE Mark communications for ENT procedures.
In the US, FDA pathways for navigation devices typically rely on 510(k) clearances and, where necessary, De Novo submissions, with cybersecurity expectations for connected devices reinforced by 2024 guidance. Globally, IMDRF SaMD guidance continues to influence risk characterization and lifecycle governance for AI-enabled navigation platforms.
Competitive Landscape
The surgical navigation systems market displays moderate concentration. Medtronic, Stryker, and Brainlab leverage decades of clinical data, service networks, and adjunctive consumables to defend their share. Medtronic’s StealthStation has guided more than 3.5 million procedures globally; Stryker’s Mako installs top 1,500 units with over 1 million joint cases completed. Brainlab integrates cranial, spinal, and ENT workflows into a single software layer, boosting switching costs for hospitals.
M&A activity remains brisk. Zimmer Biomet bought OrthoGrid Systems in 2024 to fold AI fluoroscopic guidance into its HipIQ platform, and KARL STORZ acquired Asensus Surgical to add senhance robotics to its imaging stack. Start-ups such as Elucent Medical raised USD 42.5 million in 2024 for machine-learning localization probes, signaling investor appetite for niche innovation. Competitive edge increasingly hinges on embedded AI, AR overlays and secure cloud analytics. Firms that couple these with turnkey education programs can overcome the skills shortage and accelerate global penetration of the surgical navigation systems market.
Regulation also shapes rivalry. Stricter FDA pre-market cybersecurity rules favor incumbents with deep compliance teams, potentially crowding out under-capitalized entrants. On the flip side, open-architecture software and API-level partnerships let nimble players plug specialized modules into legacy consoles, fragmenting revenue flows. Consequently, alliances between imaging majors and navigation vendors—exemplified by Medtronic’s 2025 tie-up with Siemens Healthineers—are likely to proliferate, knitting together ecosystems that lock customers in for multi-year refresh cycles.
Global Surgical Navigation Systems Industry Leaders
Zimmer Biomet Holdings
B Braun Melsungen AG
Medtronic
Stryker
Siemens AG
- *Disclaimer: Major Players sorted in no particular order

Global Surgical Navigation Systems Market Companies Covered in this Report
- Medtronic
- Stryker
- Brain Lab
- Siemens Healthineers
- Zimmer Biomet
- B. Braun (Aesculap)
- KARL STORZ SE
- Fiagon GmbH
- DePuy Synthes (J&J)
- CAScination AG
- Intuitive Surgical
- Smiths Group
- Globus Medical
- GE Healthcare
- Royal Philips
- Accuray
- Surgalign Holdings
- Scopis GmbH (Stryker)
- Synaptive Medical
- Elvation Medical
Read Analysis of Global Surgical Navigation Systems Companies

Market Opportunities and Future Outlook
A key opportunity is reducing capital and workflow barriers so navigation can operate in ambulatory settings, including ASCs and high-throughput orthopedic sites. The June 2026 US FDA 510(k) clearance for Lantern ASC shows a pathway for portable, integration-friendly navigation that fits smaller footprints and supports faster turnover in outpatient orthopedic workflows. In parallel, the April 2026 FDA clearance for Pixee Medical Knee+ NexSight on an augmented reality platform for total knee arthroplasty reinforces momentum for AR-assisted planning in outpatient joints.
Recent Industry Developments in Global Surgical Navigation Systems Market
- June 2026: OrthAlign Lantern ASC received US FDA 510(k) clearance for Lantern ASC, a handheld orthopedic navigation solution designed for ASCs. This clearance supports a shift toward portable, turnover-friendly navigation in outpatient orthopedic workflows.
- May 2026: Zeta Surgical received US FDA 510(k) clearance for the Zeta Navigation System, along with the Zeta Stylet and Zeta Bolt, to expand point-of-care navigation options in neurosurgical procedures. The clearance highlights momentum behind computer vision and AI-enabled navigation focused on faster setup and broader access beyond traditional capital-intensive suites.
- April 2026: Medtronic announced CE Mark for the Stealth AXiS surgical navigation system, supporting European commercialization of an integrated planning, navigation, and robotics platform for spine and cranial procedures. The milestone strengthens Medtronic’s ability to standardize workflows across US and EU sites under EU MDR requirements and improves its competitive positioning in connected surgical ecosystems.


Global Surgical Navigation Systems Market Report Scope and Research Methodology
Market Definition and Coverage
This market covers systems that help surgeons navigate instruments in real time using tracking hardware and software, typically linked with imaging and planning tools. It includes equipment and related software used across major surgical specialties in hospital and ambulatory surgery settings.
Scope exclusions: Smartphone-only reference apps that do not track instruments in real time are not counted in this market.
Segments Covered in This Report
- By Technology
- Electromagnetic Navigation Systems
- Optical Navigation Systems
- Hybrid Systems
- Fluoroscopy-based Systems
- CT-based Systems
- Others
- By Application
- Neurosurgery
- Orthopedic & Trauma Surgery
- Spine Surgery
- ENT Surgery
- Cardiac & Thoracic Surgery
- Dental & Maxillofacial Surgery
- By End User
- Hospitals
- Ambulatory Surgical Centers (ASC)
- Others
- Geography
- North America
- United States
- Canada
- Mexico
- Europe
- Germany
- United Kingdom
- France
- Italy
- Spain
- Rest of Europe
- Asia Pacific
- China
- Japan
- India
- South Korea
- Australia
- Rest of Asia Pacific
- Middle East and Africa
- GCC
- South Africa
- Rest of Middle East and Africa
- South America
- Brazil
- Argentina
- Rest of South America
- North America
Data Sources, Market Sizing, and Validation
Desk Research
Desk research was used to build the starting structure of the model, so we could map how demand gets created and where revenue is actually booked. Public sources such as the US FDA device databases, the US Centers for Medicare and Medicaid Services, the OECD health statistics, and the World Bank health spending indicators were reviewed to anchor procedure settings, adoption signals, and care delivery trends.
We also referenced sources such as peer reviewed clinical journals on image guided surgery outcomes, national hospital and surgery association websites, and company annual reports and investor presentations to understand product positioning and selling patterns. Where available, paid subscriptions for company financials and intelligence, news and financials, and patent databases were used to support cross checks on product footprints and technology activity. These are illustrative examples, and many other public sources were also reviewed to collect data, validate assumptions, and clarify inconsistencies.
Primary Interviews and Surveys
Primary conversations were run with a mix of device makers, distributors, surgeons, operating room staff, and hospital procurement teams to confirm what is used in practice and what gets bundled in deals. Since demand is global, inputs were checked across major buying regions to validate adoption pace by procedure type, the role of service contracts, and typical replacement cycles before final numbers were locked.
Distribution of primary research fieldwork respondents
| Company type | Respondent position | Region |
|---|---|---|
| Top tier: 28% | CXOs: 16% | APAC: 47% |
| Mid tier: 50% | Functional/Unit leaders: 41% | EMEA: 29% |
| Smaller Players: 22% | Managers: 43% | Americas: 24% |
Market-Sizing & Forecasting
Sizing starts with a top-down demand pool build that links procedure volume growth to where navigation is clinically relevant and where buyers actually adopt it in financial terms, and then converts that pool into system and software revenue using practical usage and pricing assumptions. Because procedure counts alone can overstate demand, the model also applies penetration rates by surgical specialty and setting, followed by typical capital replacement timing and the share of sites that run integrated workflows.
To keep totals realistic, selective bottom-up approximations are used as cross checks, including sampled average selling price by system type, channel feedback on annual placements, and a sanity check of service and software attach rates. Key inputs used in the model include growth in orthopedic and neurosurgical case volumes, navigation utilization per specialty, installed base replacement cycles, service contract take rates, and average selling price progression by region, with currency timing reflected in the series. Where small-country data points are thin, gaps are handled with proxy indicators such as hospital infrastructure growth and imaging suite expansion, which are then tested during interviews.
For forecasting, scenario analysis is used with a base case reflecting expected adoption of minimally invasive and precision workflows, plus conservative and aggressive cases to reflect reimbursement shifts and hospital capital budget swings. Assumptions on penetration, pricing, and replacement are reviewed with experts, and the forecast is adjusted when interview consensus points to a different adoption pace than what the historical series suggests.
Data Validation & Update Cycle
Model outputs are validated using triangulation across procedure indicators, installed base signals, and revenue cues from public disclosures, and then compared against the implied system placement pace to catch over-counting. When an unexpected jump shows up, it is investigated through additional desk checks, and follow up calls are triggered to determine whether the change was driven by pricing, mix shift, or a one time tender.
Before release, the model goes through multiple analyst reviews so assumptions remain consistent across regions and years. The report is refreshed each year, and interim updates are made when material events occur, such as major regulatory changes or meaningful shifts in hospital spending patterns. Right before delivery, a final pass is completed so clients receive the most current view available.
Mordor Intelligence's Surgical Navigation Systems Market Size Measured Against Other Published Estimates
Published market values for surgical navigation systems can look far apart because different studies count different things under the same name, and they also choose different base years and growth windows. The largest shifts usually come from what is treated as part of the system sale versus adjacent tools, and how service, planning modules, and disposables are handled in the revenue line.
Some estimates expand scope by folding in nearby enabling technologies, or they assume faster average selling price increases without tying them back to installation patterns. The spread also widens when currency conversion timing differs, when a study reports an aggressive scenario as the main number, or when the update cadence does not re-check hospital capex sentiment and procedure recovery trends in the latest year. For that reason, inclusions around maintenance contracts and embedded planning modules are treated explicitly in the model used by Mordor Intelligence.
Benchmark comparison
| Source | Market Size | Gaps in Research Methodology |
|---|---|---|
| Mordor Intelligence | USD 10.83 B (2026) | |
| Global Consultancy A | USD 9.72 B (2025) | Uses a different base year and study window, and the public summary does not clearly state how service contracts, planning software, and consumables are counted within the market total. |
| Industry Publisher B | USD 8.38 B (2024) | Starts from a 2024 base and projects to 2030, which can shift totals when replacement timing and penetration are assumed earlier or later, and when inclusions around bundled software and support are not separated consistently. |
Across the three figures, most of the variance can be traced to base year choice, what is bundled into the revenue scope, and whether adoption assumptions are tied back to procedure and installed base signals. By keeping the inputs traceable to procedure relevance, penetration, replacement cycles, and attach rates, we get a number that can be re-created and sensibly adjusted when new evidence shows up.


Key Questions Answered in the Report
What is the current value of the surgical navigation systems market?
The market is worth USD 10.83 billion in 2026 and is projected to reach USD 20.51 billion by 2031 at a 13.62% CAGR over 2026-2031.
Which technology segment leads the market today?
Electromagnetic tracking dominates with 41.36% revenue share, prized for reliability in obstructed surgical fields.
Why are ambulatory surgical centers investing in navigation platforms?
ASCs benefit from lower infection risk, shorter stays and Medicare payments that drive procedures away from hospitals, so navigation tools help them perform complex cases safely while saving payers billions of dollars in costs.
What is the biggest barrier to adoption in emerging markets?
High capital and lifecycle expenses remain the primary hurdle, though manufacturers now offer pay-per-procedure and leasing models to ease the upfront burden.
How are AI and augmented reality changing surgical navigation?
Machine-learning algorithms automate tissue recognition and instrument tracking, while AR overlays improve visualization, together reducing operative time and complication rates.
Page last updated on:





