
Market Overview
| Study Period | 2020 - 2031 |
|---|---|
| Market Size (2026) | USD 38.9 Billion |
| Market Size (2031) | USD 53.33 Billion |
| Growth Rate (2026 - 2031) | 6.52 % |
| Fastest Growing Market | Asia Pacific |
| Largest Market | North America |
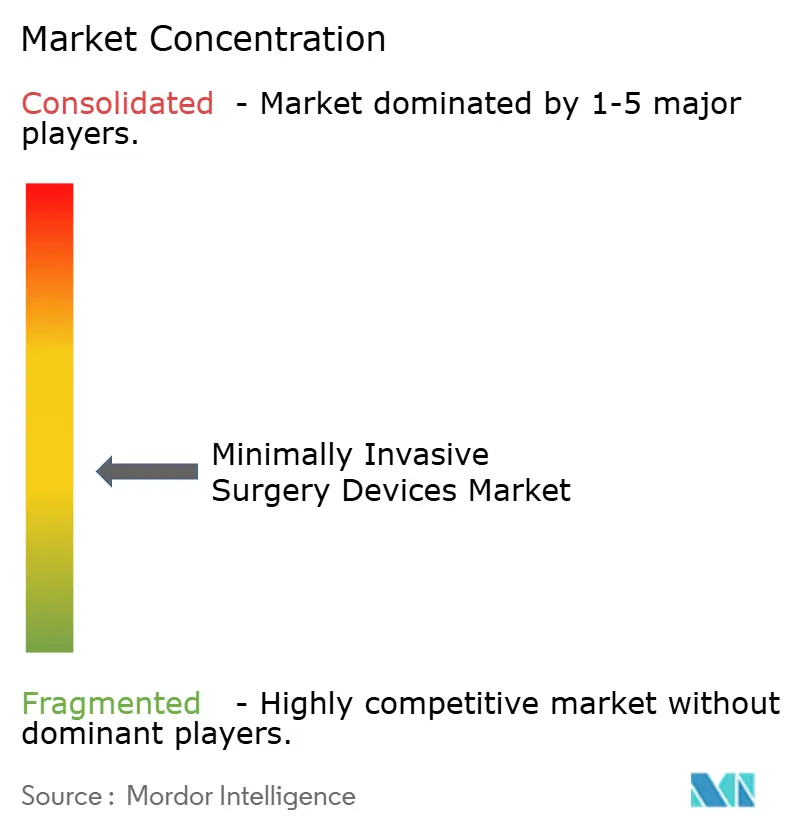
| Market Concentration | Medium |
Major Players *Disclaimer: Major Players sorted in no particular order Image © Mordor Intelligence. Reuse requires attribution under CC BY 4.0. | |
Minimally Invasive Surgery Devices Market Analysis by Mordor Intelligence
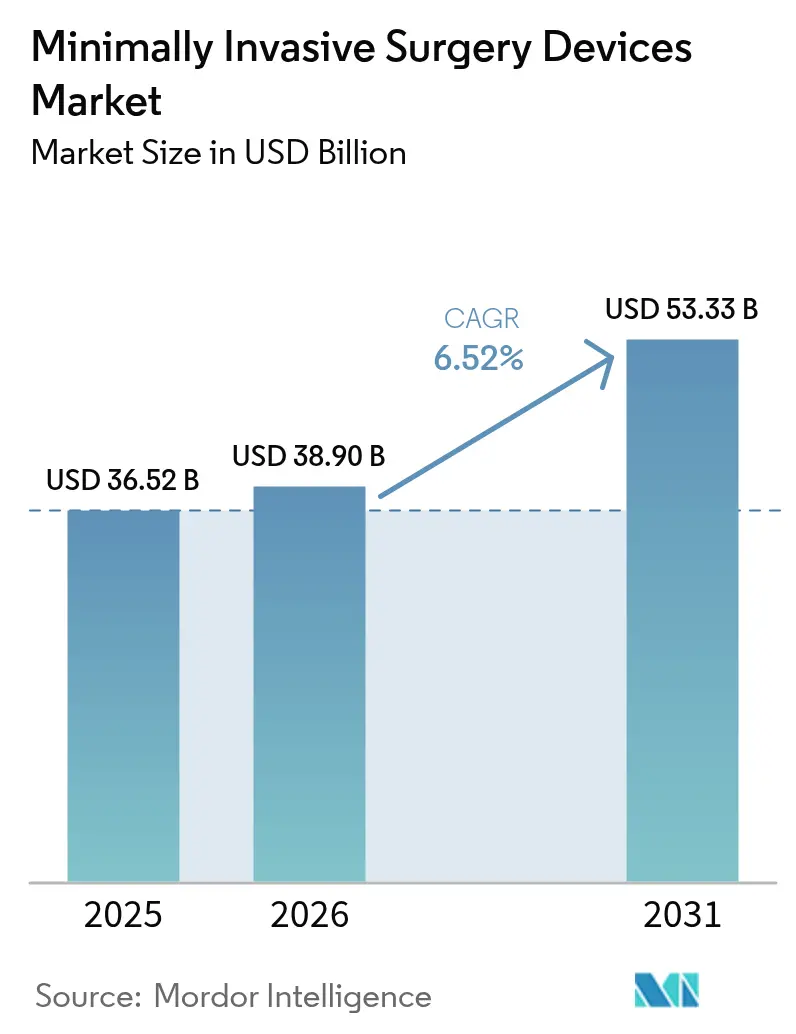
The Minimally Invasive Surgery Devices Market size is expected to grow from USD 36.52 billion in 2025 to USD 38.9 billion in 2026 and is forecast to reach USD 53.33 billion by 2031 at 6.52% CAGR over 2026-2031.
Robust demand reflects the continuing shift away from traditional open surgery toward precision-guided treatments that shorten recovery times and lower complication rates. Accelerating adoption of robotic platforms, stronger reimbursement support for outpatient interventions, and rapid technology convergence around artificial intelligence are pivotal forces shaping this growth. Handheld instruments continue to serve as the procedural workhorse, yet robotic systems are scaling quickly as hospitals seek workflow efficiencies and differentiation. Emerging single-port systems, AI-assisted visualization suites, and pulsed-field ablation devices illustrate how continual innovation is widening clinical possibilities while expanding addressable patient pools. As payors reward surgical settings that reduce inpatient days, ambulatory centers gain momentum, further enlarging the minimally invasive surgery devices market.
Key Report Takeaways
- By product type, handheld instruments led with 37.65% of minimally invasive surgery devices market share in 2025, while robotic-assisted systems are projected to post the fastest 9.12% CAGR through 2031.
- By application, orthopedic procedures commanded 24.55% share of the minimally invasive surgery devices market size in 2025, and neurological applications are forecast to expand at a 7.62% CAGR through 2031.
- By end user, hospitals accounted for 53.80% share of the minimally invasive surgery devices market size in 2025, whereas ambulatory surgical centers are on track for a 8.73% CAGR to 2031.
- By geography, North America held 42.00% of minimally invasive surgery devices market share in 2025, and Asia Pacific represents the fastest-growing region at a 9.98% CAGR up to 2031.
Note: Market size and forecast figures in this report are generated using Mordor Intelligence’s proprietary estimation framework, updated with the latest available data and insights as of 2026.
Market Trends and Insights
Drivers Impact Analysis of Minimally Invasive Surgery Devices Market*
| Driver | (~) % Impact on CAGR Forecast | Geographic Relevance | Impact Timeline |
|---|---|---|---|
| Higher acceptance of MIS over open surgery | +1.8% | Global | Medium term (2-4 years) |
| Rising prevalence of chronic & lifestyle diseases | +1.5% | Global, developed markets | Long term (≥ 4 years) |
| Rapid adoption of robotic-assisted platforms | +2.1% | North America & Europe, expanding to APAC | Short term (≤ 2 years) |
| Reimbursement tweaks favoring outpatient MIS | +1.2% | North America & EU | Medium term (2-4 years) |
| AI-guided visualization improving surgical accuracy | +0.8% | North America & Europe | Long term (≥ 4 years) |
| Demand for single-port & natural-orifice MIS | +0.7% | Global, early adoption in developed markets | Medium term (2-4 years) |
| Source: Mordor Intelligence | |||
Higher Acceptance of MIS Over Open Surgery
Growing patient advocacy for less traumatic care, hospital mandates that prioritize MIS-first protocols, and payor incentives are accelerating adoption. Boston Scientific’s FARAPULSE pulsed-field ablation system surpassed USD 1 billion in revenue within 12 months of launch, underscoring appetite for technologies that reduce procedural complexity while preserving outcomes.[1]Boston Scientific, “FARAPULSE Pulsed Field Ablation System Surpasses USD 1 Billion,” bostonscientific.com The shift is most pronounced in cardiac rhythm management, where pulsed-field energy offers selective tissue targeting and lower complication rates than thermal modalities. Institutions are seeing bed-utilization efficiencies and readmission reductions that further solidify MIS preference. Insurers now routinely provide favorable coverage terms for minimally invasive interventions, aligning economic and clinical rationales. As training curricula reposition MIS competencies as core skills, the minimally invasive surgery devices market gains a durable foundation for long-term growth.
Rising Prevalence of Chronic & Lifestyle Diseases
Global incidence of diabetes, cardiovascular disorders, and obesity is elevating surgical volumes suitable for less invasive solutions. Abbott’s FDA-approved Tendyne transcatheter mitral valve replacement treats patients unfit for open surgery, opening a sizeable niche in structural heart interventions.[2]Abbott Laboratories, “Tendyne Transcatheter Mitral Valve Replacement Cleared by FDA,” abbott.com Atrial fibrillation affects 33.5 million people worldwide, creating sustained demand for catheter-based ablation systems that offer definitive therapy without sternotomy. Single-port bariatric techniques are expanding eligibility for weight-loss surgery by lowering postoperative pain and improving recovery times. As healthcare systems pivot from reactive to preventive care, minimally invasive devices are positioned as cost-effective tools that curb chronic disease burdens. The resulting procedural growth underpins incremental gains in the minimally invasive surgery devices market.
Rapid Adoption of Robotic-Assisted Platforms
Robotics are diffusing beyond laparoscopic mainstays into orthopedics, neurology, and spine. Zimmer Biomet’s ROSA Shoulder System completed the first robotic-assisted shoulder arthroplasty in 2024, illustrating the technology’s widening reach.[3]Zimmer Biomet, “First Robotic-Assisted Shoulder Arthroplasty Using ROSA,” zimmerbiomet.com Artificial intelligence layers predictive analytics onto robotic controls, shortening learning curves and standardizing outcomes. Karl Storz’s 2024 purchase of Asensus Surgical highlighted strong strategic interest in next-generation platforms. Single-port architectures offer smaller incisions while preserving dexterity, amplifying patient appeal. Institutions justify capital outlays through surgeon retention, fewer complications, and higher patient satisfaction scores, accelerating momentum for the minimally invasive surgery devices market.
AI-Guided Visualization Improving Surgical Accuracy
Machine-learning algorithms now overlay imagery with anatomy-aware guidance, boosting accuracy in implant placement, tumor margins, and vascular navigation. Zimmer Biomet’s 2024 acquisition of OrthoGrid embeds AI within intraoperative imaging, trimming hip-replacement revision rates and lengthening implant lifespan. Computer vision integrated into endoscopes automates lesion detection, aiding early diagnosis. Cloud-based analytics produce continuous software upgrades that create recurring revenue streams. Simulation platforms use AI feedback to accelerate trainee proficiency, thereby easing surgeon shortages. This convergence of AI and visualization capabilities is a powerful catalyst for the minimally invasive surgery devices market.
Restraints Impact Analysis of Minimally Invasive Surgery Devices Market*
| Restraint | (~) % Impact on CAGR Forecast | Geographic Relevance | Impact Timeline |
|---|---|---|---|
| Shortage of skilled MIS surgeons | -1.4% | Global, acute in emerging markets | Long term (≥ 4 years) |
| Capital-intensive robotic systems | -0.9% | Emerging markets, smaller health systems | Medium term (2-4 years) |
| Supply-chain fragility for key disposables | -0.6% | Global | Short term (≤ 2 years) |
| Cyber-security risks in connected OR suites | -0.3% | Developed markets | Medium term (2-4 years) |
| Source: Mordor Intelligence | |||
Shortage of Skilled MIS Surgeons
Advanced robotic and single-port techniques require 50–100 supervised cases for proficiency, a hurdle that slows adoption even where hardware is available. Emerging markets experience pronounced shortages as surgeon migration toward higher-income regions erodes local capacity. Simulation programs, remote mentoring, and augmented reality guidance mitigate but do not eliminate skills gaps. Policy initiatives that fund fellowship programs are expanding, yet the time lag to produce fully trained specialists remains a structural brake on the minimally invasive surgery devices market.
Capital-Intensive Robotic Systems
Initial purchase prices, annual service contracts, and disposable instrument costs often exceed USD 2 million over a system’s first five years. Smaller hospitals and ambulatory centers weigh these costs against uncertain procedure volumes and reimbursement ceilings. Cybersecurity protections add extra expense; ransomware has disrupted elective surgery schedules and forced costly downtime. Leasing models and outcome-based financing are emerging, yet many providers remain cautious, dampening penetration rates for high-end robotic suites within the minimally invasive surgery devices industry.
*Our forecasts treat driver/restraint impacts as directional, not additive. The impact forecasts reflect baseline growth, mix effects, and variable interactions.
Minimally Invasive Surgery Devices Market Segment Analysis
By Product Type:
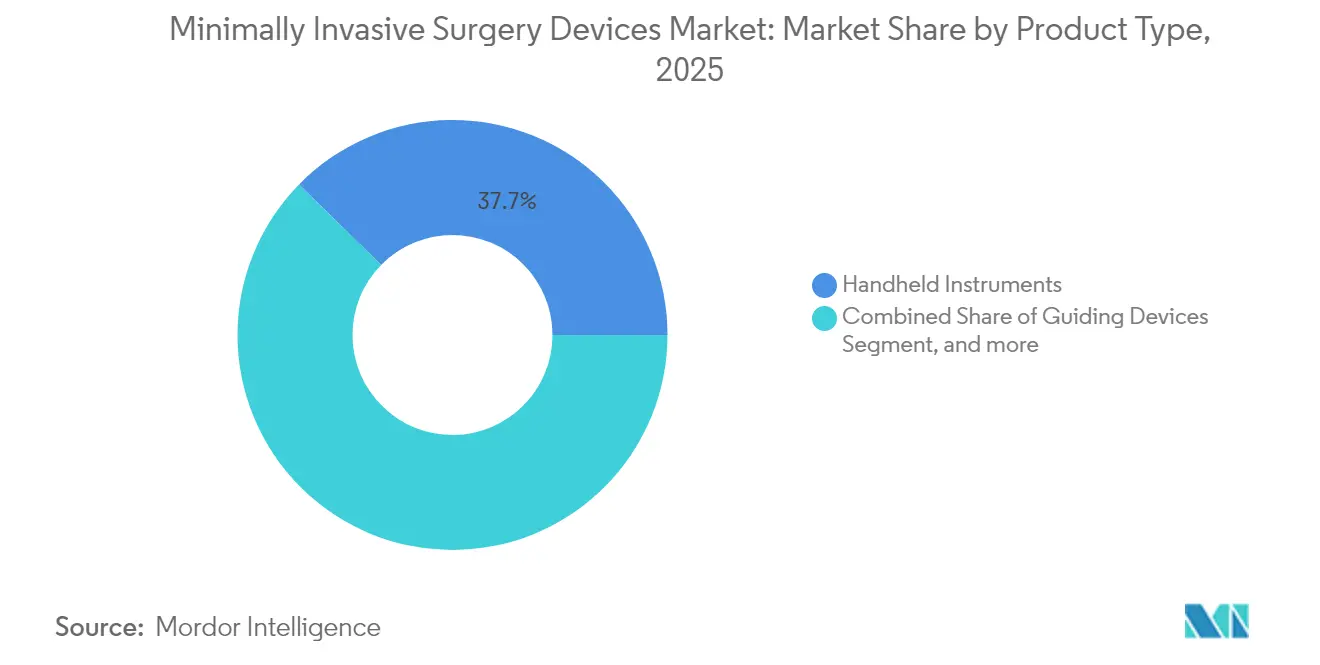
Robotics Surge Challenges Handheld DominanceHandheld instruments continued to command the largest portion of the minimally invasive surgery devices market size, generating 37.65% of revenue in 2025. Their ubiquity across laparoscopy, endoscopy, and catheter-based procedures ensures resilience even as new modalities arise. Conversely, robotic-assisted systems, though smaller in absolute value, are forecast to post a 9.12% CAGR, the swiftest in the category, as hospitals leverage their precision and ergonomic benefits to tackle complex surgeries. Guiding devices such as catheters and guidewires remain indispensable, providing steady incremental growth. Electrosurgical platforms are migrating to advanced energy sources that seal vessels more reliably, and ablation devices are shifting toward pulsed-field technologies that minimize collateral tissue damage.
Market entrants are funneling investment into single-port robotics, positioning these systems to erode dependence on multi-port configurations favored by handheld tools. AI-linked 4K and 8K visualization upgrades rejuvenate legacy laparoscopes, extending their lifespan while elevating diagnostic accuracy. Ablative lasers are finding traction in precise tissue removal for ENT and gynecologic procedures, expanding the addressable space of the minimally invasive surgery devices market. As technology cycles quicken, the product mix will continue to tilt toward software-enhanced hardware, yet core mechanical instruments will preserve relevance through affordability and familiarity.



By Application:
Neurological Procedures Accelerate Beyond Orthopedic LeadershipOrthopedic surgery has long epitomized MIS maturity, retaining a 24.55% share of the minimally invasive surgery devices market size in 2025 on the strength of knee, hip, and spine adaptations. High reimbursement certainty and abundant clinical evidence sustain utilization. Neurological procedures, however, are on pace for a 7.62% CAGR as AI-guided navigation enables safe tumor resections and robotic catheters traverse tortuous cerebral vasculature with millimeter accuracy. Cardiovascular interventions extend transcatheter techniques into structural heart disease, while gastrointestinal endoscopy integrates AI polyp detection to elevate adenoma-detection rates.
Cross-fertilization among specialties is rising. Robotic arms initially conceived for prostatectomy now support transforaminal lumbar fusion, indicating convergent device design. Aesthetic and bariatric segments, once peripheral, exploit single-port laparoscopy to reduce scarring and accelerate ambulation, thereby broadening the revenue horizon within the minimally invasive surgery devices market. Continued diversification of clinical indications is expected to balance growth between legacy orthopedic volumes and emerging neurological demand.
By End User:
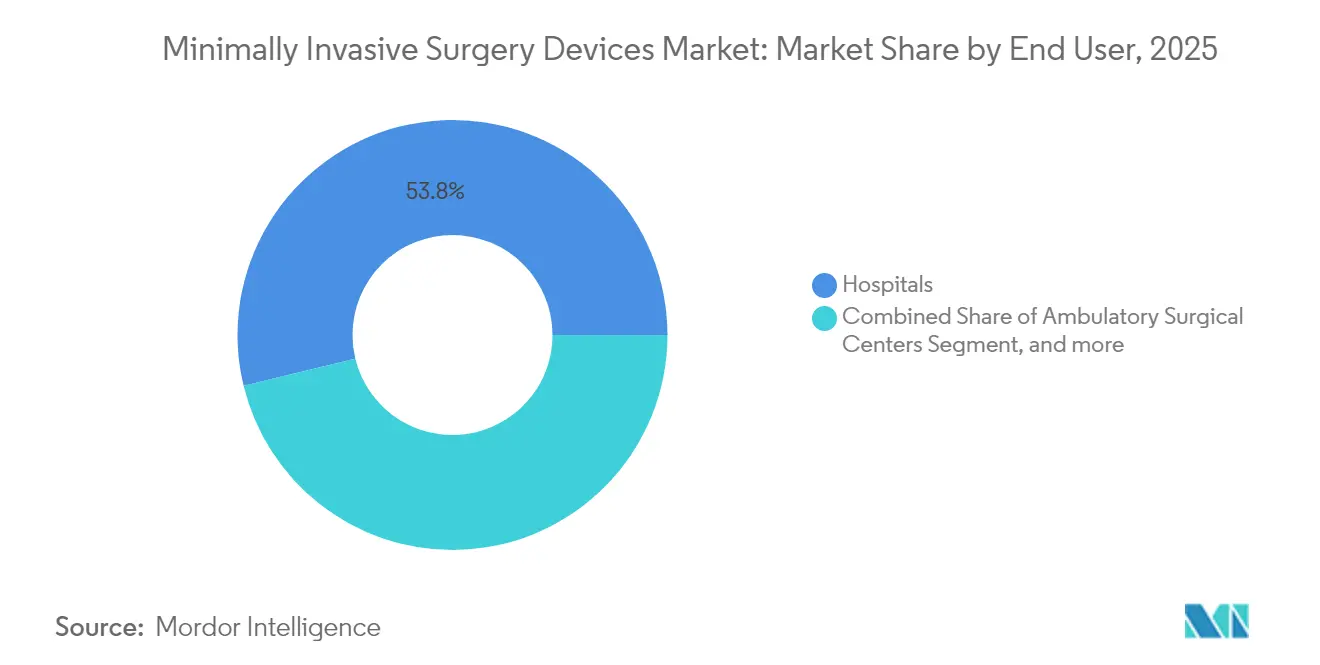
ASCs Challenge Hospital DominanceHospitals delivered 53.80% of global revenue in 2025 through comprehensive service offerings and procedural breadth. Their integrated intensive-care capabilities remain essential for high-risk patients, ensuring hospitals’ central role in the minimally invasive surgery devices market. Nonetheless, ambulatory surgical centers are tracking a 8.73% CAGR, benefitting from shorter scheduling queues, lower facility fees, and expanding payor approval for outpatient versions of formerly inpatient procedures. Specialty clinics are carving out niches in ophthalmology, ENT, and pain management where focused volume yields superior efficiencies.
Anesthetic advances that facilitate same-day discharge augment ASC competitiveness. Vendors such as Zimmer Biomet now customize capital-equipment packages for ambulatory settings, bundling robotic rental models, disposables, and staff training to lower adoption thresholds. Hospitals counter with satellite outpatient wings, blending ASC convenience with immediate escalation capabilities. Regulatory shifts, including CMS expansions of outpatient-eligible procedure codes, continue to tilt volume toward decentralized sites, redefining channel strategy for manufacturers within the minimally invasive surgery devices market.
Geography Analysis
North America Minimally Invasive Surgery Devices Market
North America maintained 42.00% of global revenue in 2025, underpinned by robust reimbursement, advanced training pipelines, and rapid regulatory pathways that shorten time-to-market for breakthrough devices. Consolidating health systems negotiate enterprise-wide procurement contracts, granting leading suppliers scalable access across multistate hospital networks. The aging demographic and high chronic-disease prevalence underpin steady procedural expansion, while academic centers pioneer novel techniques that diffuse into community settings.
APAC Minimally Invasive Surgery Devices Market
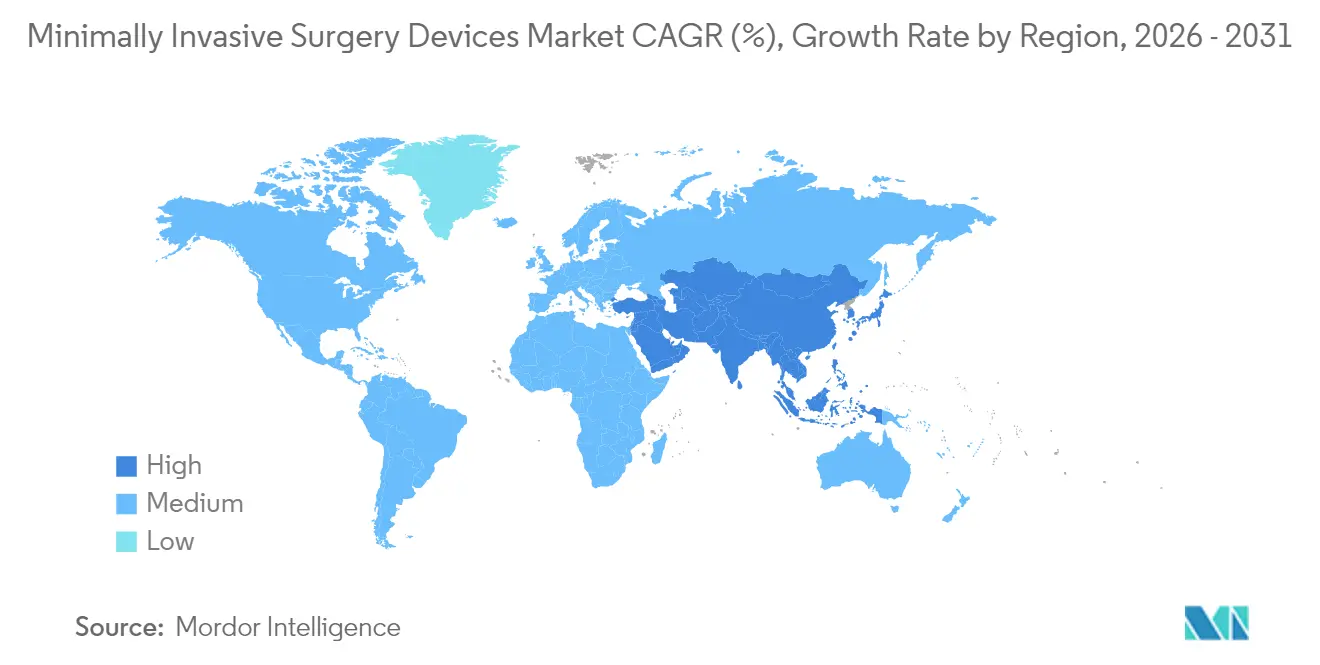
Asia Pacific represents the fastest-growing territory, advancing at a 9.98% CAGR through 2031, fueled by capacity additions, rising middle-class incomes, and government promotion of medical tourism. China fosters domestic innovation while partnering with global device firms to spur technology transfer. India’s cost-sensitive market turns to value-engineered platforms, often refurbishing Western systems to meet price points. Japan deploys premium robotic solutions to address surgeon shortages and accommodate an aging populace. Korea leverages state-of-the-art hospitals to attract international patients seeking aesthetic and spinal procedures.
EMEA and LATAM Minimally Invasive Surgery Devices Market
Europe’s stringent MDR framework fosters high product quality but lengthens approval cycles, requiring robust clinical dossiers. Germany remains a manufacturing stronghold, and the United Kingdom’s NHS provides large-scale data sets that facilitate evidence generation. Middle East and Africa, though nascent, are investing in flagship tertiary centers, particularly in GCC nations that seek to reduce outbound medical travel. Latin America shows uneven adoption; Brazil’s public–private mix sustains progress despite macroeconomic volatility. Collectively, regional heterogeneity compels suppliers to adopt nuanced entry strategies that safeguard compliance while scaling the minimally invasive surgery devices market.

Competitive Landscape
The market is moderately fragmented with leading multinationals deploy scale to fund R&D, pursue acquisitions, and negotiate group purchasing contracts. Intuitive Surgical pioneers multi-port robotics, but challengers including Medtronic, Zimmer Biomet, and Johnson & Johnson are fielding rival platforms, intensifying price and feature competition. Cybersecurity now ranks alongside precision as a differentiator, with hospital CIOs demanding encrypted data pipelines and zero-trust architectures for connected OR suites.
AI software add-ons are creating sticky ecosystems that lock customers into vendor-specific disposables and analytics subscriptions, driving recurring revenue beyond the initial capital sale. Smaller firms carve out niches through single-use endoscopes, pulsed-field generators, and chip-on-tip camera modules, often exiting via trade-sale to larger strategics eager to plug portfolio gaps. Strategic collaborations with cloud providers accelerate algorithm deployment, while contract manufacturers in Asia enable cost-optimization. Heightened due diligence follows supply-chain shocks, prompting component diversification to safeguard production. The net result is a race to integrate robotics, visualization, and data analytics into unified platforms that extend the minimally invasive surgery devices market footprint.
Minimally Invasive Surgery Devices Industry Leaders
Olympus Corporation
Stryker Corporation
HOYA Corporation
Medtronic
Boston Scientific Corporation
- *Disclaimer: Major Players sorted in no particular order
Minimally Invasive Surgery Devices Market Companies Covered in this Report
- Abbott Laboratories
- Boston Scientific
- Intuitive Surgical
- Medtronic
- Johnson & Johnson
- Stryker
- Olympus
- Koninklijke Philips
- Zimmer Biomet
- HOYA
- Conmed
- Renishaw plc
- Smiths Group
- B. Braun
- Karl Storz
- Arthrex
- Teleflex
- Cook Group
- Becton Dickinson & Co.
- GE Healthcare Technologies Inc.
Read Analysis of Minimally Invasive Surgery Devices Companies

Market Opportunities and Future Outlook
A key whitespace is building more integrated, modular operating-room systems that connect preoperative planning, intraoperative navigation, and robotic execution across multiple specialties, instead of limiting adoption to single-procedure platforms. Medtronic's Stealth AXiS clearances in the United States in 2026 (spine, then cranial and ENT) and its April 2026 CE Mark also indicate how vendors are extending unified navigation-plus-robotics architectures into broader clinical workflows. That direction can drive demand for compatible instruments, visualization tools, and software upgrades.
Energy innovation and portfolio expansion also create additional headroom in high-volume catheter-based interventions and core endoscopy and urology toolchains. In 2026, Johnson & Johnson secured FDA approval for a Dual Energy THERMOCOOL SMARTTOUCH SF platform that combines radiofrequency and pulsed field energy in one catheter, reinforcing the push toward pulsed-field capabilities that aim to reduce collateral tissue effects in ablation. On procedural access, FDA 510(k) clearances such as Karl Storz trocars with valve seals (2026) and Olympus cystoscopy and energy sealing updates support replacement cycles and standardization for hospitals and ambulatory surgical centers. M&A activity, including Olympus acquiring BioProtect, further broadens minimally invasive treatment pathways by adding adjacent urology and oncology technologies.
Recent Industry Developments in Minimally Invasive Surgery Devices Market
- June 2026: Medtronic completed its acquisition of Scientia Vascular for USD 550 million, adding neurovascular access and therapeutic technologies. The deal strengthens Medtronic's position in minimally invasive neurovascular procedures and supports portfolio bundling across access, navigation, and treatment in stroke and related care pathways.
- May 2026: Boston Scientific announced a USD 1.5 billion strategic investment in MiRus LLC for an approximately 34% equity stake, with options tied to MiRus TAVR system assets. The investment increases Boston Scientific's exposure to structural heart interventions and complements its broader minimally invasive cardiovascular franchise.
- July 2025: Teleflex completed the acquisition of BIOTRONIK's Vascular Intervention business for EUR 760 million (about USD 825 million). The acquisition broadened Teleflex's interventional portfolio in peripheral interventions with added catheter and stent offerings, improving its ability to compete in procedure-driven hospital accounts.


Minimally Invasive Surgery Devices Market Report Scope and Research Methodology
Market Definition and Coverage
For this study, the market includes devices and systems used to perform minimally invasive surgical procedures, where access is through small incisions and surgeons rely on imaging, energy, and specialized instruments to complete the operation.
Scope exclusions: We exclude routine surgical consumables and general hospital supplies that are not specific to minimally invasive approaches.
Segments Covered in This Report
- By Product Type
- Handheld Instruments
- Guiding Devices
- Guiding Catheters
- Guidewires
- Electrosurgical Devices
- Endoscopic Devices
- Laparoscopic Devices
- Monitoring & Visualization Devices
- Ablation Devices
- Laser-based Devices
- Robotic-assisted Surgical Systems
- Other MIS Devices
- By Application
- Aesthetic
- Cardiovascular
- Gastrointestinal
- Gynecological
- Orthopedic
- Urological
- Neurological
- Other Applications
- By End User
- Hospitals
- Ambulatory Surgical Centers
- Specialty Clinics
- By Geography
- North America
- United States
- Canada
- Mexico
- Europe
- Germany
- United Kingdom
- France
- Italy
- Spain
- Rest of Europe
- Asia Pacific
- China
- Japan
- India
- Australia
- South Korea
- Rest of Asia-Pacific
- Middle East & Africa
- GCC
- South Africa
- Rest of Middle East & Africa
- South America
- Brazil
- Argentina
- Rest of South America
- North America
Data Sources, Market Sizing, and Validation
Desk Research
Desk research set the base layer for the model, mainly by mapping procedure volumes, care pathways, and adoption of minimally invasive techniques across regions. We typically start with public health and utilization statistics, then match those signals to device categories used in those procedures.
Sources used include the World Health Organization for system indicators, the OECD for health spending and activity series, the US FDA device database for approvals and safety communications, the European Commission and national health ministries for regulatory and hospital data, and peer-reviewed clinical journals for procedure trends and technology shifts. We also reviewed company annual reports, investor presentations, association publications, and reputable medical press coverage, and we supplemented this with paid subscriptions for company financials and intelligence, news and financials, and patent databases to support product and pipeline context. These examples are not exhaustive, and many other public sources were also used for data collection, validation, and research clarification.
Primary Interviews and Surveys
Primary work was used to pressure test assumptions that desk sources do not fully explain, such as average selling price movement, mix shift between manual and robotic assisted approaches, and purchasing cycles across hospitals and ambulatory surgical centers. We spoke with a spread of manufacturers, distributors, hospital procurement, and clinical users across major geographies so the model could be adjusted to real buying behavior and current utilization patterns.
Distribution of primary research fieldwork respondents
| Company type | Respondent position | Region |
|---|---|---|
| Top tier: 38% | CXOs: 16% | APAC: 41% |
| Mid tier: 45% | Functional/Unit leaders: 31% | EMEA: 34% |
| Smaller Players: 17% | Managers: 53% | Americas: 25% |
Market-Sizing & Forecasting
Sizing starts from a top-down build that reconstructs the demand pool from procedure volumes by major MIS application areas and the typical device set used per procedure, then translated into value using price bands and mix. The totals are corroborated through selective bottom-up checks, including sampled revenue rollups for key product groups, channel checks on distribution markups, and volume times ASP sanity tests, and then adjusted when mismatches appear.
Inputs that matter in this market include growth in laparoscopic and endoscopic procedure volumes, penetration of robotic assisted surgery in high value procedures, replacement cycles for capital equipment, shifts of cases toward outpatient settings, regulatory clearance pace for new device families, and inflation and currency timing for imported components and finished devices. Forecasts were built using scenario analysis around procedure growth and adoption curves, and then refined using interview-based consensus on utilization, pricing, and hospital budgeting expectations. Where bottom-up gaps exist for smaller countries or niche applications, ratios from similar markets were applied and then reviewed again with regional experts.
Data Validation & Update Cycle
Outputs were checked through multiple passes so the numbers stay aligned with real world signals, not just one spreadsheet view. We compare results against independent indicators like procedure growth, hospital capital spending direction, and visible product adoption, and then investigate outliers that show unusual jumps by geography or product.
Before sign-off, assumptions are reviewed by another analyst, and call backs are triggered if price, mix, or adoption feedback conflicts with the model. The report is refreshed annually, and interim updates are made when material events affect procedure volumes, regulatory access, or pricing. Right before delivery, a final review pass is completed so clients receive the most current view available at that time.
Mordor Intelligence's Global Minimally Invasive Devices Market Market Size Compared With Other Published Estimates
Published market sizes for minimally invasive surgery devices can look far apart even when they use similar wording, because the counted product sets and the timing of pricing assumptions differ. Gaps also come from how procedure growth is translated into device demand, and how much verification is done with hospital and channel feedback.
Some external figures lean toward a narrower instrument-only view, while others blend in adjacent interventional device categories that sit outside the operating room. In Mordor Intelligence, the total is built around MIS surgical devices and systems that are directly used in these procedures, and general supplies and non-surgical interventional tools are kept out so the value stays tied to the same demand pool.
Benchmark comparison
| Source | Market Size | Gaps in Research Methodology |
|---|---|---|
| Mordor Intelligence | USD 36.52 B (2025) | |
| Industry Research House A | USD 29.79 B (2025) | Often presented as a minimally invasive surgical devices total but tends to undercount by treating several high value system categories as optional add-ons, and it applies a longer forecast window that can compress near term pricing and mix effects. |
| Market Analytics Group B | USD 34.90 B (2025) | Positions the scope as instruments, which can leave out parts of the capital and energy system spend captured when hospitals purchase complete MIS set-ups, and it may use different ASP bands by region without re-checking them against current procurement feedback. |
The spread in the table is mainly explained by what gets counted as a complete MIS device spend versus an instruments-only basket, plus differences in how prices are updated year to year. By linking the estimate to procedure driven demand, and then confirming key price and mix assumptions through interviews, our result stays traceable and repeatable even when public data is patchy.


Key Questions Answered in the Report
How large is the minimally invasive surgery devices market in 2026?
The Minimally Invasive Surgery Devices Market size is USD 38.9 billion in 2026, with a projected 6.52% CAGR to 2031.
Which product category currently leads revenue?
Handheld instruments hold 37.65% of global revenue in 2025, reflecting their ubiquity across laparoscopic and endoscopic procedures.
What is the fastest-growing regional opportunity?
Asia Pacific advances at a 9.98% CAGR on the back of new hospital construction, rising incomes, and government support for medical tourism.
How quickly are robotic systems expanding?
Robotic-assisted platforms are expected to post a 9.12% CAGR through 2031, the highest among product groups.
Why are ambulatory surgical centers gaining traction?
ASCs offer lower facility fees and same-day discharge, enabling a forecast 8.73% CAGR in device demand through 2031.
Which clinical area shows the sharpest growth outside orthopedics?
Neurological procedures are projected to grow at a 7.62% CAGR due to AI-guided navigation and robotic precision in delicate brain and stroke surgeries.
Page last updated on:





