Insurance Analytics Market Size and Share
Market Overview
| Study Period | 2020 - 2031 |
|---|---|
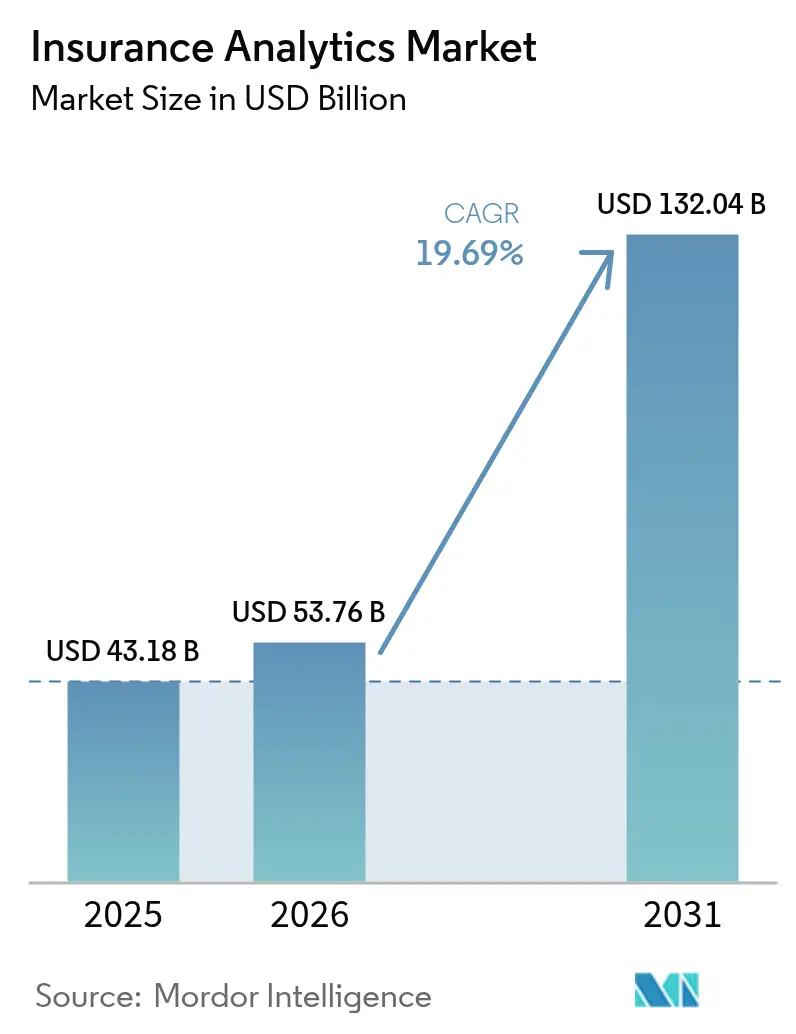
| Market Size (2026) | USD 53.76 Billion |
| Market Size (2031) | USD 132.04 Billion |
| Growth Rate (2026 - 2031) | 19.69% CAGR |
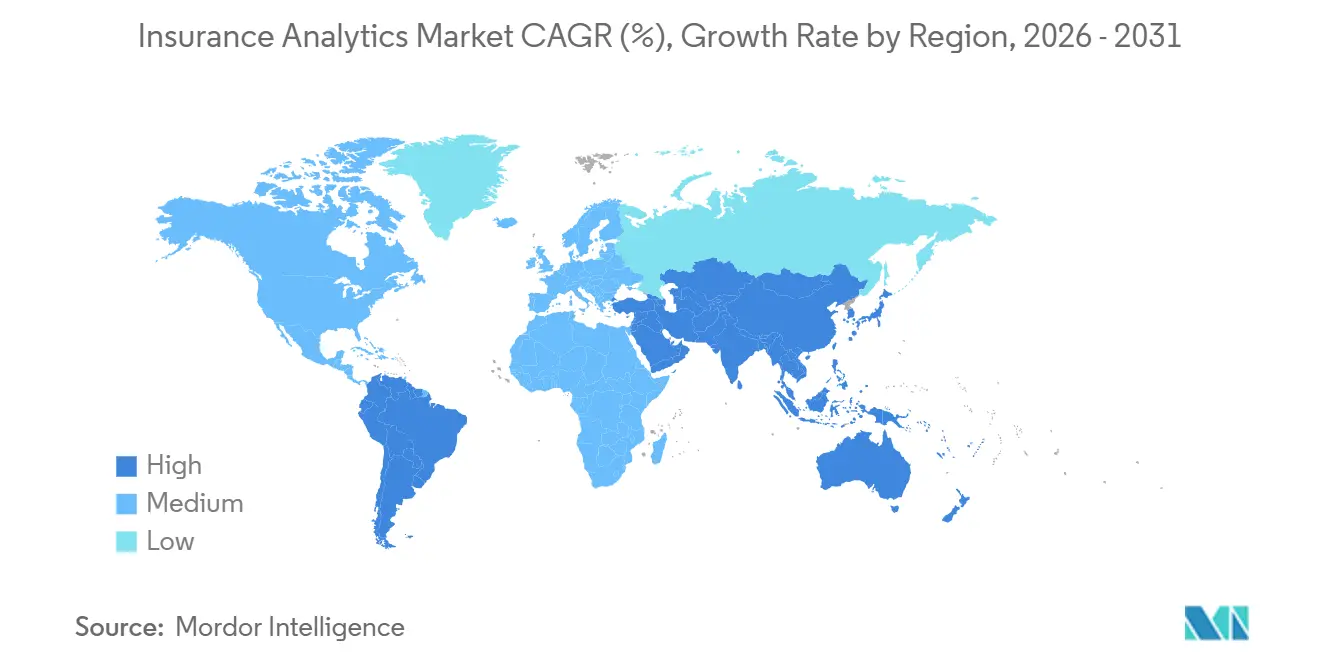
| Fastest Growing Market | Asia Pacific |
| Largest Market | North America |
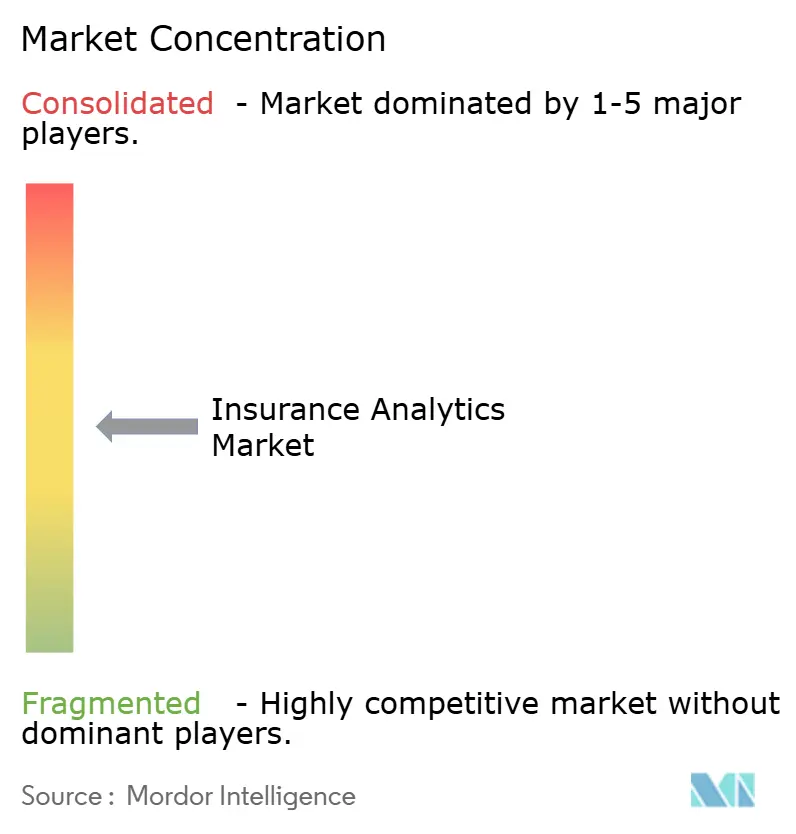
| Market Concentration | Medium |
Major Players *Disclaimer: Major Players sorted in no particular order Image © Mordor Intelligence. Reuse requires attribution under CC BY 4.0. | |
Insurance Analytics Market Analysis by Mordor Intelligence
The insurance analytics market size is expected to increase from USD 43.18 billion in 2025 to USD 53.76 billion in 2026 and reach USD 132.04 billion by 2031, growing at a CAGR of 19.69% over 2026-2031. Uptake is strongest where carriers combine cloud elasticity with real-time data streams, allowing underwriters to price tail risks that outpace legacy actuarial tables. Generative artificial intelligence now summarizes loss narratives and automates low-complexity underwriting, shrinking processing times from weeks to minutes. Climate volatility, ransomware, and embedded-insurance partnerships are intensifying demand for granular, continuously updated risk signals, while strict data-sovereignty mandates push carriers to bake compliance into analytics pipelines. Vendors that bundle explainability, bias testing, and model retraining are therefore winning large multiyear contracts, especially in North America and Asia-Pacific.
Key Report Takeaways
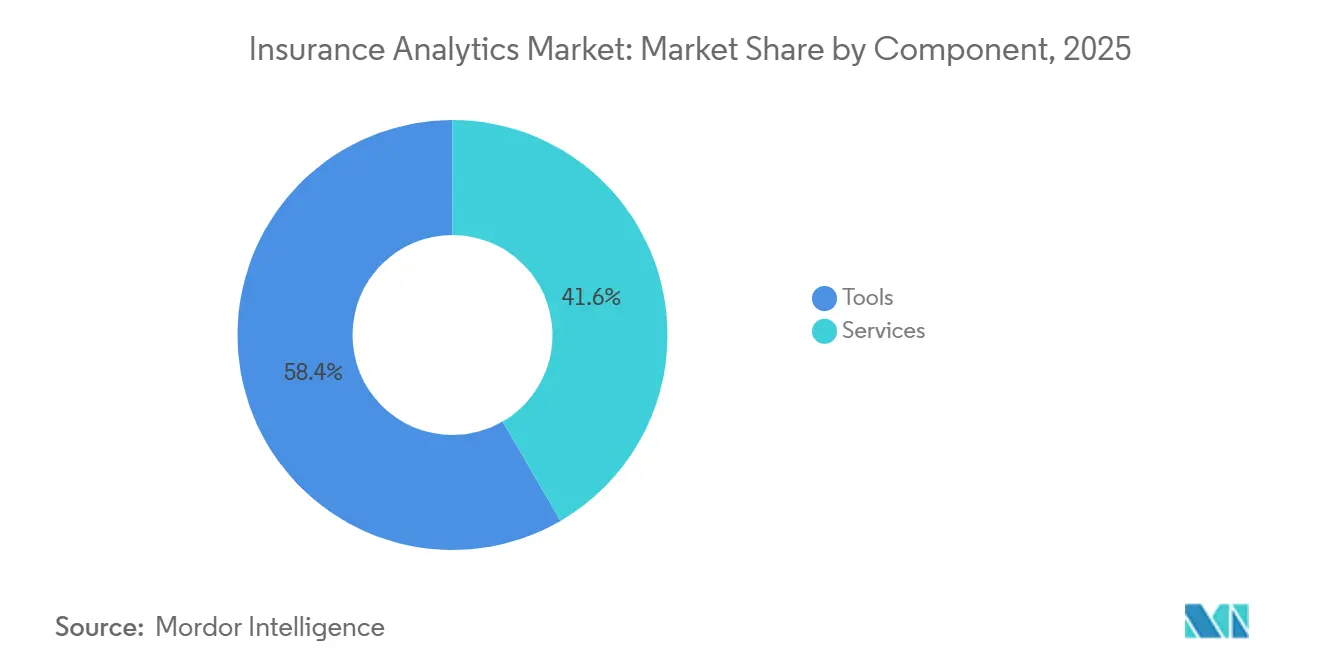
- By component, tools captured 58.37% of the insurance analytics market share in 2025; services is projected to expand at a 20.55% CAGR to 2031.
- By business application, claims management led with 31.29% revenue share in 2025, while fraud detection and prevention is forecast to advance at a 20.95% CAGR through 2031.
- By deployment mode, cloud installations accounted for 64.29% of the insurance analytics market size in 2025 and are growing at a 20.13% CAGR to 2031.
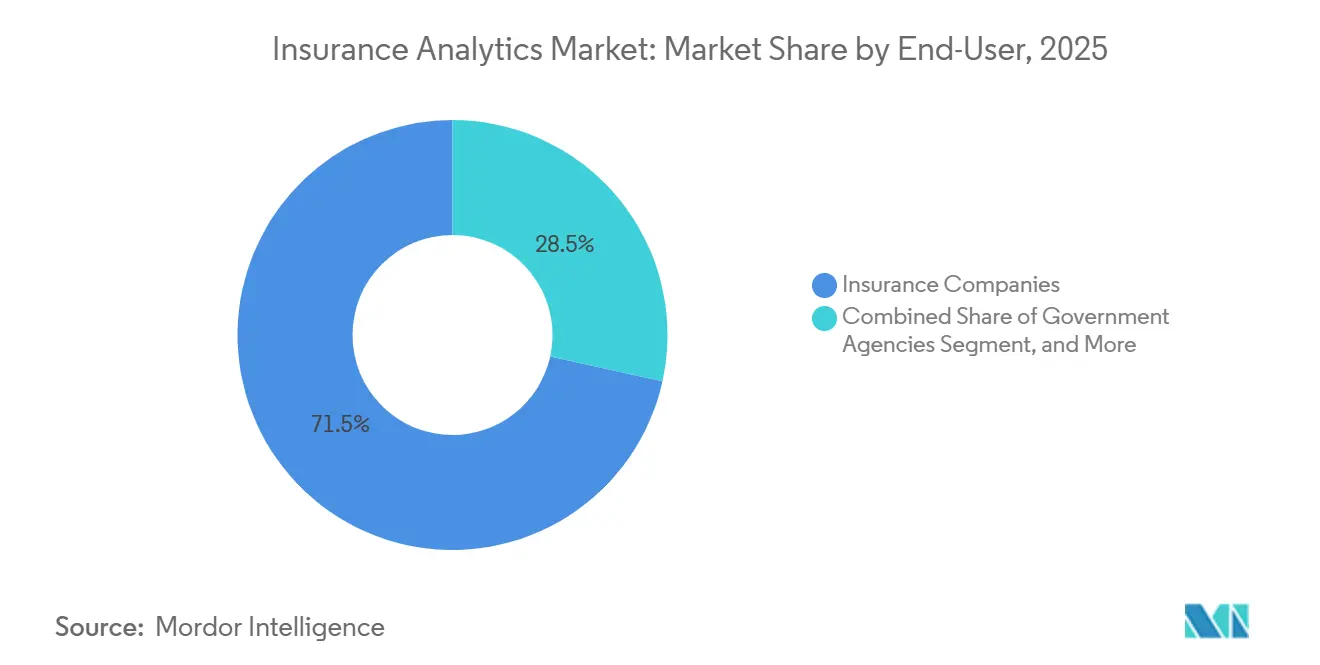
- By end-user, insurance companies held 71.54% of 2025 spending; third-party administrators and brokers show the fastest growth at 20.71% through 2031.
- By insurance line, property and casualty contributed 38.73% share in 2025, whereas specialty lines are expanding at a 19.99% CAGR to 2031.
- By organization size, large enterprises dominated with 66.69% share in 2025; small and medium enterprises are climbing at a 20.06% CAGR to 2031.
- By analytics technique, descriptive models held 40.01% share in 2025, but prescriptive analytics is advancing at a 20.45% CAGR to 2031.
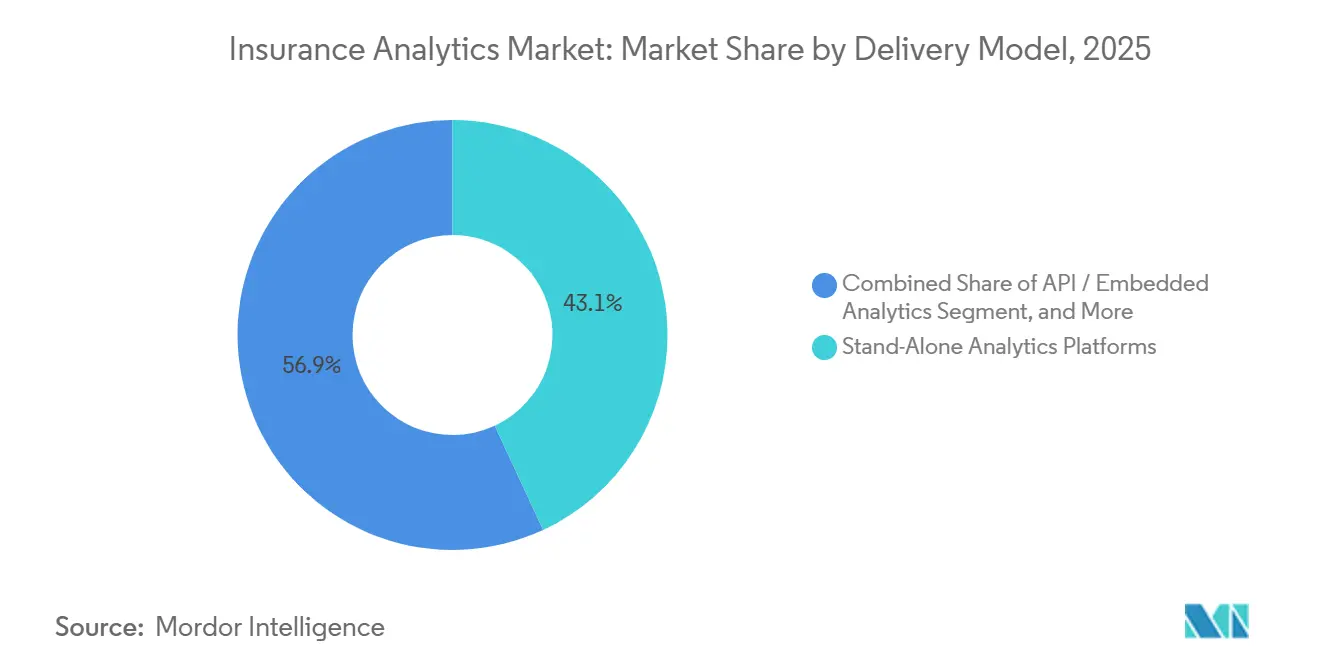
- By delivery model, stand-alone platforms led with 43.06% share in 2025; API and embedded analytics are projected to rise at a 20.78% CAGR through 2031.
- By data source, internal enterprise records represented 54.44% share in 2025, while IoT and telematics feeds are growing at a 20.73% CAGR to 2031.
- By geography, North America commanded 37.54% share in 2025; Asia-Pacific is the fastest-growing region at a 21.01% CAGR to 2031.
Note: Market size and forecast figures in this report are generated using Mordor Intelligence’s proprietary estimation framework, updated with the latest available data and insights as of 2026.
Global Insurance Analytics Market Trends and Insights
Drivers Impact Analysis*
| Driver | (~) % Impact on CAGR Forecast | Geographic Relevance | Impact Timeline |
|---|---|---|---|
| Increased Adoption of Advanced Technologies | +5.2% | Global, with early concentration in North America and Europe | Medium term (2-4 years) |
| Rise in Competition among Insurers | +3.8% | Global, particularly intense in Asia-Pacific and North America | Short term (≤ 2 years) |
| Growing Volume of Internal and External Data Streams | +4.1% | Global, with spillover from IoT adoption in Asia-Pacific to Middle East and Africa | Medium term (2-4 years) |
| Climate-Risk Quantification Demands | +2.9% | Global, acute in coastal and agricultural regions across all continents | Long term (≥ 4 years) |
| Generative AI-Driven Underwriting Automation | +3.5% | North America and Europe core, expanding to Asia-Pacific | Short term (≤ 2 years) |
| Parametric Micro-insurance Analytics for Climate-Vulnerable Regions | +1.7% | Africa, South Asia, Latin America, with pilot programs in Southeast Asia | Long term (≥ 4 years) |
| Source: Mordor Intelligence | |||
Increased Adoption of Advanced Technologies
Carriers are embedding machine learning, natural language processing, and computer vision across the policy life-cycle to shave cost ratios and refine loss prediction. Pre-trained optical-character-recognition models ingest historical policy packets, unlocking long-tail features that boost claim severity forecasts. Mid-tier insurers now access advanced models through cloud marketplaces, avoiding prolonged data-science recruitment cycles. Deloitte projects that such deployments could unlock between USD 80 billion and USD 160 billion in annual value for property-and-casualty lines by 2032. European insurers face additional impetus from the EU AI Act, which classifies pricing engines as high-risk and mandates explainability, pushing demand for audit-ready toolkits.[1]European Commission, “Regulatory Framework on AI,” DIGITAL-STRATEGY.EC.EUROPA.EU
Growing Volume of Internal and External Data Streams
IoT sensors, satellite imagery, weather APIs, and open-banking feeds now sit beside traditional policy data, creating petabyte-scale stores that overwhelm legacy warehouses. Swiss Re observed that 82% of commercial underwriters used at least one alternative data source in 2025, up from 61% just two years earlier. Real-time asset monitoring shifts loss prevention from periodic inspection to continuous alerting, which trims frequency and accelerates payout when events occur. The surge in data volume drives carriers to adopt cloud object storage, automated quality checks, and fine-grained consent tagging aligned with GDPR and the California Consumer Privacy Act. Firms that master multi-source fusion capture competitive alpha by detecting supply-chain disruptions or localized climate anomalies weeks ahead of laggards.
Climate-Risk Quantification Demands
Escalating wildfire, flood, and hurricane losses have made backward-looking actuarial tables unreliable. The Geneva Association recorded catastrophe claims topping USD 100 billion for the fourth straight year in 2025.[2]Geneva Association, “Climate Change and Insurance,” GENEVAASSOCIATION.ORG Forward-looking models now ingest IPCC temperature pathways, sea-level projections, and precipitation shifts, enabling carriers to stress-test portfolios under 1.5 °C to 3 °C scenarios. Parametric products that trigger on wind speed or rainfall volume accelerate recovery in climate-vulnerable economies, reducing moral hazard and adjustment friction. Regulators are codifying disclosure; IAIS guidance requires quantified climate exposures in annual solvency filings, pushing investment toward sophisticated scenario analytics.
Generative AI-Driven Underwriting Automation
Large language models summarize medical records, police reports, and claimant statements in seconds, delivering draft risk scores to underwriters. Early pilots at U.S. carriers cut turnaround times for low-complexity policies by 70%, freeing experts to focus on nuanced exposures. Guidewire and Google Cloud embedded generative AI into core systems in January 2026, signaling mainstream adoption. Adoption is tempered by governance overhead: carriers must log prompts, version models, and monitor drift to satisfy model-risk management rules. Vendors that supply built-in audit trails, bias detection, and rollback features are therefore expanding wallet share faster than stand-alone chatbot providers.
Restraints Impact Analysis*
| Restraint | (~) % Impact on CAGR Forecast | Geographic Relevance | Impact Timeline |
|---|---|---|---|
| Stringent Data-Privacy and Governance Regulations | -2.4% | Europe and North America core, expanding to Asia-Pacific | Short term (≤ 2 years) |
| High Concern over Cybersecurity and Data Breaches | -1.9% | Global, with heightened scrutiny in North America and Europe | Medium term (2-4 years) |
| Opaque AI-Model Explainability Risk in Regulated Pricing | -1.3% | North America and Europe, emerging in Asia-Pacific | Medium term (2-4 years) |
| Shortage of Synthetic Data for Rare-Event Modeling | -0.8% | Global, particularly acute for specialty lines and emerging markets | Long term (≥ 4 years) |
| Source: Mordor Intelligence | |||
Stringent Data-Privacy and Governance Regulations
GDPR, the California Consumer Privacy Act, and NAIC security model laws force insurers to manage consent, deletion, and breach reporting within tight timelines. European carriers allocate around 4.2% of IT budgets to lineage mapping and privacy-impact assessments, driving spend on governance platforms. Article 22 of GDPR lets policyholders opt out of fully automated decisions, compelling hybrid human-in-the-loop workflows that slow straight-through processing. Cross-border data transfers add friction after the EU-U.S. Privacy Shield’s invalidation, obliging insurers to draft standard contractual clauses and supplementary safeguards before exporting data.
High Concern over Cybersecurity and Data Breaches
Ransomware attacks on claims systems have forced manual processing and litigation exposure. IBM estimated the average breach cost for financial services at USD 6.08 million in 2025, with detection and escalation swallowing 38% of the tally. Regulators add monetary pain: EIOPA issued EUR 47 million (USD 53 million) in fines during 2025 for encryption lapses and slow notifications.[3]EIOPA, “AI Governance Guidelines,” EIOPA.EUROPA.EU Insurers are rolling out zero-trust architectures, multi-factor authentication, and continuous penetration testing, but expanding API ecosystems enlarge the attack surface. This restraint moderates near-term adoption of open analytics marketplaces and delays cloud migrations in highly regulated jurisdictions.
*Our forecasts treat driver/restraint impacts as directional, not additive. The impact forecasts reflect baseline growth, mix effects, and variable interactions.
Segment Analysis
By Component: Services Gain Ground as Model Complexity Rises
Tools commanded 58.37% of 2025 revenue because carriers valued configurable dashboards and pre-built connectors. Yet spiraling demand for generative AI fine-tuning, synthetic-data generation, and bias audits lifts services at a 20.55% CAGR. Consulting majors align fees with loss-ratio savings, bundling fraud-investigation runbooks and end-to-end claims triage. Regulatory pressure from the EU AI Act intensifies needs for third-party conformity assessments.
Services vendors bridge the talent gap that 63% of insurers cite as a hiring hurdle, according to a 2025 McKinsey survey. They embed cross-domain squads that couple data engineers with actuaries, ensuring compliant deployment. Meanwhile, stand-alone platforms stay relevant for data-sovereignty use cases, offering private-cloud blueprints that burst into public GPU clusters for catastrophe modeling spikes. The insurance analytics market continues to balance build-versus-buy decisions as carriers weigh customization against speed.


By Business Application: Fraud Detection Surges Ahead
Claims management led with 31.29% share in 2025, reflecting legacy rules engines and decades of incremental modernization. However, fraud detection and prevention is racing ahead at a 20.95% CAGR, propelled by graph analytics that expose staged-accident rings and AI that flags billing upcoding. The Coalition Against Insurance Fraud pegs U.S. losses at USD 308 billion annually, making analytics investment an easy board-room sell.[4]Coalition Against Insurance Fraud, “Annual Fraud Statistics,” INSURANCEFRAUD.ORG
Natural language processing scans adjuster notes for contradictions, while computer vision spots image manipulation. Shift Technology and FRISS illustrate vendor momentum, raising sizeable capital rounds to globalize offerings. Risk-management and process-optimization modules follow close behind, automating reserve adequacy checks and routing straightforward quotes to instant-issue engines. Across every function, the insurance analytics market rewards real-time scoring that lowers loss costs even as claim complexity rises.
By Deployment Mode: Cloud Dominance Reflects Elastic Economics
Cloud deployments made up 64.29% share in 2025 and remain on a 20.13% growth track through 2031. Elastic compute lets carriers spin up thousands of catastrophe-model workers hours before a hurricane makes landfall, then decommission them post-event. Guidewire’s 2026 expansion with Google Cloud exemplifies vendor moves to certify encryption, access controls, and audit trails that satisfy NAIC model laws.
On-premise estates survive where data-localization rules or mainframe bonds persist. Hybrid topologies are common: sensitive personally identifiable information sits in private clouds while GPU-heavy imaging workloads run in public regions. Small and medium enterprises flock to software-as-a-service suites that bundle analytics, billing, and CRM, removing capex barriers. Multi-cloud cost governance and inter-cloud latency pose emerging challenges for the insurance analytics market, nudging providers toward unified observability stacks.
By End-User: Brokers and TPAs Embrace Multi-Carrier Insight
Insurance companies absorbed 71.54% of 2025 spend, leveraging proprietary loss data to refine combined ratios. Yet third-party administrators and brokers are scaling analytics budgets at 20.71% as they shift from spreadsheet comparisons to API-driven quote aggregation. Applied Systems and similar vendors stream live carrier rates into broker portals, strengthening client retention.
Government agencies adopt anomaly detection for public schemes, though budgets trail private peers. Carriers escalate investment to counter embedded-insurance rivals that threaten direct channel economics. Meanwhile, brokers harness customer churn models and predictive renewal alerts to defend fee income. The insurance analytics industry therefore expands across the value chain, not just within underwriting entities.

By Insurance Line: Specialty Models Fill Data Gaps
Property and casualty lines held 38.73% share in 2025 owing to established telematics and catastrophe modeling. Specialty lines, including cyber, directors-and-officers, and parametric climate covers, advance at a 19.99% CAGR as carriers craft bespoke models where historical loss curves barely exist. CyberCube’s aggregation analytics quantify ransomware shock scenarios, letting reinsurers cap downside exposures.
Auto remains the single largest sub-line as pay-how-you-drive programs proliferate, with 70% of U.S. personal-auto insurers planning telematics expansion in 2026. Parametric micro-insurance addresses climate-exposed smallholders in South Asia and Africa, using rainfall indices from satellite feeds to trigger claims. As climate variance rises, the insurance analytics market size allocated to specialty modeling continues to swell.
By Organization Size: Cloud Platforms Democratize Insight
Large enterprises accounted for 66.69% of 2025 spend, reflecting global portfolios and strict solvency demands. Nonetheless, small and medium enterprises grow at 20.06% as SaaS offerings deliver prescriptive dashboards without infrastructure overhead. Salesforce Financial Services Cloud slots machine-learning models into standard workflows, letting regional carriers deploy fraud scores in days, not months.
Talent shortages push SMEs toward managed services where vendors shoulder data engineering and model retraining. Large carriers, conversely, pursue proprietary competitive moats by fusing satellite imagery and decades of unstructured claim text. The insurance analytics market thus witnesses convergence: cloud democratization narrows capability gaps even as mega-insurers chase differentiation through exclusive data sets.
By Analytics Technique: Prescriptive Engines Take Center Stage
Descriptive dashboards owned 40.01% share in 2025 as finance and claims groups required consolidated reporting. Prescriptive engines, however, record a 20.45% CAGR by automating capital allocation, reinsurance structuring, and adjuster assignment. IBM’s optimization modules translate severity probabilities into reserve adjustments within minutes.
Diagnostic analytics sits between, using root-cause variance decomposition to pinpoint loss-ratio spikes. Predictive modeling underpins both ends, feeding probability scores to prescriptive solvers. Regulatory guardrails limit fully autonomous price changes, compelling human approval for suggested rate filings. Even so, the insurance analytics market rewards carriers that turn insight into action fastest.
By Delivery Model: API-First Architectures Shorten Latency
Stand-alone suites earned 43.06% revenue in 2025, offering deep notebooks, model catalogs, and orchestration. Yet API and embedded analytics climb at 20.78% as underwriters prefer risk scores alongside policy screens rather than in separate portals. Gartner expects 58% of insurers to embed at least one analytic microservice within core systems by 2027.
Embedded delivery trims context switching and speeds adoption but can cap custom algorithm flexibility. Stand-alone platforms remain indispensable for data-science sandboxes and cross-line experimentation. The insurance analytics market thus sustains dual demand: low-code embedded widgets for speed and heavyweight studios for competitive experimentation.
By Data Source: Telematics and IoT Transform Behavior-Based Pricing
Internal enterprise data still forms 54.44% of source volume, powering actuarial baselines. IoT and telematics feeds, however, expand at 20.73% as carriers pivot to behavior-based underwriting. Arity processed more than 500 billion miles of driving data in 2025, feeding real-time risk scores to dozens of insurers.
Connected-home sensors now alert policyholders to leaks and intrusion, preventing losses and enabling premium discounts. Third-party enrichment such as credit and property records improves segmentation but raises bias concerns under NAIC guidance. Data-quality fluctuations from sensor drift and tampering necessitate anomaly scrubbing pipelines. Consequently, the insurance analytics industry allocates rising budgets to data-ops and governance tooling that keep streaming inputs decision-grade.
Geography Analysis
North America retained 37.54% of 2025 revenue, anchored by mature cloud estates and proactive NAIC cybersecurity model laws. U.S. insurers deploy generative AI for policy triage, while Colorado’s algorithmic-fairness statute compels real-time explainability tooling. Canada’s concentrated carrier base stresses operational efficiency over product proliferation, whereas Mexico’s auto-insurance mandate sparks telematics adoption despite softer privacy regimes.
Asia-Pacific is the fastest riser with a 21.01% CAGR, fueled by digital-first entrants in China, India, and Southeast Asia. Singapore’s regulatory sandbox accelerates AI pilots, and China’s megascale investment in facial recognition and chatbots spreads analytics across a potential customer pool exceeding 1.4 billion. India’s allowance for usage-based auto and parametric agriculture products unlocks vast underserved populations. Advanced cloud infrastructure in Australia and Singapore contrasts with skills shortages and patchy connectivity in emerging ASEAN markets, shaping heterogeneous adoption curves.
Europe contributes a mid-20s share, guided by GDPR and the AI Act’s high-risk classification of insurance algorithms. Germany, the United Kingdom, France, and Italy dominate spending as carriers seek Solvency II internal-model approvals. Post-Brexit divergence lets U.K. firms experiment under a proportionate AI regime, possibly gaining speed over EU peers. South America, the Middle East and Africa collectively occupy a low-teen slice but climb as governments champion financial inclusion and climate-risk insurance. Brazil leverages satellite analytics for crop covers, while Gulf nations infuse smart-city IoT data into property underwriting.

Competitive Landscape
The insurance analytics market remains moderately fragmented. Tech giants IBM, Oracle, SAP, Microsoft embed analytics into extensive policy, billing, and claims suites, using broad account footprints to upsell modules. Specialized vendors Guidewire, Verisk, Shift Technology differentiate with domain-specific models, catastrophe benchmarks, and fraud graphs. Consulting integrators Accenture, Cognizant, DXC bundle strategy, implementation, and managed analytics under gain-share contracts that tie fees to combined-ratio improvement.
Guidewire’s January 2026 tie-up with Google Cloud adds generative AI document summarization native to its core suite, cutting manual processing by an estimated 40%. Verisk’s 2025 acquisition of a climate-modeling startup arms property-and-casualty carriers with forward-looking scenario tools that mesh with reinsurance buys. Palantir’s multi-year reinsurer contract showcases data-fusion demand for exposure management at group level.
White-space targets include parametric micro-insurance platforms for smallholder farmers and synthetic-data engines that replicate hail or ransomware shocks without exposing live customer records. Venture-funded insurgents such as CyberCube and DataRobot secure footholds by offering plug-and-play cyber aggregation or automated machine learning. Vendors that package regulatory artefacts model cards, bias dashboards, conformity reports gain advantage as the EU AI Act’s 2026 deadline nears.
Insurance Analytics Industry Leaders
IBM Corporation
Oracle Corporation
SAP SE
SAS Institute Inc.
Microsoft Corporation
- *Disclaimer: Major Players sorted in no particular order

Recent Industry Developments
- January 2026: Guidewire Software expanded its Google Cloud partnership to embed generative AI in underwriting and claims platforms, reducing routine review times by 40%.
- December 2025: Shift Technology raised USD 220 million Series E funding to scale fraud analytics across Asia-Pacific and enhance generative investigative tools.
- November 2025: Microsoft launched Fabric for Insurance, a lakehouse architecture integrating Azure AI models for churn, fraud, and dynamic pricing.
- October 2025: Verisk Analytics bought a climate-risk modeling startup for USD 180 million to bolster scenario analysis capabilities.


Global Insurance Analytics Market Report Scope
The Insurance Analytics Market is witnessing significant growth driven by insurance providers' increasing adoption of advanced analytics tools and technologies to enhance decision-making, improve customer experience, and optimize operational efficiency. The integration of artificial intelligence (AI), machine learning (ML), and big data analytics is driving industry innovation, enabling insurers to better assess risks, detect fraud, and personalize offerings.
The Insurance Analytics Market Report is Segmented by Component (Tools, Services), Business Application (Claims Management, Risk Management, Fraud Detection and Prevention, Process Optimization, Customer Management and Personalization), Deployment Mode (On-Premise, Cloud), End-User (Insurance Companies, Government Agencies, Third-Party Administrators, Brokers and Consultancies), Insurance Line (Life and Health, Property and Casualty, Auto, Specialty Lines), Organization Size (Large Enterprises, Small and Medium Enterprises), Analytics Technique (Descriptive, Diagnostic, Predictive, Prescriptive), Delivery Model (Stand-Alone Platforms, Core-System Embedded, API/Embedded), Data Source (Internal Enterprise, External Third-Party, IoT and Telematics, Open-Banking and Alternative Data), and Geography (North America, South America, Europe, Asia-Pacific, Middle East, Africa). The Market Forecasts are Provided in Terms of Value (USD).
| Tools |
| Services |
| Claims Management |
| Risk Management |
| Fraud Detection and Prevention |
| Process Optimization |
| Customer Management and Personalization |
| On-Premise |
| Cloud |
| Insurance Companies |
| Government Agencies |
| Third-Party Administrators, Brokers and Consultancies |
| Life and Health |
| Property and Casualty |
| Auto |
| Specialty Lines |
| Large Enterprises |
| Small and Medium Enterprises (SMEs) |
| Descriptive Analytics |
| Diagnostic Analytics |
| Predictive Analytics |
| Prescriptive Analytics |
| Stand-Alone Analytics Platforms |
| Core-System Embedded Analytics |
| API / Embedded Analytics |
| Internal Enterprise Data |
| External Third-Party Data |
| IoT and Telematics Data |
| Open-Banking & Alternative Data |
| North America | United States |
| Canada | |
| Mexico | |
| South America | Brazil |
| Argentina | |
| Colombia | |
| Rest of South America | |
| Europe | Germany |
| United Kingdom | |
| France | |
| Italy | |
| Spain | |
| Russia | |
| Netherlands | |
| Rest of Europe | |
| Asia-Pacific | China |
| Japan | |
| South Korea | |
| India | |
| Australia | |
| Singapore | |
| Rest of Asia-Pacific | |
| Middle East | Saudi Arabia |
| United Arab Emirates | |
| Rest of Middle East | |
| Africa | South Africa |
| Egypt | |
| Rest of Africa |
| By Component | Tools | |
| Services | ||
| By Business Application | Claims Management | |
| Risk Management | ||
| Fraud Detection and Prevention | ||
| Process Optimization | ||
| Customer Management and Personalization | ||
| By Deployment Mode | On-Premise | |
| Cloud | ||
| By End-User | Insurance Companies | |
| Government Agencies | ||
| Third-Party Administrators, Brokers and Consultancies | ||
| By Insurance Line | Life and Health | |
| Property and Casualty | ||
| Auto | ||
| Specialty Lines | ||
| By Organization Size | Large Enterprises | |
| Small and Medium Enterprises (SMEs) | ||
| By Analytics Technique | Descriptive Analytics | |
| Diagnostic Analytics | ||
| Predictive Analytics | ||
| Prescriptive Analytics | ||
| By Delivery Model | Stand-Alone Analytics Platforms | |
| Core-System Embedded Analytics | ||
| API / Embedded Analytics | ||
| By Data Source | Internal Enterprise Data | |
| External Third-Party Data | ||
| IoT and Telematics Data | ||
| Open-Banking & Alternative Data | ||
| By Geography | North America | United States |
| Canada | ||
| Mexico | ||
| South America | Brazil | |
| Argentina | ||
| Colombia | ||
| Rest of South America | ||
| Europe | Germany | |
| United Kingdom | ||
| France | ||
| Italy | ||
| Spain | ||
| Russia | ||
| Netherlands | ||
| Rest of Europe | ||
| Asia-Pacific | China | |
| Japan | ||
| South Korea | ||
| India | ||
| Australia | ||
| Singapore | ||
| Rest of Asia-Pacific | ||
| Middle East | Saudi Arabia | |
| United Arab Emirates | ||
| Rest of Middle East | ||
| Africa | South Africa | |
| Egypt | ||
| Rest of Africa | ||


Key Questions Answered in the Report
What is the size of the insurance analytics market in 2026?
The insurance analytics market size is projected to reach USD 53.76 billion in 2026.
How fast is the market expected to grow through 2031?
It is forecast to expand at a 19.69% CAGR from 2026 to 2031.
Which region is growing the fastest?
Asia-Pacific is advancing at an annual 21.01% CAGR, the quickest pace among all regions.
Which application area shows the highest growth?
Fraud detection and prevention is the fastest-growing use case with a 20.95% CAGR to 2031.
Why are services outpacing tools?
Carriers outsource model validation, synthetic-data creation, and compliance audits, pushing services revenue up at a 20.55% CAGR.
What deployment model dominates new projects?
Cloud deployments lead with 64.29% share in 2025 and continue growing swiftly due to elastic compute and pay-as-you-go economics.
Page last updated on:


