Rigid Packaging Machinery Market Size and Share
Market Overview
| Study Period | 2019 - 2030 |
|---|---|
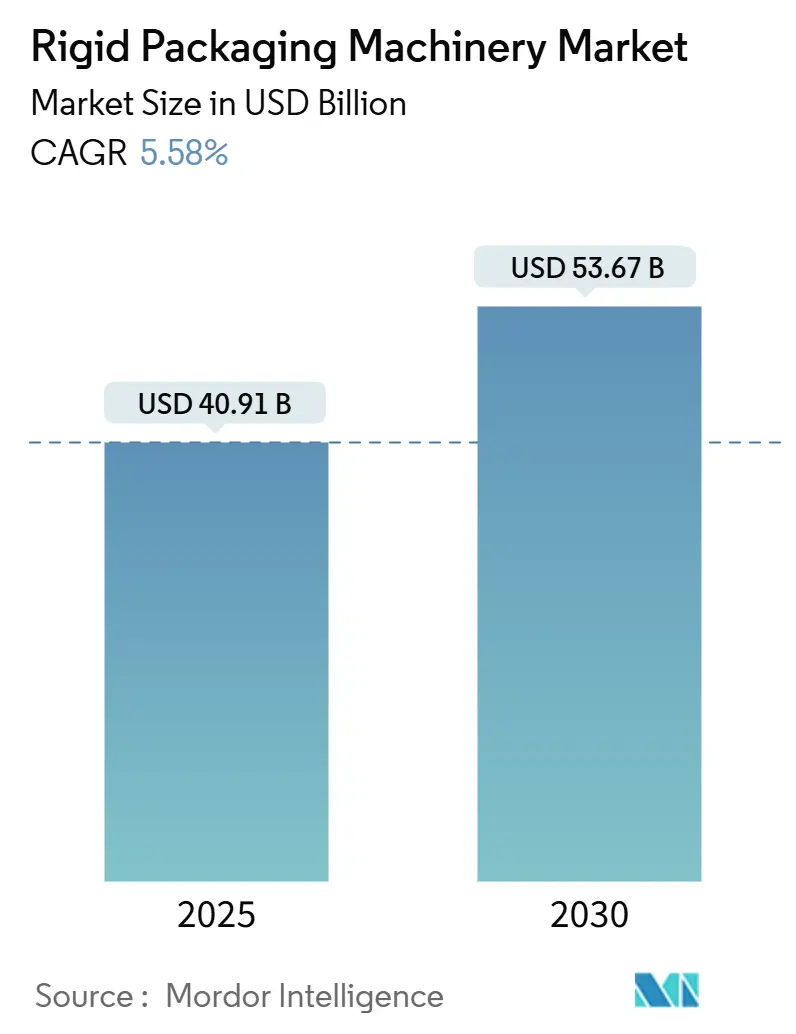
| Market Size (2025) | USD 40.91 Billion |
| Market Size (2030) | USD 53.67 Billion |
| Growth Rate (2025 - 2030) | 5.58% CAGR |
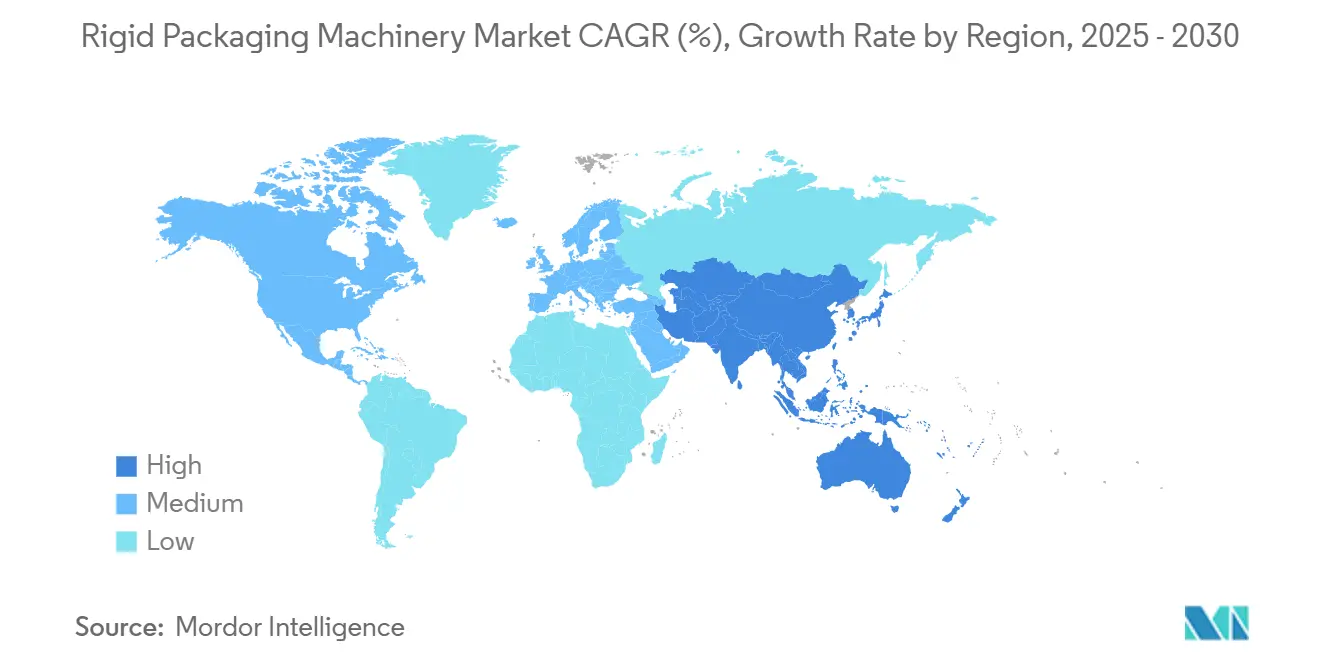
| Fastest Growing Market | Asia Pacific |
| Largest Market | Asia Pacific |
| Market Concentration | Low |
Major Players *Disclaimer: Major Players sorted in no particular order Image © Mordor Intelligence. Reuse requires attribution under CC BY 4.0. | |
Rigid Packaging Machinery Market Analysis by Mordor Intelligence
The rigid packaging machinery market size stands at USD 40.91 billion in 2025 and is projected to reach USD 53.67 billion by 2030, advancing at a 5.58% CAGR. This combination of scale and growth highlights the sector’s ability to thrive amid automation imperatives and strict sustainability regulations. Rising labor shortages in advanced economies have fast-tracked investments in fully automatic lines, while regulatory bodies expand aseptic packaging mandates that favor next-generation filling and dosing equipment. [1]U.S. Bureau of Labor Statistics, “Job Openings and Labor Turnover Summary,” bls.gov Brand owners’ shift toward recyclable paperboard and lightweight glass formats is prompting machinery upgrades that handle diverse substrates without compromising productivity. The adoption of Industry 4.0 platforms, which encompass predictive analytics, digital twins, and edge-based quality control, further enhances equipment utilization rates and reduces maintenance costs. Simultaneously, volatile steel and semiconductor prices continue to squeeze margins, yet most vendors offset cost pressure through modular designs and service-based revenue models.
Key Report Takeaways
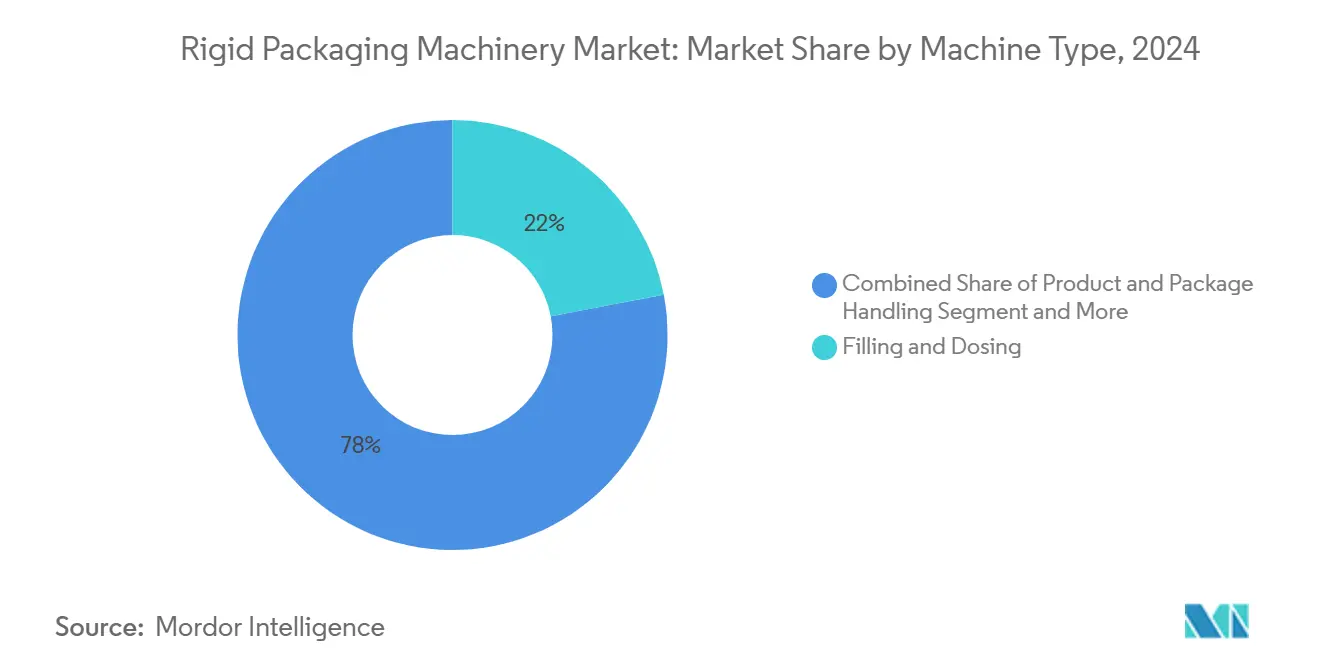
- By machine type, filling and dosing systems held 22.01% of the rigid packaging machinery market share in 2024, while product and package handling equipment is set to expand at a 9.81% CAGR through 2030.
- By end-user industry, food applications accounted for 42.53% of the rigid packaging machinery market size in 2024, whereas pharmaceutical lines exhibit the fastest 9.34% CAGR to 2030.
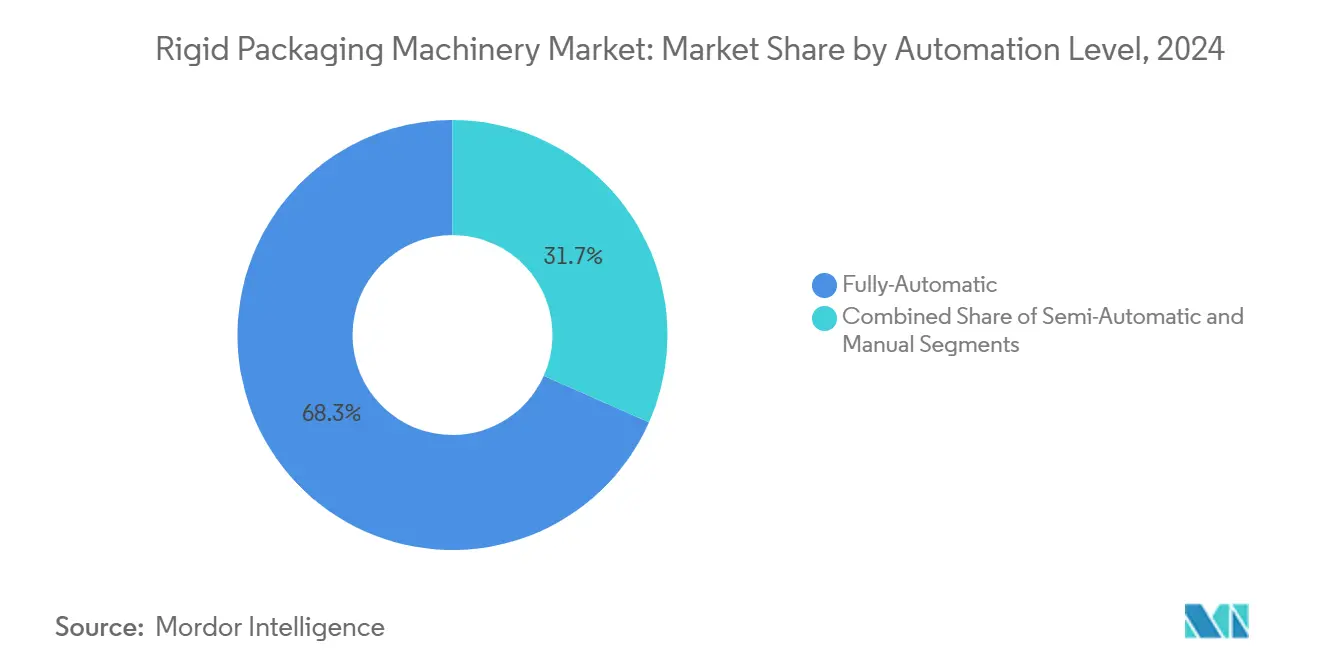
- By automation level, fully automatic solutions retained 68.34% revenue share in 2024 and will grow at an 8.04% CAGR over the forecast horizon.
- By packaging material handled, rigid plastics equipment controlled 54.12% share in 2024, yet paperboard-capable machinery is forecast to register a 7.54% CAGR to 2030.
- By geography, Asia-Pacific led with 38.23% revenue contribution in 2024, and the region is poised for a 7.23% CAGR through 2030.
Global Rigid Packaging Machinery Market Trends and Insights
Drivers Impact Analysis*
| Driver | (~) % Impact on CAGR Forecast | Geographic Relevance | Impact Timeline |
|---|---|---|---|
| Sustainability-driven rigid-to-paperboard shift | +1.2% | Global, led by European Union and North America | Medium term (2-4 years) |
| Rising aseptic and hygienic design demand | +0.9% | Global, strongest in pharmaceutical and food sectors | Long term (≥4 years) |
| Adoption of Industry 4.0 and predictive maintenance | +0.8% | North America and Europe, spreading to Asia-Pacific | Medium term (2-4 years) |
| Labor shortages accelerating end-of-line automation | +1.1% | North America and Europe, emerging in Asia-Pacific | Short term (≤2 years) |
| Beverage can and glass lines retooling for recyclability | +0.6% | Beverage hubs worldwide | Medium term (2-4 years) |
| Capex recovery cycle 2025-2027 in food and pharma | +0.7% | Industrialized economies | Short term (≤2 years) |
| Source: Mordor Intelligence | |||
Sustainability-Driven Rigid-to-Paperboard Shift
Brand owners moving away from rigid plastics now demand machinery that forms, fills, and seals thicker paperboard substrates at commercial speeds. New servo-driven feeders stabilize lightweight board, while hybrid tooling enables quick changeovers between polymer, glass, and paper formats. [2]European Commission, “Plastics Strategy Brochure,” ec.europa.eu This flexibility helps converters comply with extended producer responsibility laws in the European Union and growing eco-labels in North America. Rapid equipment retrofits avoid multimillion-dollar retooling projects and preserve line uptime. Vendors integrating inline moisture sensors and adaptive forming plates report waste reductions of 12-15% in trial runs, improving ROI for sustainability upgrades.
Rising Aseptic and Hygienic Design Demand
Stringent shelf-life and contamination requirements in biologics, ready-to-drink nutrition, and premium dairy categories accelerate aseptic line purchases. Modern isolators pair HEPA filtration with automated cleaning-in-place cycles, maintaining ISO 5 cleanroom conditions while slashing chemical usage. [3]U.S. Food and Drug Administration, “FSMA Final Rule: Preventive Controls for Human Food,” fda.gov Vision-assisted quality checks flag particulate risks in real time, preventing batch recalls that could exceed USD 10 million in downstream costs. This high entry barrier favors seasoned OEMs with validation expertise, locking in long-term service contracts and bolstering recurring revenue streams.
Adoption of Industry 4.0 and Predictive Maintenance
Edge-connected sensors feed vibration, torque, and temperature data to cloud analytics that forecast component wear weeks in advance. Users experience 15-25% uptime gains and 8-12% lower maintenance outlays once predictive models mature. Digital twins let operators simulate recipe changes offline, trimming changeover time by up to 40% and aiding workforce training amid ongoing skill shortages. Secure OPC UA gateways ensure data integrity, addressing cybersecurity concerns that once slowed digital convergence.
Labor Shortages Accelerating End-of-Line Automation
Unfilled manufacturing roles in the United States surpassed 600,000 in early 2025, with the most acute gaps in packaging and materials handling. Collaborative palletizing robots bridge staffing shortfalls and compress payback windows to 18-24 months for medium-volume plants. Motion-control software now simplifies job re-teaching, allowing a single technician to reconfigure case-packing cells during shift change without proprietary coding skills. Demand has spread to mid-tier converters that historically relied on manual pallet stacking but now seek to retain productivity amid tight labor markets.
Restraints Impact Analysis*
| Restraint | (~) % Impact on CAGR Forecast | Geographic Relevance | Impact Timeline |
|---|---|---|---|
| High upfront CAPEX and ROI uncertainty | -0.8% | Global, most severe for mid-sized manufacturers | Short term (≤2 years) |
| Volatile steel and electronic component prices | -0.6% | Worldwide, with added pressure in price-sensitive regions | Medium term (2-4 years) |
| Fragmented safety standards across regions | -0.4% | Multinational operations | Long term (≥4 years) |
| Limited skilled technicians in emerging markets | -0.3% | Asia-Pacific and Middle East and Africa | Medium term (2-4 years) |
| Source: Mordor Intelligence | |||
High Upfront CAPEX and ROI Uncertainty
Turnkey rigid packaging lines often cost USD 2 million-USD 15 million, leaving mid-sized firms wary of leveraged outlays without assured throughput gains. Financing hurdles deepen as lenders demand granular ROI models that quantify downtime risk during installation. Service-as-a-subscription models have surfaced, spreading costs over operating budgets but still face cultural resistance among traditionally asset-oriented manufacturers.
Volatile Steel and Electronic Component Prices
Steel price swings of 25-40% each year and sporadic semiconductor shortages extend controller lead times past 40 weeks, forcing OEMs to redesign boards or maintain high-cost inventories.[4]London Metal Exchange, “LME Steel Prices,” lme.com Smaller assemblers without global sourcing leverage lose price competitiveness and risk project delays, nudging buyers toward larger vendors or in-house rebuilds.
*Our forecasts treat driver/restraint impacts as directional, not additive. The impact forecasts reflect baseline growth, mix effects, and variable interactions.
Segment Analysis
By Machine Type: Filling Systems Anchor Spending Amid Handling-Equipment Upsurge
Filling and dosing units generated the largest slice of the rigid packaging machinery market size at USD 9.0 billion in 2024, translating to 22.01% of global revenue. Robust demand stems from their ubiquity across beverages, personal care, and parenteral drugs. Servo mass-flow meters now achieve fill-weight accuracy of ±0.5 g, cutting costly giveaway in premium nutrition powders. However, material-handling systems—spanning cartoners, case packers, and palletizers—are registering a head-turning 9.81% CAGR through 2030. Their ascent mirrors management’s pivot from manual pallet stacking toward lights-out warehouses, catalyzed by labor scarcity and e-commerce order mixes.
End-users tie ROI to reduced worker injuries and greater truck-deck utilization as automated vision aligns cartons with 0.2 mm precision before wrapping. The product-handling boom also sparks retrofits in legacy lines, whereby stand-alone robotics cells bolt onto existing fillers, extending equipment life by 6-8 years without full line replacement. Vendors able to package both liquid and dry formats inside modular frames are winning bids from co-packers juggling high SKU counts.


By End-User Industry: Pharma’s Fast Climb Counterbalances Food Supremacy
Food applications retained 42.53% revenue dominance in 2024, buoyed by repeat purchases of high-speed PET and metal can lines. Yet pharmaceuticals are propelling the fastest 9.34% CAGR on the back of biologic drug launches and heightened sterile packaging rules. Bioreactor output scale-up necessitates nested syringe fillers and barrier isolators that cost up to USD 8 million per suite, swelling OEM order books.
Drug serialisation mandates also spur camera-based code verifiers that integrate with national drug traceability hubs. In contrast, beverage segments tread water, constrained by soft-drink volume saturation in Western markets but partially lifted by craft spirits that require flexible glass bottling lines. Growth in personal care hinges on premium, low-run batches calling for quick-changeover equipment, where magnetically coupled conveyors shave eight-hour format swaps to under 30 minutes.
By Automation Level: Full Automation Remains the Benchmark
Fully automatic equipment contributed 68.34% of 2024 proceeds and will sustain an 8.04% CAGR through 2030, illustrating broad conviction that higher capex yields predictable throughput. Integrating AI-driven vision systems during pick-and-place has lowered micron-level misalignment defects from 400 ppm to under 50 ppm in pilot projects. The rigid packaging machinery market size accruing from semi-automatic lines is shrinking in share terms, yet they stay relevant for fragile glass or specialty cosmetic jars where tactile feel remains critical.
Hybrid human-robot stations, powered by force-feedback actuators, embody a middle path that attracts mid-market firms. Compliance with ISO 13849 functional-safety norms has advanced, enabling robots to slow to safe collaborative speeds when operators approach, thus maximizing floor space. Meanwhile, software updates now push wirelessly, turning control packages into upgradable assets instead of depreciating fixtures.
By Packaging Material Handled: Paperboard’s Momentum Gains Traction
Rigid plastics will still command the largest segment revenue at 54.12% in 2024, but consumer pushback over single-use polymers spurs upticks in paperboard equipment that logged a 7.54% CAGR forecast. Servo-governed forming wheels mitigate board memory, allowing 700 cartons per minute at defect rates matching plastic shells. Multi-substrate lines that flip between HDPE, glass, and recyclable board enable brand owners to pilot eco-friendly SKUs without capex-intensive parallel lines.
Glass machinery keeps a foothold in premium spirits and injectable drugs where barrier integrity outweighs weight considerations. Metal can systems innovate around lightweight aluminum and tethered caps to meet upcoming reuse quotas. Composite solutions stack thin polymer barriers on corrugated cores, challenging toolmakers to adapt ultrasonic sealing heads that traverse dissimilar melt points in a single stroke.
Geography Analysis
Asia-Pacific generated 38.23% of the rigid packaging machinery market size in 2024 and is poised for a 7.23% CAGR, underscoring its role as the sector’s growth engine. Government-backed industrial parks in China earmark more than USD 50 billion yearly for advanced drug and food processing lines. India draws sustained foreign direct investment into consumer-goods facilities, where localized machinery assembly reduces import duties and shortens lead times.
North America follows with solid demand propelled by reshoring strategies and the imperative to close labor gaps in filling and palletizing operations. The United States alone added over 7.5 million ft² of sterile-fill-finish capacity in 2024 to mitigate supply chain shocks, directly boosting orders for isolation-grade equipment. Mexico benefits from nearshoring policies and free-trade incentives that attract appliance and personal care brands seeking dual-country production footprints.
Europe maintains a steady share through strict circular-economy mandates that compel converters to retool for recyclable substrates. Germany’s engineering houses export 70% of their output, leveraging high-precision robotics to meet rising demand in Middle Eastern and African beverage hubs. Eastern European plants emerge as cost-effective manufacturing extensions, prompting intra-EU equipment transfers and retrofits that keep installed bases productive yet compliant.

Competitive Landscape
The competitive arena exhibits moderate concentration. Top European suppliers leverage deep process knowledge and field service networks to safeguard a combined 45-50% share of high-speed line shipments. Krones, KHS, and Syntegon accelerate R and D around digital twins and sustainability-ready modules, filing more than 900 packaging-related patents in 2024 alone. Asian challengers such as Sidel China and Tech-Long cut lead times by 20% via localized component ecosystems, gaining traction among cost-sensitive food and personal care converters.
Strategic alliances proliferate. Robotics vendors embed AI-guided vision systems into legacy cartoners, while software start-ups license cloud-based OEE dashboards that sit vendor-agnostic across multi-brand lines. Subscription models for remote condition monitoring convert one-time sales into annuity revenues, cushioning OEMs against raw-material volatility. Niche players specializing in serialization or glass hot-end inspection enjoy double-digit order growth as regulatory and premium-product niches expand.
Barriers to entry hinge on validation know-how and worldwide parts support. Service capability often tips procurement decisions in pharmaceutical plants where a single hour of downtime can exceed USD 100,000 in lost batch value. Consequently, established firms fortify aftermarket teams and invest in augmented-reality field assistance that trims technician travel by up to 60%.
Rigid Packaging Machinery Industry Leaders
Krones AG
KHS GmbH
Syntegon Technology GmbH
Sidel Group
Sacmi Imola S.C.
- *Disclaimer: Major Players sorted in no particular order

Recent Industry Developments
- February 2025: Syntegon Technology acquired Italian inspection specialist Antares Vision for EUR 1.2 billion (USD 1.3 billion), adding serialization and track-and-trace to its portfolio.
- January 2025: Krones AG committed EUR 180 million (USD 195 million) to enlarge its Taicang, China plant, scaling aseptic and digital-ready lines for regional pharma and premium beverage customers.
- January 2025: KHS GmbH rolled out EcoLine equipment featuring 30% lower energy consumption and full paperboard compatibility to aid clients in meeting European recycling quotas.
- December 2024: Sidel Group won a USD 85 million turnkey PET bottle contract in China, embedding AI-powered quality systems and predictive maintenance modules.
- November 2024: ProMach Inc. bought German cartoning firm Bradman Lake for USD 145 million, enhancing its presence in European pharma packaging.


Global Rigid Packaging Machinery Market Report Scope
| Filling and Dosing Machines |
| Bottling and Capping Lines |
| Cartoning and Case Packing Machines |
| Palletizing and Depalletizing Equipment |
| Inspection and Testing Equipment |
| Other Machine Type (FFS, Thermoforming, etc.) |
| Food |
| Beverage |
| Pharmaceutical |
| Personal Care and Cosmetics |
| Household and Industrial Chemicals |
| Other End-user Industries |
| Fully-Automatic |
| Semi-Automatic |
| Manual / Stand-Alone |
| Rigid Plastics |
| Glass |
| Metal |
| Paperboard and Corrugated |
| Composite and Others |
| North America | United States | |
| Canada | ||
| Mexico | ||
| South America | Brazil | |
| Argentina | ||
| Rest of South America | ||
| Europe | Germany | |
| United Kingdom | ||
| France | ||
| Italy | ||
| Spain | ||
| Russia | ||
| Rest of Europe | ||
| Asia-Pacific | China | |
| Japan | ||
| India | ||
| South Korea | ||
| South-East Asia | ||
| Rest of Asia-Pacific | ||
| Middle East and Africa | Middle East | Saudi Arabia |
| United Arab Emirates | ||
| Turkey | ||
| Rest of Middle East | ||
| Africa | South Africa | |
| Nigeria | ||
| Rest of Africa | ||
| By Machine Type | Filling and Dosing Machines | ||
| Bottling and Capping Lines | |||
| Cartoning and Case Packing Machines | |||
| Palletizing and Depalletizing Equipment | |||
| Inspection and Testing Equipment | |||
| Other Machine Type (FFS, Thermoforming, etc.) | |||
| By End-User Industry | Food | ||
| Beverage | |||
| Pharmaceutical | |||
| Personal Care and Cosmetics | |||
| Household and Industrial Chemicals | |||
| Other End-user Industries | |||
| By Automation Level | Fully-Automatic | ||
| Semi-Automatic | |||
| Manual / Stand-Alone | |||
| By Packaging Material Handled | Rigid Plastics | ||
| Glass | |||
| Metal | |||
| Paperboard and Corrugated | |||
| Composite and Others | |||
| By Geography | North America | United States | |
| Canada | |||
| Mexico | |||
| South America | Brazil | ||
| Argentina | |||
| Rest of South America | |||
| Europe | Germany | ||
| United Kingdom | |||
| France | |||
| Italy | |||
| Spain | |||
| Russia | |||
| Rest of Europe | |||
| Asia-Pacific | China | ||
| Japan | |||
| India | |||
| South Korea | |||
| South-East Asia | |||
| Rest of Asia-Pacific | |||
| Middle East and Africa | Middle East | Saudi Arabia | |
| United Arab Emirates | |||
| Turkey | |||
| Rest of Middle East | |||
| Africa | South Africa | ||
| Nigeria | |||
| Rest of Africa | |||


Key Questions Answered in the Report
What is the current value of the rigid packaging machinery market?
The rigid packaging machinery market size is USD 40.91 billion in 2025 and is forecast to reach USD 53.67 billion by 2030.
Which region leads demand for rigid packaging equipment?
Asia-Pacific holds 38.23% of revenue in 2024 and is advancing at a 7.23% CAGR through 2030.
Which machine type generates the highest revenue?
Filling and dosing systems lead with a 22.01% share in 2024 due to their cross-industry relevance.
Why is pharmaceutical packaging machinery growing so quickly?
Biologics expansion and stricter sterility rules drive a 9.34% CAGR for pharmaceutical machinery lines.
How are labor shortages influencing technology adoption?
Worker gaps accelerate end-of-line automation, prompting investments in palletizing robots and predictive maintenance tools that shorten payback periods.
Page last updated on:


