Food And Beverage Packaging Machinery Market Size and Share
Market Overview
| Study Period | 2019 - 2030 |
|---|---|
| Market Size (2025) | USD 21.67 Billion |
| Market Size (2030) | USD 29.72 Billion |
| Growth Rate (2025 - 2030) | 6.52% CAGR |
| Fastest Growing Market | Asia Pacific |
| Largest Market | Middle East |
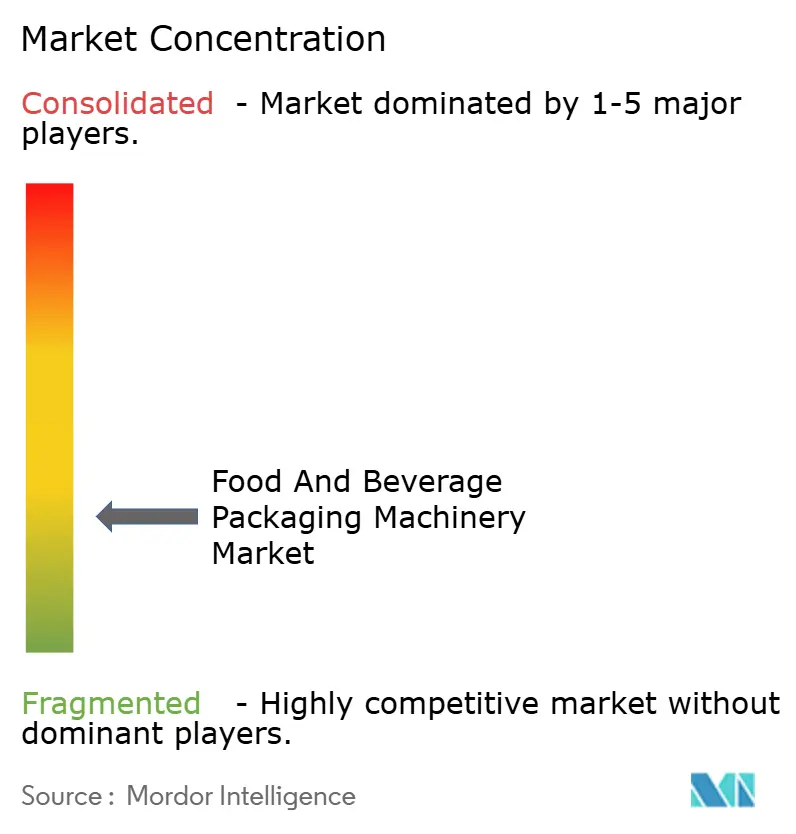
| Market Concentration | Low |
Major Players *Disclaimer: Major Players sorted in no particular order Image © Mordor Intelligence. Reuse requires attribution under CC BY 4.0. | |

Food And Beverage Packaging Machinery Market Analysis by Mordor Intelligence
The food and beverage packaging machinery market size reached USD 21.67 billion in 2025 and is forecast to touch USD 29.72 billion by 2030, expanding at a 6.52% CAGR during 2025-2030. Fast-growing demand for automated, resource-efficient packaging lines is reinforced by corporate sustainability targets, stricter food-safety rules, and the emergence of e-commerce–driven pack formats across developing economies. Flexible machinery platforms that run multiple pack sizes without lengthy changeovers are seeing strong uptake as brand owners proliferate SKUs, while AI-enabled inline inspection reduces rework and supports 24/7 operation. Lower overall material use and transport weight position lightweight rigid and flexible packs as attractive levers for carbon-reduction roadmaps. Regional investment patterns mirror food-processing capacity shifts: Asia-Pacific maintains the largest installed base, the Middle East accelerates fastest, and North America focuses on retrofit projects that add connectivity to legacy lines. Suppliers capable of bundling robotics, vision systems, and cloud analytics into a single turnkey offer gain a measurable pricing premium, raising competitive stakes for smaller specialist builders.
Key Report Takeaways
- By machine type, the filling systems segment captured 22.74% of the food and beverage packaging machinery market share in 2024.
- By automation level, the food and beverage packaging machinery market size for semi-automatic equipment is projected to grow at a 7.93% CAGR between 2025–2030.
- By packaging type, the rigid formats segment captured 39.73% of the food and beverage packaging machinery market share in 2024.
- By application, the food and beverage packaging machinery market size for meat, poultry, and seafood lines is projected to grow at an 8.61% CAGR between 2025–2030.
- By geography, the food and beverage packaging machinery market size for Middle East is projected to grow at a 9.07% CAGR between 2025–2030.
Global Food And Beverage Packaging Machinery Market Trends and Insights
Drivers Impact Analysis*
| Driver | (~) % Impact on CAGR Forecast | Geographic Relevance | Impact Timeline |
|---|---|---|---|
| Sustainable mono-material packs | +1.2% | Global, early in EU and North America | Medium term (2-4 years) |
| Ready-to-eat demand in emerging Asia | +1.8% | APAC core, spill-over to MEA | Long term (≥ 4 years) |
| Beverage lightweighting programs | +0.9% | Global, key bottling hubs | Short term (≤ 2 years) |
| Post-pandemic SKU proliferation | +1.1% | North America and EU, rising in APAC | Medium term (2-4 years) |
| AI-enabled inline inspection | +0.8% | Advanced manufacturing regions | Long term (≥ 4 years) |
| Aseptic lines for plant-based dairy | +0.7% | North America and EU, emerging APAC | Medium term (2-4 years) |
| Source: Mordor Intelligence | |||
Rapid shift to sustainable mono-material packs
Brand owners now insist on film and pouch structures that use only one polymer while still protecting moisture- and oxygen-sensitive foods. Equipment suppliers respond with purpose-built tension-control modules, gentler web handling, and advanced surface-coating stations so that single-polymer substrates run at commercial speeds without delamination. Unilever’s pledge to remove “problematic plastics” by 2025 raised global visibility and triggered a surge in machinery retrofit requests for snack and confectionery lines. In 2024 European OEMs logged 30% more RFQs for mono-material-ready systems, pushing them to scale barrier-coating R&D efforts rapidly. Under the EU Packaging and Packaging Waste Regulation, non-compliant composite films face escalating fees, so multinational food groups standardize globally on new substrates that cut through regulatory complexity. The resulting capex cycle drives a noticeable share of forecast growth as processors prioritize pack redesign ahead of legislative deadlines.
Rising demand for ready-to-eat formats in emerging Asia
Accelerating urban migration in India, Vietnam, and Indonesia fuels on-the-go consumption, forcing local processors to install filling, MAP, and pouch lines that deliver shelf-stable, portion-controlled meals. India’s ready-to-eat category expanded 23% in 2024, supported by Food Safety and Standards Authority of India guidelines that spotlight hygienic design and traceability as gating criteria for plant approvals.[1]Food Safety and Standards Authority of India, “Annual Report 2024,” fssai.gov.in Foreign direct investment, notably USD 2.1 billion into Vietnam’s processed-food segment last year, steers spending toward high-speed yet configurable equipment capable of small pack runs. Semi-automatic units gain favor because they permit incremental automation while conserving capital, an attractive proposition for regional firms still developing in-house engineering resources. ISO 22000 certification emerges as the ticket to export markets, aligning local buyers with suppliers who already embed sanitary design, clean-in-place, and electronic batch recording in base models.
AI-enabled inline inspection lowering total cost of quality
Vision cameras coupled with machine-learning algorithms now spot seal voids, mislabeled fronts, or under-fills at 99.7% accuracy, surpassing manual inspection and halving labor costs for large beverage plants. Tetra Pak pilots cut false-reject levels by 40% in 2024, translating into significant material savings and reduced rework cycles. The continuous data stream also feeds predictive analytics that flag nozzle drift or heater-bar wear hours before defects occur. These gains resonate in pharmaceuticals and infant-nutrition applications where FDA validation protocols now explicitly reference AI model governance, giving early adopters regulatory clarity. Suppliers keen to lock in aftermarket revenue bundle cloud dashboards, remote diagnostics, and subscription analytics, adding a recurring element to traditional one-off equipment sales.
Food-safety driven investment in aseptic lines for plant-based dairy
Shelf-stable oat, almond, and pea drinks require ultra-clean filling environments to avoid flavor-destroying heat treatments. Oatly committed EUR 200 million (USD 226 million) toward European aseptic capacity in 2024, reflecting capex needed to satisfy global demand for ambient cartons. SIG Combibloc reported 60% more plant-based customer inquiries the same year, confirming a broader swing toward high-acid aseptic technology that maintains protein functionality. EFSA’s evolving guidelines on novel-food packaging mandate rigorous barrier validation, tilting preference toward suppliers with proven sterilization sequences. Integrating aseptic cells with robotic secondary-pack stations further reduces contamination risk and elevates throughput, making them the preferred future-proof option despite higher upfront cost.
Restraints Impact Analysis*
| Restraint | (~) % Impact on CAGR Forecast | Geographic Relevance | Impact Timeline |
|---|---|---|---|
| Obsolescence risk during Industry 4.0 shift | −1.3% | Global, legacy plants in mature regions | Long term (≥ 4 years) |
| Shortage of skilled maintenance technicians | −0.9% | Global, acute in U.S., EU, Japan | Medium term (2-4 years) |
| Stainless steel and aluminum price volatility | −0.6% | Global, supply-chain-linked fluctuations | Short term (≤ 2 years) |
| Single-use plastic restrictions in EU and NA | −0.4% | EU and select North American jurisdictions | Medium term (2-4 years) |
| Source: Mordor Intelligence | |||
High installed-base obsolescence risk amid Industry 4.0 transition
Most installed packaging lines date back more than a decade and lack OPC-UA connectivity, edge-computing capacity, and cybersecurity safeguards needed for predictive maintenance or remote optimization. Retrofit kits that bolt on sensors and gateways exist but often cost 60% of a new machine, pushing CFOs to delay upgrades and accept lower OEE. German OEMs now bundle modular IoT sleeves, yet mechanical integration constraints limit functionality when compared with new-build digital natives. As competitive benchmarks increasingly emphasize data-driven efficiency, plants running legacy kit lose mix-flexibility and energy-tracking transparency, eroding profit margins over time.
Scarcity of qualified maintenance technicians
The Association for Packaging and Processing Technologies projects that 40% of today’s technicians will retire by 2032, while vocational programs cannot replenish the pipeline fast enough.[2]PMMI, “Workforce Development Report 2024,” pmmi.org For a high-speed beverage filler, every hour of unplanned downtime can cost USD 50,000, making talent shortages a board-level risk. Suppliers counter with virtual-reality training and augmented-reality service apps, but physical presence remains indispensable for pneumatic cylinder rebuilds, servo-drive swaps, and calibration. Plants in rural areas struggle most because travel time inflates service costs and extends mean-time-to-repair. The shortage nudges processors toward semi-automatic systems that demand less advanced troubleshooting, but it simultaneously slows adoption of complex fully automatic lines, dampening near-term demand growth.
*Our forecasts treat driver/restraint impacts as directional, not additive. The impact forecasts reflect baseline growth, mix effects, and variable interactions.
Segment Analysis
By Machine Type: Filling Systems Anchor Core Operations
Filling equipment accounted for 22.74% of the food and beverage packaging machinery market share in 2024, underscoring its centrality to both liquid and viscous product categories. Volume-metering accuracy, cleanability, and quick-change nozzle clusters drive purchase decisions where line speed and hygiene dictate product integrity. The food and beverage packaging machinery market size attached to form-fill-seal platforms is forecast to expand at an 8.64% CAGR, outpacing other machine types because integrated forming, dosing, and sealing compress footprint and labor needs.
Filling line upgrades dominate capex pipelines for beverages, dairy, and nutraceutical dose packs that must meet FDA’s High Hygiene Zone specifications. Conversely, cartoning and palletizing systems attract investment where e-commerce formats require repeatable case integrity to survive lengthy parcel networks. Sustainability imperatives force redesign of filling valves to handle lightweight PET or recycled content; suppliers with proprietary low-pressure gravity fillers command higher margins. Over the forecast horizon, hybrid fillers that process both dairy and plant-based variants without allergen cross-contact are expected to influence buyer shortlists.


By Automation Level: Semi-Automatic Systems Gain Momentum
Fully automatic units represented 56.32% of total revenue in 2024, cementing their role in high-output beverage, dairy, and confectionery operations. Yet semi-automatic equipment is on course for a 7.93% CAGR, the highest among automation tiers, because it offers cost-effective throughput gains for mid-scale processors. Where utility prices escalate, compact semi-automatic fillers or sealers minimize idle energy draw while still cutting manual touchpoints by half.
Emerging markets view semi-automatic systems as training wheels toward full digitization, and their flexible coding architecture allows phased sensor additions that align with technician skill sets. Industry 4.0 modules debut first on fully automatic lines, but scaled-down monitoring temperature, vacuum, torque now trickles into semi-automatic ranges, creating a gradual, lower-risk path to data-rich operations. Rising labor scarcity accelerates adoption even in mature geographies as manufacturers seek to redeploy scarce staff toward higher-skill QA tasks rather than repetitive pack handling.
By Packaging Type: Flexible Solutions Accelerate
Rigid formats still controlled 39.73% of 2024 revenue, largely through glass bottles, metal cans, and HDPE containers used in carbonated drinks, sauces, and shelf-stable dairy. In contrast, flexible packs from stand-up pouches to multi-layer films are forecast to climb at an 8.47% CAGR, reflecting a decisive shift toward formats that minimize distribution weight and extend ambient shelf life with fewer resources. Processors embrace mono-material PE or PP films equipped with plasma-deposited barrier layers that safeguard aroma while meeting recyclability benchmarks.
Investment in horizontal form-fill-seal units intensifies as the machines accommodate zipper, spout, and laser-score features that align with portion-control convenience trends. Regulatory drivers also favor flexible, as EFSA’s updated migration limits for can coatings raise compliance burdens for metal packaging, prompting beverage marketers to reconsider sleeved PET or laminated cartons. Over the outlook period, hybrid lines that seamlessly switch between rigid and flexible formats could command premium placements, especially in co-packing facilities.

By Application: Protein Processing Leads Growth
Beverage lines delivered 42.67% share of the food and beverage packaging machinery market size in 2024 thanks to high-volume soda, water, and juice portfolios. Meat, poultry, and seafood packaging, however, will chart the steepest 8.61% CAGR, propelled by rising protein intake in Asia and cold-chain build-outs that enable fresh or minimally processed offerings. Shrink-film flow-wrappers integrated with gas-flushing modules gain popularity because they extend refrigerated shelf life without chemical preservatives.
Processors place sanitary design front and center, mandating sloped surfaces, open profiles, and tool-free disassembly to comply with HACCP and export inspection protocols. Plant-based protein, although smaller in absolute volume, commands disproportionate attention as aseptic fillers and Tetra Recart systems receive development funding to secure global distribution without chillers. Over time, investments in high-oxygen barrier films and vacuum skin pack machinery capable of premium shelf presentation should expand margins in protein categories.
Geography Analysis
Asia-Pacific accounted for 34.78% of global revenue in 2024 on the back of China’s massive beverage bottling infrastructure and India’s surging packaged-food adoption. Regional processors accelerate capex for machines that balance high throughput with small lot flexibility, reflecting consumer appetite for product variety. Investments also lean toward energy-efficient drives and servo-controlled motion platforms to curb utilities costs, a pressing issue in power-price-sensitive Southeast Asian markets.
The Middle East is projected as the quickest mover, poised for a 9.07% CAGR through 2030 as governments diversify economies away from hydrocarbons and channel sovereign funds into food-security megaprojects. Gulf Cooperation Council plants integrate halal certification monitoring directly into packaging execution systems to secure regional trade privileges. Local bottled-water majors swap legacy gravity fillers for microbiological barrier-enhanced counter-pressure units, an upgrade needed to satisfy expanding export markets in Africa and South Asia.
North America shows incremental growth, characterized by retrofit programs that add AI vision, cobot palletizers, and material-saving bottle-design software to existing lines rather than wholesale capacity expansions. U.S. brands prioritize compliance with single-use plastic directives emerging at state levels, nudging them toward recycled-content-ready machines. Europe remains a sustainability trendsetter, funneling EU Recovery Fund grants toward circular-economy upgrades that accommodate mono-material flexible films and lightweight glass jars.[3]European Food Safety Authority, “Guidance on Food Contact Materials,” efsa.europa.eu


Competitive Landscape
Global market concentration is moderate, with the top five players controlling roughly 35% of revenue, leaving ample space for regional specialists to flourish. European heavyweights such as Krones, Tetra Pak, and Syntegon continue to leverage scale, proprietary IP, and installed-base service contracts, but they face margin pressure from nimble Asian entrants offering tailored machines at lower price points. 2024 saw a flurry of bolt-on acquisitions as incumbents sought digital capabilities vision analytics, IIoT platforms to complement mechanical portfolios.
Strategic collaboration centers on AI-driven quality control, low-carbon material handling, and Industry 4.0-native architectures that collapse line-control silos. Intellectual property filings increasingly cluster around barrier-coating chemistries and deep-learning defect classifiers, reflecting competition’s pivot from mechanics to software and materials science. Retrofit packages marketed by mid-tier firms carve out niche revenue by extending the useful life of legacy lines until full replacement budgets materialize, yet customers weigh retrofit costs against potential future obsolescence.
Customer purchasing criteria now extend beyond machine uptime to include cybersecurity maturity, service-response times, and verified carbon-footprint reductions. Vendors providing unified solutions primary, secondary, and end-of-line equipment matched with MES connectivity win longer-term, multi-plant framework deals. Meanwhile, co-packers seeking contract manufacturing flexibility stimulate demand for modular machines that can be redeployed rapidly when SKUs shift.
Food And Beverage Packaging Machinery Industry Leaders
Krones AG
Tetra Pak International S.A.
Syntegon Technology GmbH
SIG Combibloc Group AG
Coesia S.p.A.
- *Disclaimer: Major Players sorted in no particular order

Recent Industry Developments
- October 2025: Krones allocated EUR 150 million (USD 169.5 million) for an AI-centric packaging line R&D hub in Germany, targeting predictive maintenance and advanced quality control.
- September 2025: Tetra Pak acquired a specialist aseptic-technology company for USD 280 million, broadening its offer for plant-based dairy lines.
- August 2025: Syntegon secured a USD 95 million contract to supply Indian pharmaceutical packagers with compliant high-speed lines.
- July 2025: SIG Combibloc unveiled next-gen mono-material barrier coatings that maintain food-grade performance while meeting recyclability standards.


Global Food And Beverage Packaging Machinery Market Report Scope
| Filling Machines |
| Form-Fill-Seal (FFS) Machines |
| Sealing Machines |
| Wrapping Machines |
| Cartoning and Case Packing Systems |
| Palletizing Machines |
| Other Machine Types |
| Manual |
| Semi Automatic |
| Fully Automatic |
| Rigid Packaging |
| Flexible Packaging |
| Dairy Products |
| Bakery products |
| Confectionery |
| Meat, poultry, and seafood |
| Fruits and vegetables |
| Other Applications |
| North America | United States | |
| Canada | ||
| Mexico | ||
| South America | Brazil | |
| Argentina | ||
| Chile | ||
| Rest of South America | ||
| Europe | United Kingdom | |
| Germany | ||
| France | ||
| Italy | ||
| Spain | ||
| Russia | ||
| Rest of Europe | ||
| Asia-Pacific | China | |
| India | ||
| Japan | ||
| South Korea | ||
| Australia | ||
| Rest of Asia-Pacific | ||
| Middle East and Africa | Middle East | Saudi Arabia |
| United Arab Emirates | ||
| Turkey | ||
| Rest of Middle East | ||
| Africa | South Africa | |
| Nigeria | ||
| Rest of Africa | ||
| By Machine Type | Filling Machines | ||
| Form-Fill-Seal (FFS) Machines | |||
| Sealing Machines | |||
| Wrapping Machines | |||
| Cartoning and Case Packing Systems | |||
| Palletizing Machines | |||
| Other Machine Types | |||
| By Automation Level | Manual | ||
| Semi Automatic | |||
| Fully Automatic | |||
| By Packaging Type | Rigid Packaging | ||
| Flexible Packaging | |||
| By Application | Dairy Products | ||
| Bakery products | |||
| Confectionery | |||
| Meat, poultry, and seafood | |||
| Fruits and vegetables | |||
| Other Applications | |||
| By Geography | North America | United States | |
| Canada | |||
| Mexico | |||
| South America | Brazil | ||
| Argentina | |||
| Chile | |||
| Rest of South America | |||
| Europe | United Kingdom | ||
| Germany | |||
| France | |||
| Italy | |||
| Spain | |||
| Russia | |||
| Rest of Europe | |||
| Asia-Pacific | China | ||
| India | |||
| Japan | |||
| South Korea | |||
| Australia | |||
| Rest of Asia-Pacific | |||
| Middle East and Africa | Middle East | Saudi Arabia | |
| United Arab Emirates | |||
| Turkey | |||
| Rest of Middle East | |||
| Africa | South Africa | ||
| Nigeria | |||
| Rest of Africa | |||


Key Questions Answered in the Report
How large is the food and beverage packaging machinery market in 2025?
The food and beverage packaging machinery market size stands at USD 21.67 billion in 2025, with a 6.52% CAGR projected through 2030.
Which machine type captures the biggest revenue share?
Filling systems lead with 22.74% share, reflecting their central role in beverage, dairy, and liquid food production.
Which geographic region is growing fastest?
The Middle East is forecast to register a 9.07% CAGR during 2025-2030 thanks to food-security investments and economic diversification.
Why are semi-automatic machines gaining traction?
They deliver meaningful labor savings and throughput gains at lower capital cost, appealing to mid-tier processors in emerging markets.
How does AI improve packaging-line performance?
AI-enabled vision systems cut false rejects by up to 40%, boost defect-detection accuracy to 99.7%, and feed predictive maintenance analytics that reduce downtime.
Page last updated on:


