Reusable Beverage Packaging Market Size and Share
Market Overview
| Study Period | 2019 - 2030 |
|---|---|
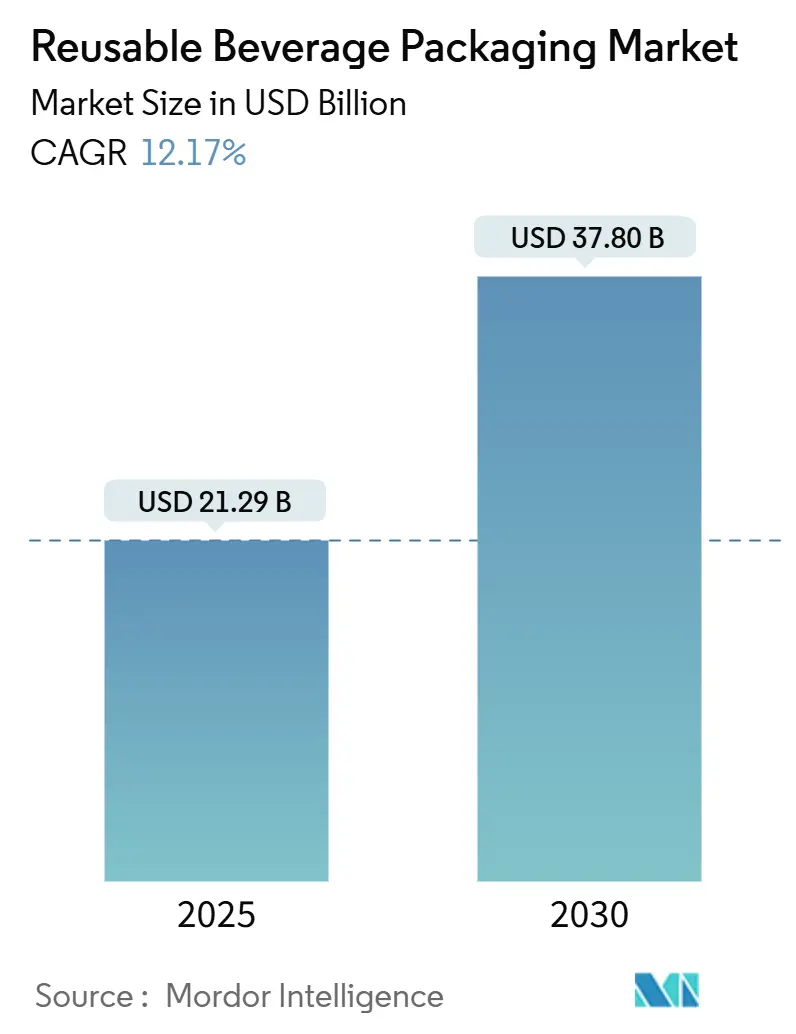
| Market Size (2025) | USD 21.29 Billion |
| Market Size (2030) | USD 37.80 Billion |
| Growth Rate (2025 - 2030) | 12.17% CAGR |
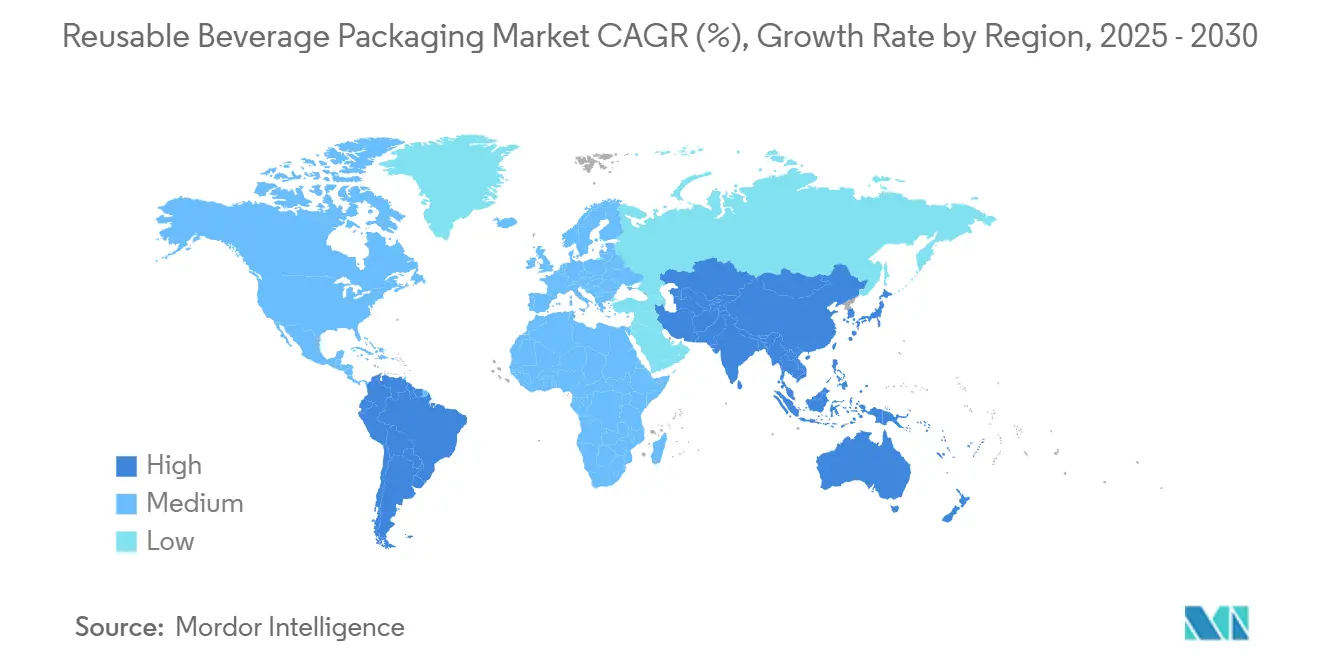
| Fastest Growing Market | Asia Pacific |
| Largest Market | Europe |
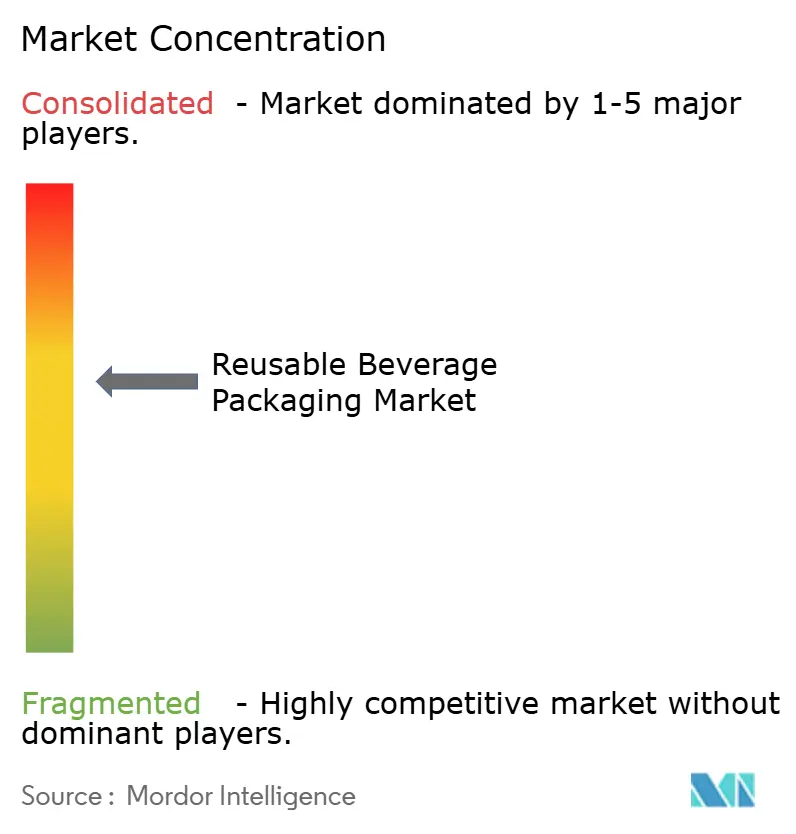
| Market Concentration | Medium |
Major Players
*Disclaimer: Major Players sorted in no particular order Image © Mordor Intelligence. Reuse requires attribution under CC BY 4.0. |
|
Reusable Beverage Packaging Market Analysis by Mordor Intelligence
The reusable beverage packaging market size is estimated at USD 21.29 billion in 2025 and is projected to reach USD 37.8 billion by 2030, representing a 12.17% CAGR. Robust growth springs from intersecting regulatory mandates that penalize single-use plastics, corporate net-zero commitments that elevate Scope 3 emissions reductions, and return-rate economics that achieve cost parity when reuse exceeds 60%. Corporate pilots that previously tested single outlets now scale across national chains, while technology-enabled tracking pushes shrinkage below 3%, making the business case increasingly compelling.[1]European Commission, “Packaging and Packaging Waste Regulation Implementation Guidelines,” ec.europa.eu Venture funding, which quadrupled between 2023 and 2024, is accelerating the development of automated washing capacity and regional logistics hubs, further catalyzing the expansion of the reusable beverage packaging market.
Key Report Takeaways
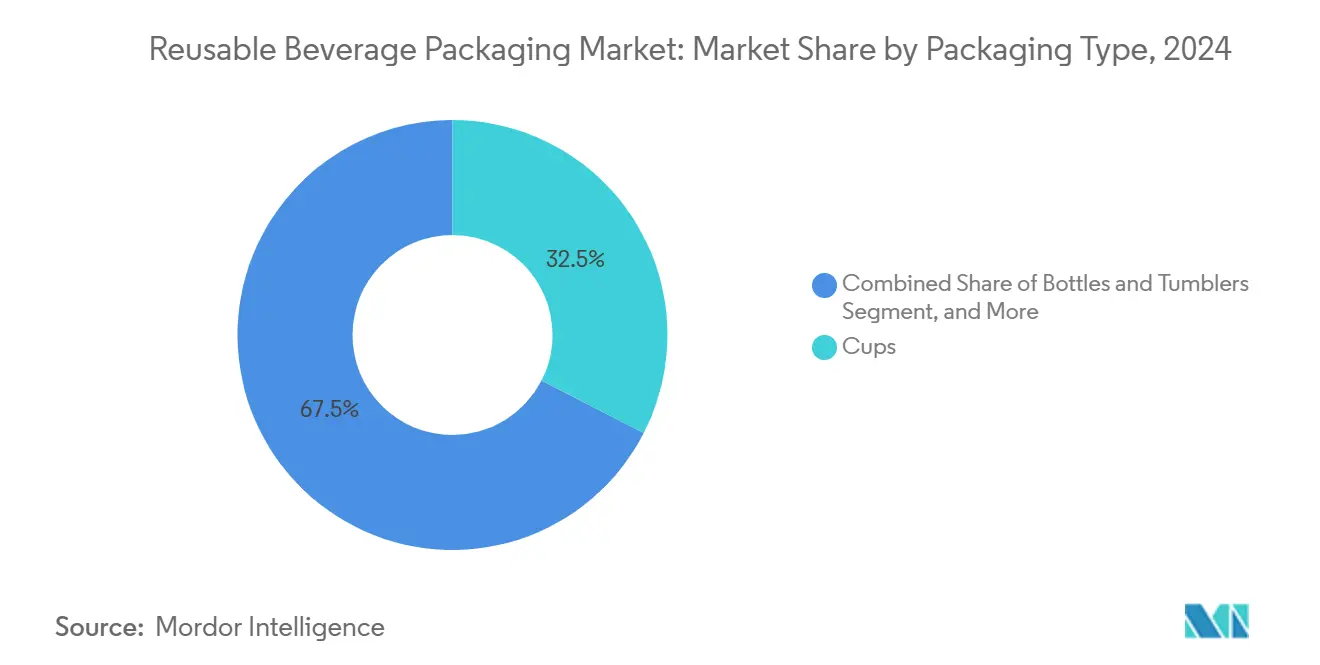
- By packaging type, the Reusable Beverage Packaging Market size for bottles and tumblers is projected to grow at a 14.56% CAGR between 2025–2030.
- By material, the plastics segment captured 41.63% of the Reusable Beverage Packaging Market size in 2024.
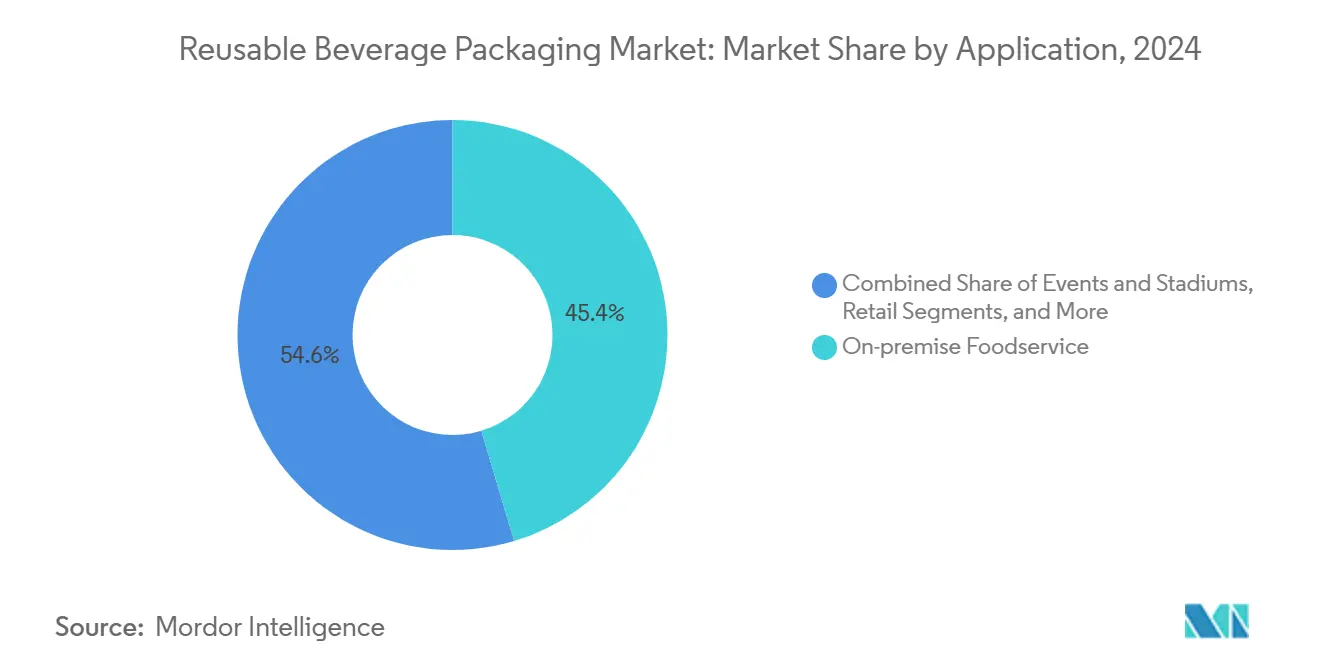
- By application, the Reusable Beverage Packaging Market size for on-premise foodservice captured 45.37% of the market share in 2024.
- By geography, the Europe segment captured 33.17% of the Reusable Beverage Packaging Market share in 2024.
Global Reusable Beverage Packaging Market Trends and Insights
Drivers Impact Analysis*
| Driver | (~) % Impact on CAGR Forecast | Geographic Relevance | Impact Timeline |
|---|---|---|---|
| Declining single-use-plastics regulations | +2.8% | Europe and North America, expanding to APAC | Medium term (2-4 years) |
| Corporate net-zero and ESG commitments | +2.1% | Global, with a concentration in developed markets | Long term (≥ 4 years) |
| Cost-parity of reuse at ≥60% return rates | +1.9% | Global, varying by operational efficiency | Short term (≤ 2 years) |
| Brand-led closed-loop pilots scaling nationally | +1.4% | North America and Europe, selective APAC markets | Medium term (2-4 years) |
| City-wide default-reusable cup mandates | +1.2% | Urban centers globally, led by European cities | Short term (≤ 2 years) |
| Smart-tracking lowering shrinkage to <3% | +0.9% | Technology-advanced markets, expanding globally | Medium term (2-4 years) |
| Source: Mordor Intelligence | |||
Declining single-use plastics regulations
The European Union’s Packaging and Packaging Waste Regulation mandates a 10% reuse rate for beverage containers by 2030 and a 25% reuse rate by 2040, embedding extended producer responsibility fees that internalize lifecycle costs. France’s 2024 deposit return system produced 85% return rates in Paris and Lyon, providing a proof point for other member states. Harmonized rules encourage multinationals to standardize packaging across regions, which in turn ripples through supply chains in North America and the Asia-Pacific. Municipalities such as Berlin and Amsterdam are requiring the use of reusable cups at public events, thereby accelerating infrastructure investment. As similar rules appear in Canada and South Korea, regulatory pull continues to raise the floor for the reusable beverage packaging market.
Corporate net-zero and ESG commitments
Reusable containers deliver 60-80% lower lifecycle emissions compared to disposables, making them integral to achieving Scope 3 reductions. Fortune 500 boards now tie executive bonuses to circular packaging targets, while sustainability-linked loans cut interest rates when reuse milestones are met. Starbucks piloted nationwide reusable cup programs that reached 23% participation in 2024, triggering copycat initiatives among competing chains. ESG-focused funds injected USD 2.3 billion into reuse ventures in 2024, creating capital momentum that underpins technology upgrades. The institutionalization of reuse metrics within annual reports keeps the reusable beverage packaging market on executive dashboards across multiple sectors.
Cost parity of reuse at ≥60% return rates
Automated washing reduces per-unit processing costs from USD 0.15 to USD 0.08 once monthly volumes exceed 100,000 items, while RFID reduces labor costs by 25-30%. In Europe, mature logistics networks enable cups to break even at a 65% return rate, while bottles and tumblers reach parity at 55% due to their higher unit value. Markets with nascent infrastructure, including Brazil and India, need higher recovery to cover capex outlays, yet technology transfer is shortening payback cycles. Rapid urban growth clusters consumption, pushing collection density high enough for cost parity within two years in many metropolitan areas.
Brand-led closed-loop pilots scaling nationally
McDonald’s expanded reusable cups from 200 to 1,500 German restaurants after adoption surpassed 70%. Key success factors include staff training modules, deposit-return integration at the point of sale, and app-based return kiosks. Revenue-sharing partnerships between brands and specialist operators reduce upfront capex while keeping incentives aligned. Standardized washing protocols agreed upon by industry associations cut operating complexity, enabling faster rollout across new territories. The domino effect sees retailers, cinemas, and corporate campuses adopting similar models, reinforcing volume growth for the reusable beverage packaging market.
Restraints Impact Analysis*
| Restraint | (~) % Impact on CAGR Forecast | Geographic Relevance | Impact Timeline |
|---|---|---|---|
| Fragmented hygiene-washing infrastructure | -1.8% | Global, acute in developing markets | Medium term (2-4 years) |
| High CAPEX for automated reverse-logistics hubs | -1.5% | Capital-intensive markets, regional variations | Long term (≥ 4 years) |
| Consumer inconvenience vs. disposables | -1.2% | Consumer-facing applications globally | Short term (≤ 2 years) |
| Regulatory mismatch on cross-border deposits | -0.7% | International trade corridors, border regions | Medium term (2-4 years) |
| Source: Mordor Intelligence | |||
Fragmented hygiene-washing infrastructure
Metropolitan washing plants often run at 90% capacity during peak dining hours, creating bottlenecks that risk service lapses. Divergent health department rules complicate equipment standardization, forcing operators to maintain parallel cleaning lines for separate jurisdictions. Building a full-coverage city network can exceed USD 50 million, a threshold only well-capitalized incumbents clear. Mobile washing trailers help mitigate gaps but require local permits, which add 12-18 months to deployment timelines. Until integrated facilities are established, uneven capacity will temper the velocity of the reusable beverage packaging market.[2]Food and Drug Administration, “Guidance for Industry: Reusable Food Contact Articles,” fda.gov
High CAPEX for automated reverse-logistics hubs
Regional hubs covering cities with populations exceeding 2 million residents require USD 15–25 million for automated sorting, robotic handling, and industrial washers. Payback spans 5–7 years and requires a throughput of 500,000 units per month. Hub spacing of 50–75 kilometers is essential for cost-efficient routing, yet acquiring urban land near transport arterials inflates capex. Shared third-party logistics can dilute investment, but coordination layers add complexity that some brands find prohibitive. The high capital hurdle may slow new entrants, nudging the reusable beverage packaging market toward gradual consolidation.
*Our forecasts treat driver/restraint impacts as directional, not additive. The impact forecasts reflect baseline growth, mix effects, and variable interactions.
Segment Analysis
By Packaging Type: Cups remain dominant while bottles and tumblers accelerate
Cups represented 32.54% of the reusable beverage packaging market size in 2024, anchored by standardized dimensions that simplify washing and stacking. Coffee chains, quick-service restaurants, and cinemas favor cups because broad consumer familiarity keeps training costs low. RFID-embedded cup designs command premiums of up to 20% yet shrink loss rates enough to pay back within eight use cycles. Interoperability standards adopted among German, French, and Dutch operators enable the pooling of assets, thereby boosting utilization without increasing inventories.
Bottles and tumblers are projected to display a 14.56% CAGR through 2030, broadening their applications from foodservice to retail shelf-ready beverages and corporate giveaways. Higher unit value supports premium materials such as stainless steel and coated aluminum, which extend life cycles beyond 500 uses. Retail adoption introduces barcode scanning for purchase and RFID for return, blending existing checkout systems with reuse loops. Corporate offices bundle tumblers with branded loyalty apps that track workstation hydration, enhancing employee wellness programs. This cross-vertical expansion highlights how the reusable beverage packaging market can transition from niche quick-service channels into mainstream retail and corporate markets.


By Material Type: Plastics hold share but steel innovation gains momentum
Plastics accounted for 41.63% of the reusable beverage packaging market size in 2024, thanks to their speed in injection molding, color versatility, and low material costs. Bio-based polypropylene blends and chemically recycled PET now meet the ISO 14855 biodegradability criteria, addressing regulatory pressure while maintaining performance. Injection molders retrofit tooling to handle these new resins without major downtime, keeping unit economics attractive.
Stainless steel enjoys a 13.96% CAGR driven by upscale coffee chains and corporate gifting buyers that prize thermal retention and brand cachet. Although initial prices are triple those of plastic, durability offsets cost over extended life cycles. Powder-coated finishing resists scratches and maintains the containers' visual appeal through hundreds of dishwashing cycles, thereby elevating user satisfaction. Hybrid designs, such as plastic cores treated with vapor-deposited metal films, provide brands a middle ground that balances insulation with lightweight properties, thereby widening material options for the reusable beverage packaging market.
By Application: Events and stadiums outpace mature foodservice use cases
On-premise foodservice held a 45.37% market share of reusable beverage packaging in 2024, leveraging controlled environments that ensure near-perfect return rates at cash registers or table drop points. Integrated conveyor-dishwasher lines maintain continuous flow, dropping turnaround time to under 40 minutes. Staff familiarity accelerates customer onboarding, while visible sustainability branding reinforces loyalty.
Events and stadiums post a 13.59% CAGR as venue operators roll out mandatory cup returns bonded to ticket terms. Concentrated service windows permit batch cleaning during matches or concerts, maximizing washer utilization. Digital deposits tied to mobile tickets provide frictionless refunds, which help lift return rates above 90%. Partnerships with sponsors subsidize capex in exchange for logo placement, making stadium programs profitable quickly. Success in flagship arenas cascades to regional festivals, sports leagues, and convention centers, broadening situational use cases for the reusable beverage packaging market.
Geography Analysis
Europe retained a 33.17% global share in 2024, as PPWR targets compelled investment in reverse logistics networks and harmonized hygiene protocols. Germany lists over 3,000 quick-service outlets on reusable cup platforms, and France achieves an 87% return rate under its national deposit system. Dense rail and road grids keep transportation costs low, allowing operators to interconnect washing hubs across borders. Cultural acceptance of reusable habits trims marketing spend and accelerates adoption curves.
The Asia-Pacific region posts the swiftest growth rate of 14.42% from 2020 to 2030. China’s National Development and Reform Commission earmarked CNY 15 billion (USD 2.1 billion) for circular packaging infrastructure in 2024, jump-starting metropolitan washing capacity. Japan’s Corporate Governance Code mandates packaging disclosure, encouraging listed companies to adopt reuse pilots. South Korea embeds reusable cup thresholds within its K-New Deal, while Australia pushes retailer compliance under National Packaging Targets. Smartphone penetration fuels app-based deposit systems that marry user convenience with real-time inventory data, energizing the reusable beverage packaging market across megacities from Shanghai to Sydney.
North America progresses steadily, propelled by municipal bans on Styrofoam and corporate pledges to cut single-use plastics. Venture investors poured USD 800 million into reuse startups in 2024, channeling funds toward robotic sorters and AI-based demand forecasting. However, differing state regulations mean operators must juggle multiple deposit values and labeling standards, raising administrative overhead. Canada’s nation-wide single-use plastics prohibition narrows disparity, and Mexico’s inclusion in USMCA fosters cross-border standard alignment. Consumers demonstrate willingness to pay 10–15 cent premiums for reuse, sustaining value growth even as infrastructure matures.

Competitive Landscape
The reusable beverage packaging market exhibits moderate fragmentation, with the top five players holding a combined share of roughly 35%. TerraCycle’s Loop platform focuses on metropolitan megahubs capable of processing 2 million items per month, leveraging RFID and IoT to reduce shrinkage to below 3%. Muuse scales a distributed model using city-center microhubs and predicts demand using machine-learning algorithms that dynamically route collections. Vytal emphasizes material innovation, having recently achieved ISO 14855 certification for bio-based containers that facilitate composting at the end of their life.
Strategic playbooks emphasize technology integration over price wars. Operators deploy handheld scanners, customer-facing mobile apps, and API-based logistics dashboards that sync with retailer inventory systems. Patent filings surged 45% year-over-year, covering lid-seal mechanisms, antimicrobial coatings, and auto-stacking crate designs.[3]World Intellectual Property Organization, “Global Patent Landscape Report: Sustainable Packaging Technologies,” wipo.int Partnerships proliferate: quick-service brands outsource reuse loops rather than build in-house, while logistics firms co-locate washing lines inside fulfillment centers. Investment gravitas flows to companies capable of providing full-stack solutions, including packaging design, collection, cleaning, and redeployment, thereby cementing barriers for pure-play container suppliers.
Regional specialists remain formidable. Central European operators exploit cross-border truck lanes for economies of scale, Latin American firms tailor low-cost plastic designs to local price sensitivity, and Southeast Asian providers focus on high tech integrations that attract corporate campuses. As regulatory timelines tighten and capital intensity rises, mid-tier players face make-or-merge decisions, signaling gradual consolidation of the reusable beverage packaging market.
Reusable Beverage Packaging Industry Leaders
-
Muuse Pte Ltd
-
TerraCycle US Inc
-
Again Again Ltd
-
Circolution GmbH
-
reCIRCLE AG
- *Disclaimer: Major Players sorted in no particular order

Recent Industry Developments
- October 2024: TerraCycle announced a USD 50 million expansion of Loop across 15 new metropolitan markets.
- September 2024: Muuse closed a USD 25 million Series B to enhance RFID technology and enter additional Southeast Asian cities.
- August 2024: Starbucks partnered with reCIRCLE to launch reusable cup schemes in 500 stores across Switzerland and Austria, achieving a 78% customer uptake rate.
- July 2024: The European Union adopted standardized hygiene protocols for reusable beverage containers, cutting cross-border compliance costs.


Global Reusable Beverage Packaging Market Report Scope
| Cups |
| Bottles and Tumblers |
| Kegs and Barrels |
| Other Packaging Types |
| Glass |
| Stainless Steel |
| Aluminum |
| Plastics |
| Other Material Types |
| On-premise Foodservice |
| Take-away Foodservice |
| Retail |
| Corporate and Institutional Offices |
| Events and Stadiums |
| Other Applications |
| North America | United States | |
| Canada | ||
| Mexico | ||
| South America | Brazil | |
| Argentina | ||
| Chile | ||
| Rest of South America | ||
| Europe | United Kingdom | |
| Germany | ||
| France | ||
| Italy | ||
| Spain | ||
| Russia | ||
| Rest of Europe | ||
| Asia-Pacific | China | |
| India | ||
| Japan | ||
| South Korea | ||
| Australia | ||
| Rest of Asia-Pacific | ||
| Middle East and Africa | Middle East | Saudi Arabia |
| United Arab Emirates | ||
| Turkey | ||
| Rest of Middle East | ||
| Africa | South Africa | |
| Nigeria | ||
| Rest of Africa | ||
| By Packaging Type | Cups | ||
| Bottles and Tumblers | |||
| Kegs and Barrels | |||
| Other Packaging Types | |||
| By Material Type | Glass | ||
| Stainless Steel | |||
| Aluminum | |||
| Plastics | |||
| Other Material Types | |||
| By Application | On-premise Foodservice | ||
| Take-away Foodservice | |||
| Retail | |||
| Corporate and Institutional Offices | |||
| Events and Stadiums | |||
| Other Applications | |||
| By Geography | North America | United States | |
| Canada | |||
| Mexico | |||
| South America | Brazil | ||
| Argentina | |||
| Chile | |||
| Rest of South America | |||
| Europe | United Kingdom | ||
| Germany | |||
| France | |||
| Italy | |||
| Spain | |||
| Russia | |||
| Rest of Europe | |||
| Asia-Pacific | China | ||
| India | |||
| Japan | |||
| South Korea | |||
| Australia | |||
| Rest of Asia-Pacific | |||
| Middle East and Africa | Middle East | Saudi Arabia | |
| United Arab Emirates | |||
| Turkey | |||
| Rest of Middle East | |||
| Africa | South Africa | ||
| Nigeria | |||
| Rest of Africa | |||


Key Questions Answered in the Report
What is the current value of the reusable beverage packaging market?
The reusable beverage packaging market size is USD 21.29 billion in 2025.
What is the market's expected growth rate through 2030?
It is forecast to expand at a 12.17% CAGR, reaching USD 37.8 billion by 2030.
Which region is expanding fastest in reusable beverage packaging?
Asia-Pacific is advancing at a 14.42% CAGR due to circular economic policies and rapid urbanization.
Which packaging type commands the largest share?
Cups account for 32.54% of the market share due to their widespread use in foodservice.
Why are stainless steel containers gaining popularity?
Stainless steel offers superior thermal performance and durability, driving a 13.96% CAGR within the material segment.
What is the biggest operational hurdle for market participants?
Fragmented hygiene-washing infrastructure remains the largest restraint, reducing the potential CAGR by 1.8%.
Page last updated on:


