Market Overview
| Study Period | 2020 - 2031 |
|---|---|
| Forecast Data Period | 2026 - 2031 |
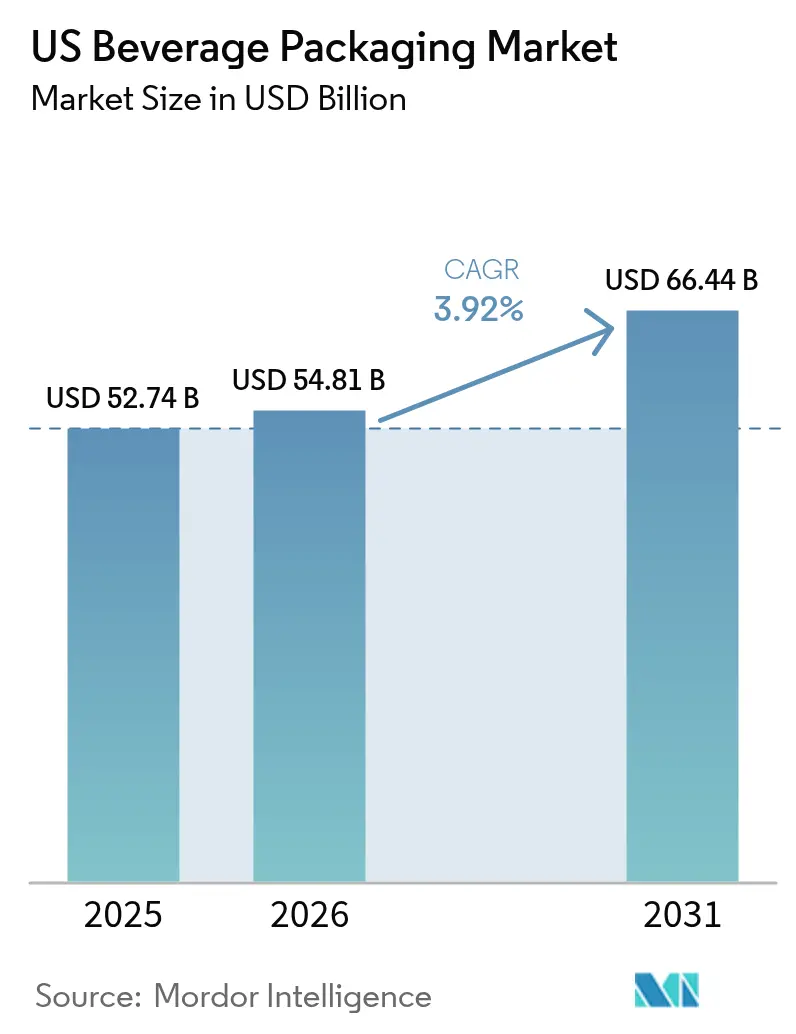
| Base Year Market Size (2025) | USD 52.74 Billion |
| Market Size (2026) | USD 54.81 Billion |
| Market Size (2031) | USD 66.44 Billion |
| Growth Rate (2026 - 2031) | 3.92% CAGR |
| Market Concentration | Medium |
Major Players *Disclaimer: Major Players sorted in no particular order Image © Mordor Intelligence. Reuse requires attribution under CC BY 4.0. | |
US Beverage Packaging Market Analysis by Mordor Intelligence
The US beverage packaging market size is expected to grow from USD 52.74 billion in 2025 to USD 54.81 billion in 2026 and is forecast to reach USD 66.44 billion by 2031 at 3.92% CAGR over 2026-2031. Steady value growth is underpinned by aluminum-centric strategies that align with tightening sustainability regulations, rising recycled-content mandates, and consumer preference for easily recyclable formats. Brand owners increasingly treat packaging as a cost-effective lever for carbon-reduction targets, fostering demand for lightweight metal containers and high-barrier flexible films. Supplier price actions—such as Ball Corporation’s January 2025 surcharge on 12-ounce cans—and minimum-order hikes continue to reshape cost curves for craft producers, widening the gap between large and small beverage companies. Parallel expansion of ready-to-drink (RTD) coffee, energy, and functional beverages is accelerating the migration from multilayer plastic bottles toward aluminum cans and slim bottles with premium graphics. Finally, e-commerce growth is nudging the design of “ship-in-own-container” formats that eliminate secondary corrugate, reduce breakage, and create new premiumization avenues.
Key Report Takeaways
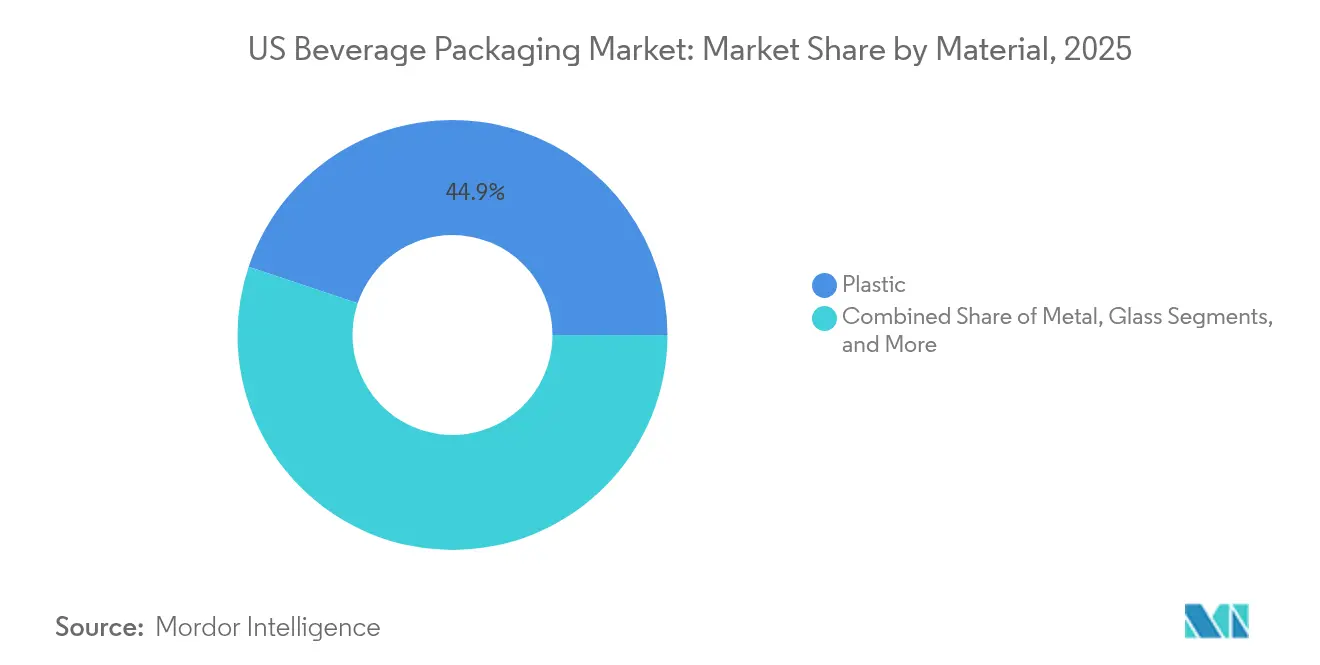
- By material, plastic maintained leadership with 44.85% of the US beverage packaging market share in 2025, while metal driven by aluminum recorded the fastest expansion at a 5.92% CAGR through 2031.
- By product type, bottle formats held 27.25% revenue share in 2025; cans are forecast to grow at a 6.78% CAGR and overtake bottles in incremental value by 2031.
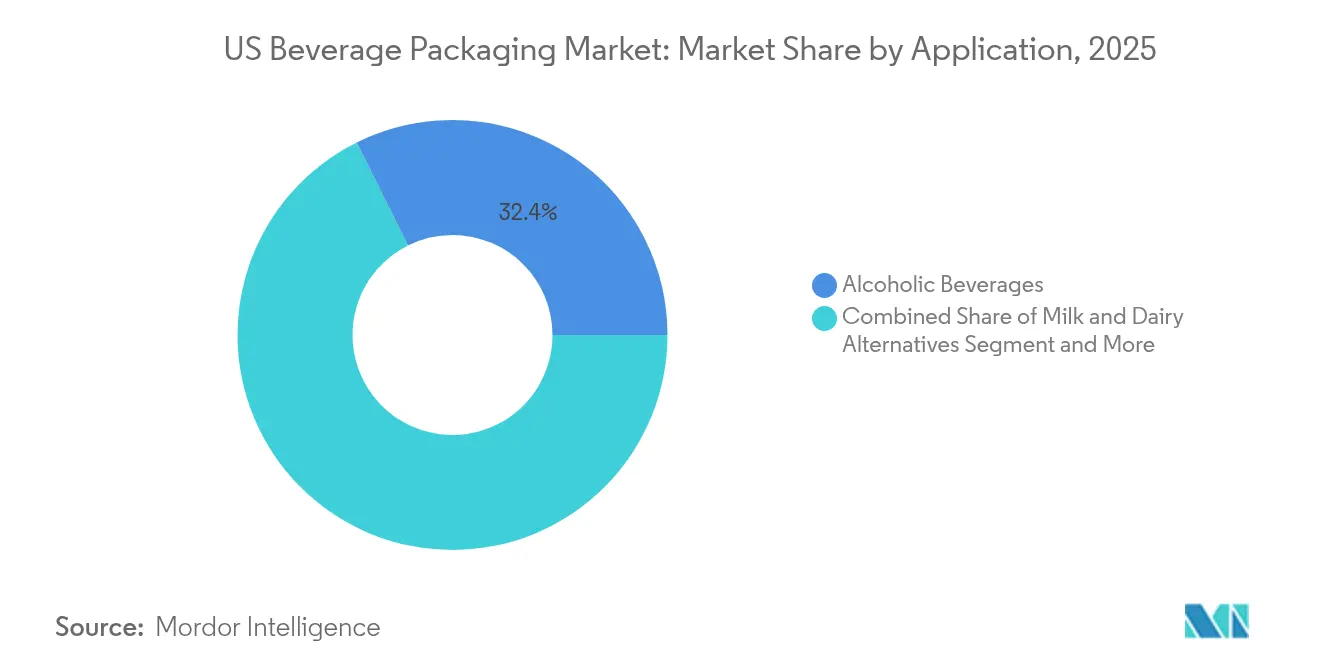
- By application, alcoholic beverages led with 32.35% share of the US beverage packaging market size in 2025; energy and functional drinks are advancing at a 5.18% CAGR to 2031.
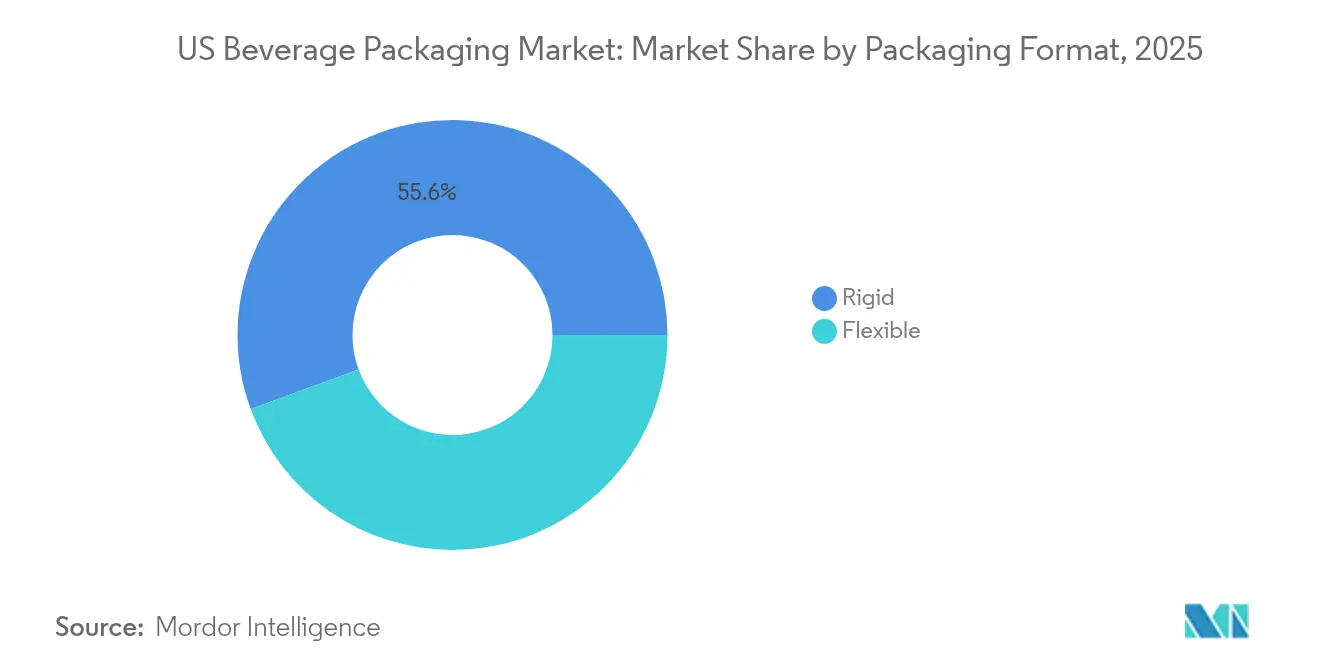
- By packaging format, rigid formats commanded 55.60% share in 2025, whereas flexible packaging is projected to post a 5.62% CAGR through 2031, the highest among all formats.
Note: Market size and forecast figures in this report are generated using Mordor Intelligence’s proprietary estimation framework, updated with the latest available data and insights as of 2026.
US Beverage Packaging Market Trends and Insights
Drivers Impact Analysis*
| Driver | (~) % Impact on CAGR Forecast | Geographic Relevance | Impact Timeline |
|---|---|---|---|
| Sustainability-driven lightweighting and rPET mandates | +1.2% | California, Northeast states expanding nationally | Medium term (2-4 years) |
| Surge in RTD coffee/energy drink launches | +0.8% | National, concentrated in urban markets | Short term (≤ 2 years) |
| Craft beer's switch to aluminum cans | +0.6% | National, strongest in Pacific Northwest, Northeast | Medium term (2-4 years) |
| Premium positioning through aluminum's recyclability credentials | +0.5% | National, strongest in urban and affluent markets | Medium term (2-4 years) |
| E-commerce–tailored "ship-in-own-container" formats | +0.4% | National, led by direct-to-consumer brands | Long term (≥ 4 years) |
| Tethered-cap rule (CFR Title 21 update) spurring redesigns | +0.3% | Federal mandate with state-level implementation | Short term (≤ 2 years) |
| Source: Mordor Intelligence | |||
Sustainability-driven lightweighting and rPET mandates
California’s AB 793 set a 15% recycled-content floor for PET beverage containers in 2022 that rises to 50% by 2030, providing a blueprint that New York, New Jersey, and Massachusetts lawmakers are actively considering.[1]California Department of Resources Recycling and Recovery, “AB 793 Compliance Guide,” calrecycle.ca.gov Recycled PET carries 15–25% cost premiums over virgin resin, compelling brands to invest in lightweighting that reduces polymer usage by 8–12% per container. PepsiCo’s 100% rPET shift on select water lines trimmed carbon emissions by 31% while retaining shelf integrity. Compliance-driven line retrofits add USD 0.03–0.08 per unit in logistics and processing overhead, yet brands are capturing 5–8% price lifts by marketing lower-carbon packaging.
Surge in RTD coffee and energy drink launches
RTD energy beverages now account for 37% of convenience-store RTD sales, up from 28% in 2020, and nearly every major launch uses aluminum formats.[2]Monster Beverage Corp., “Form 10-K 2025,” monsterbevcorp.com Monster Beverage derives 97% of its global volume from aluminum containers, enabling USD 7.1 billion in 2025 net sales while offsetting commodity inflation through premium pricing. Aluminum’s light- and oxygen-barrier attributes help maintain coffee aromatics and functional ingredient stability, extending shelf life without chilled distribution and lowering cold-chain costs by up to 30%. New RTD coffee stock-keeping units (SKUs) rose 73% from 2018–2023, and 60% of those used cans because of flavor preservation and decoration versatility.
Craft beer’s switch to aluminum cans
Can usage among US craft breweries jumped from 41% to 60% of packaged volume between 2017 and 2021. Aluminum’s 45% recycling rate yields material credits, while its lighter weight cuts freight outlays by USD 0.15–0.25 per case relative to glass.[3]Alpine Packaging, “Cost Savings with Aluminum Cans,” alpinepackaging.comThe trend accelerated after Ball Corporation pushed minimum orders from 204,000 to 1,020,000 cans, compelling small brewers to secure distributor intermediaries that add 15–20% to packaging expense. Digital printing can mitigate high minimums by enabling small runs with custom graphics at an extra USD 0.08–0.12 per can.
E-commerce-tailored “ship-in-own-container” formats
Direct-to-consumer (DTC) beverage revenue expansion prompted brands to rethink primary packages that double as shipping vessels. Corrugated prices climbed by USD 70 per ton in January 2025, spurring interest in secondary-material elimination. Milkadamia’s flat-pack oat-milk sheet cuts package waste by 94% and shipping mass by 85% BlueTriton’s 25-ounce aluminum bottle fetches a 25–35% premium over PET while resisting e-commerce handling damage. These formats address the USD 2.8 billion annual beverage damage cost in online channels and allow brands to bypass retail markups.
Restraints Impact Analysis*
| Restraint | (~) % Impact on CAGR Forecast | Geographic Relevance | Impact Timeline |
|---|---|---|---|
| Volatile virgin resin prices | -0.9% | National, acute in Gulf Coast production regions | Short term (≤ 2 years) |
| Glass furnace capacity rationalization | -0.7% | Midwest, Southeast manufacturing corridors | Medium term (2-4 years) |
| Deposit-return expansions raising compliance costs | -0.5% | 10 states with bottle bills, expanding to 15+ | Long term (≥ 4 years) |
| Recycled PET feedstock shortages | -0.4% | National, concentrated near recycling hubs | Medium term (2-4 years) |
| Source: Mordor Intelligence | |||
Volatile virgin resin prices
Monomer price swings—particularly ethylene and paraxylene—regularly reach 25–30 c/lb in Gulf Coast spot markets, destabilizing PET cost structures for bottled water and carbonated soft drink (CSD) producers. Forward hedging is limited, causing quarterly margin compression for small bottlers.
Glass furnace capacity rationalization
O-I Glass shuttered six North American furnaces in late 2024, removing 4% of global container-glass capacity and recording USD 81 million in restructuring charges. Lower utilization raises unit costs, constraining price competitiveness against aluminum and high-barrier cartons.
*Our forecasts treat driver/restraint impacts as directional, not additive. The impact forecasts reflect baseline growth, mix effects, and variable interactions.
Segment Analysis
By Material: Aluminum Gains Ground Through Premium Positioning
Plastic kept the largest share at 44.85% in 2025, yet metal packaging is projected to post a 5.92% CAGR, the fastest among all materials. The US beverage packaging market size for metal containers is forecast to exceed USD 29.15 billion by 2031, reflecting consumer preference for infinitely recyclable formats and regulatory credit for higher post-consumer recycled (PCR) content. Aluminum’s barrier properties guard flavor volatility in energy drinks and RTD coffee, supporting premium shelf pricing that offsets higher unit costs.
Ball Corporation targets 90% recycling rates and 85% recycled content by 2030, creating a closed-loop narrative that resonates with retailers pursuing Scope 3 emission cuts. Glass faces headwinds from furnace closures and energy-intensive melting, while paperboard cartons gain momentum through 97% renewable Elopak Pure-Pak structures that reach cost parity with PET at high volume. Recycled PET shortages still restrain plastic penetration despite aggressive lightweighting that cuts polymer content by up to 15%.


By Product Type: Cans Accelerate Past Traditional Bottles
Bottles commanded 27.25% of the US beverage packaging market in 2025; however, cans are pacing at a 6.78% CAGR, driven by portability, refrigeration efficiency, and customizable printing. Cans’ stackable geometry yields 20–25% freight savings over glass bottles, encouraging conversion among craft beer, flavored seltzer, and vitamin-enriched water producers.
Over 70% of 2025 beverage launches are in cans compared with 45% five years earlier, according to Can Manufacturers Institute data. Digital-print technology accelerates SKU proliferation by shrinking lead times from weeks to days, vital for limited edition RTD coffee collaborations. Bottle innovation centers on lightweight refillable PET and glass, while pouches and cartons appeal to niche use cases such as children’s beverages or aseptic dairy alternatives.
By Application: Energy Drinks Drive Aluminum Adoption
Alcoholic beverages held 32.35% share in 2025, while energy and functional drinks are expanding fastest at a 5.18% CAGR through 2031. The US beverage packaging market share for energy drinks now exceeds 12% and continues to climb with new entrants leveraging bold aluminum graphics to reinforce functionality cues.
Monster Beverage relies on aluminum for 97% of its packaging, enabling 8–12% price lifts on zero-sugar variants without volume loss. Dairy alternatives increasingly employ paperboard or flat-pack flexible films that trim package weight by up to 85%, supporting DTC subscription channels. Carbonated soft drinks maintain steady PET demand, though emerging tethered-cap rules add USD 0.02–0.05 per unit in conversion costs.
By Packaging Format: Flexible Gains Through Innovation
Rigid formats retained 55.60% share in 2025, benefitting from aluminum cans’ dominant position. Yet flexible packaging is forecast to rise at 5.62% CAGR, propelled by barrier-film advancements and rPET laminate rollouts. Flexible stand-up pouches slash transportation emissions by 30–40% versus glass jars, appealing to health-conscious, on-the-go consumers.
Milkadamia’s flat-pack beverage sheet exemplifies how flexible design can cut packaging waste by 94% while unlocking postal delivery economics. Rigid containers remain indispensable for carbonation retention and premium tactile appeal, so brands now adopt hybrid strategies rigid primary with flexible secondary or vice versa to meet channel requirements and sustainability targets.
Geography Analysis
The US beverage packaging market reveals pronounced regional contrasts in regulatory rigor, recycling infrastructure, and manufacturing footprints. California’s AB 793 established the nation’s most stringent PCR mandates, and its influence is spreading as northeastern legislatures debate similar bills. Southeastern states host large-scale PET resin and aluminum can sheet production, yet these hubs also face higher hurricane-related disruption risk, prompting contingency sourcing.
Ball Corporation’s 2025 acquisition of Florida Can Manufacturing added two billion-unit capacity to serve Southeast bottlers while trimming finished-goods freight costs by an estimated 18%. In the Pacific Northwest and Northeast where craft beer densities are highest can penetration already exceeds 65%, far above the national average of 54%. Meanwhile, glass-heavy Midwest beverage corridors grapple with furnace rationalization, prompting beer and kombucha producers to sign multiyear aluminum supply agreements to guarantee availability.
Bottle-bill states such as Michigan, Oregon, and Maine record redemption rates above 85%, benefitting local PCR supply loops and lowering input costs for can-sheet rolling mills. Urban consumers display greater willingness to pay for sustainable packaging, enabling tiered pricing models that offset compliance outlays. Conversely, rural markets emphasize affordability and convenience, stimulating ongoing demand for lightweight PET bottles in large multipacks despite their lower recycling value.
Regulatory Landscape
US beverage packaging is governed by federal food-contact controls and state circular-economy rules. The US Food and Drug Administration (FDA) regulates food-contact substances through the Food Contact Notification (FCN) process, including pathways relevant to recycled plastics. It has also taken a more restrictive stance on certain chemistries used in packaging, including PFAS in food-contact applications (finalized restrictions in February 2024).
Recycled-content mandates are shaping material choices alongside food-contact compliance, led by California AB 793, which set a PET recycled-content floor beginning in 2022 and steps it up through 2030. At the state level, extended producer responsibility (EPR) is a key compliance driver for beverage brands and packaging suppliers. California finalized SB 54 regulations on May 1, 2026, with producer registration required by June 1, 2026, expanding reporting, fee, and design-for-recyclability obligations that influence packaging specifications and supplier qualification. Cost inputs remain sensitive to trade policy as well, since Section 232 tariff adjustments effective April 2026 maintained a 50% tariff rate on aluminum, steel, and copper goods and 25% on certain derivative products, affecting can, end, and sheet economics for domestic beverage packaging.
Competitive Landscape
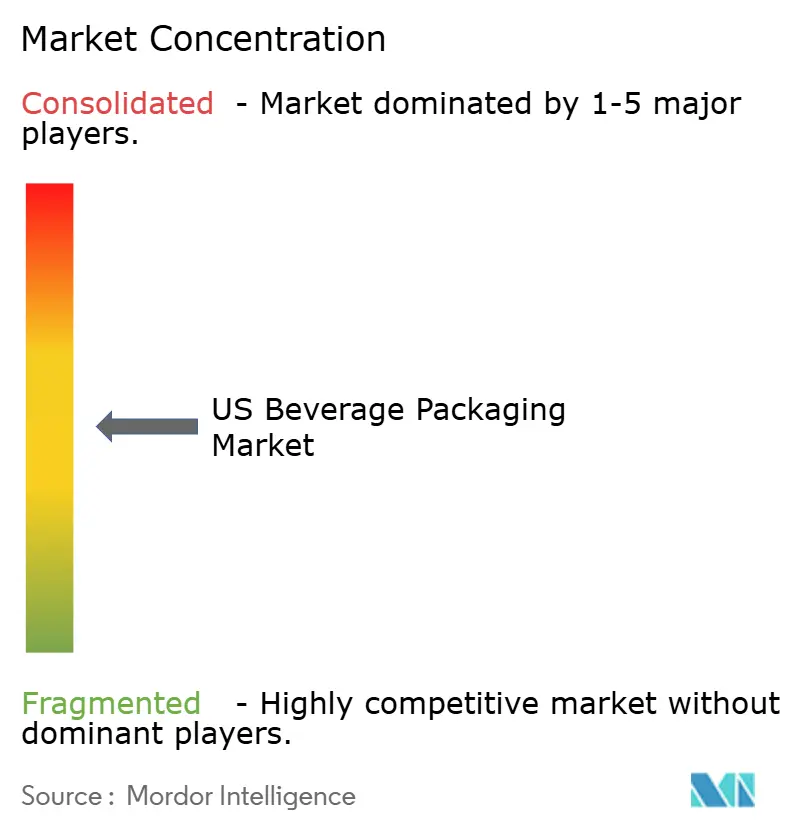
The US beverage packaging market features moderate consolidation anchored by three aluminum titans—Ball Corporation, Crown Holdings, and Ardagh Group. Together they control more than 70% of domestic beverage can output, giving them leverage over pricing, lead times, and minimum-order structures. Ball’s Florida and slated Oregon plants broaden its network, improving regional proximity while tempering freight emissions. Crown leverages global reach and proprietary Acculight can-body technology to deliver 17% segment income growth in Q1 2025.
Ardagh Group trimmed underperforming glass capacity in 2024 but expanded its Ohio can line to ease tightness during peak summer beverage season. Smaller metal-pack players, such as Arnest Packaging, are entering with USD 100 million-plus greenfield investments, yet will rely on long-term offtake contracts to secure can-sheet supply.
Competitive intensity extends to sustainability features: Ball markets 70% average recycled content cans; Crown pilots 100% PCR models for limited editions; Ardagh collaborates with BlueTriton to debut lighter, refillable aluminum bottles. Digital printing partnerships with breweries and functional-drink startups proliferate, helping incumbents tap higher-margin short-run business while protecting share from nimble newcomers.
US Beverage Packaging Industry Leaders
Owens-Illinois Inc.
Ball Corporation
Crown Holdings Inc.
Silgan Containers LLC
Berry Global Inc.
- *Disclaimer: Major Players sorted in no particular order

Market Opportunities and Future Outlook
Investment activity around beverage production and packaging-adjacent capacity points to gaps in onshore supply for fast-growing ready-to-drink categories and premium rigid formats. In March 2026, Chobani announced a USD 567 million multi-phase expansion of the La Colombe plant in Norton Shores, Michigan, increasing RTD coffee output and reinforcing demand for high-barrier, high-graphics packaging formats that protect aroma and functional ingredients. Contract packaging and canning infrastructure is also scaling, with DrinkPAK beginning construction in May 2026 on a large Philadelphia manufacturing facility (at least USD 195 million), which adds regional throughput for canned RTD beverages and tightens the link between can supply, decoration capability, and speed-to-market for new SKUs.
Premiumization and material diversification are creating openings for suppliers that can provide reliable domestic capacity and compliant recycled-content pathways. Glass is also seeing targeted reinvestment in the United States, including Stoelzle Glass USA committing USD 100 million to a Monaca, Pennsylvania expansion (May 2026) and Coca-Cola Consolidated committing USD 35 million to a new glass bottle line in Indianapolis (announced May 2026, with construction slated for late 2026), supporting spirits and selected non-alcoholic segments that favor glass aesthetics. At the same time, the mechanical PET recycling base has faced capacity loss (nearly a quarter over roughly 15 months ahead of April 2026), which increases the value of secured rPET supply, lightweighting programs, and alternative recyclable formats such as aluminum cans and cartons for brands operating under state recycled-content mandates.
Recent Industry Developments
- May 2026: Owens-Brockway Glass Container Inc. priced a private offering of USD 500 million in 9.500% senior notes due 2033. The transaction improved funding flexibility for a capital-intensive glass network as furnace rationalization and cost pressure are reshaping container-glass availability and pricing dynamics in the United States.
- February 2025: Ball Corporation acquired Florida Can Manufacturing, adding about two billion cans of annual capacity. The acquisition expanded the regional supply footprint in the Southeast, improving lead times and logistics economics for beverage brands that are shifting more volume into aluminum formats.
- September 2024: Elopak expanded its Arkansas carton plant with a USD 25 million second line to double output by mid-2025. The additional aseptic carton capacity supported beverage producers seeking renewable-content packaging options and tighter domestic supply for shelf-stable products.


Research Methodology Framework and Report Scope
Market Definition and Coverage
For this study, the US beverage packaging market covers the value of packaging used to pack beverages sold in the United States across major formats and materials, counted at the packaging level in USD.
Scope exclusions: We exclude packaging used purely for non-beverage end uses, along with machinery, filling equipment, and broader logistics services.
Segmentation Overview
- By Material
- Plastic
- Metal
- Glass
- Paperboard
- By Product Type
- Bottles
- Cans
- Pouches
- Cartons
- Beer Kegs
- By Application
- Alcoholic Beverages
- Milk and Dairy Alternatives
- Energy and Functional Drinks
- Carbonated Soft Drinks and Water
- Other Beverages
- By Packaging Format
- Rigid
- Flexible
Data Sources, Market Sizing, and Validation
Desk Research
Desk research sets the factual base for the model by linking packaging demand to beverage consumption and pack mix shifts in the United States. We reviewed public sources such as the US Census Bureau (manufacturing and shipments signals), US International Trade Commission trade statistics, the US Environmental Protection Agency for recycling and waste context, and USDA data points where dairy and related beverages influence pack formats.
In parallel, we used company filings, investor presentations, packaging association websites, and reputed press coverage to understand capacity additions, recycled-content claims, and packaging format priorities across cans, bottles, cartons, and pouches. A paid subscription for company financials and a separate subscription for patent databases were used selectively to cross-check revenue exposure and innovation direction, especially around lightweighting and barrier improvements. The desk sources listed here are illustrative only, and many other public references were also used for collection, validation, and clarification.
Primary Interviews and Surveys
Primary work focused on validating the packaging mix and pricing logic behind the model through expert interviews and structured surveys with packaging converters, material suppliers, beverage brand and co-packing contacts, and channel participants. Feedback was collected across the United States so regional consumption differences and on-the-go versus at-home pack formats could be reflected, and then used to confirm secondary signals, close data gaps, and triangulate final assumptions.
Distribution of primary research fieldwork respondents
| Company type | Respondent position | Region |
|---|---|---|
| Top tier: 27% | CXOs: 13% | |
| Mid tier: 59% | Functional/Unit leaders: 36% | |
| Smaller Players: 14% | Managers: 51% |
Market-Sizing & Forecasting
Sizing starts from a top-down build where beverage demand indicators and pack-type penetration are used to reconstruct the addressable packaging value pool by format and material, then roll it up to the total market. After the initial totals are built, we corroborate them using selective bottom-up approximations, such as sampled price per unit multiplied by estimated shipment volumes for key formats, followed by channel checks to keep values realistic.
Inputs used in the model include shifts in metal can adoption in carbonated soft drinks and water, PET versus glass mix in ready-to-drink and premium beverages, flexible packaging share changes for select categories, recycled-content and lightweighting related cost movements, and observable changes in beverage category volumes that move packaging units. Where direct value splits were not consistently available, gaps were handled through proxy ratios from interviews and cross-checked against company exposure statements and trade flow signals. For forecasting, scenario analysis was used with a base case supported by primary feedback, then stress-tested using expectations for packaging price movements and category-level volume outlooks to avoid over-reacting to one-time spikes.
Data Validation & Update Cycle
Outputs are validated through stepwise checks that compare calculated market totals against independent signals, such as format mix direction, material share stability, and implied per-capita packaging intensity. When large variances appear at the segment level, the assumptions are reviewed, the arithmetic is rechecked, and selected experts are re-contacted to confirm whether the change is structural or timing-related.
Before sign-off, the model goes through an internal multi-analyst review so that input logic, units, and currency handling are consistent across the study. The report is refreshed annually, and interim updates are made when a material event changes the market, such as a regulation shift, major capacity addition, or a sharp move in packaging input costs. Right before delivery, a final pass is completed so clients receive the most current view available.
Mordor Intelligence's US Beverage Packaging Market Size Versus Other Published Estimates
Published market sizes for US beverage packaging often vary because the boundary of what gets counted is not always the same, and the timing of price updates can also be different. Differences can also come from how each publisher treats packaging format splits and whether the estimate is anchored more on beverage volumes or on packaging supplier revenues.
Beverage category volume direction, format mix signals between cans and bottles, and cross-checks against packaging shipment and capacity narratives are the evidence points used to keep Mordor Intelligence's 2025 estimate tied to an observable demand pool instead of a broad revenue umbrella. The remaining gaps typically show up when an estimate folds in secondary packaging, uses a more aggressive pricing progression, or applies a different base year and currency timing for the same US scope.
Benchmark comparison
| Source | Market Size | Gaps in Research Methodology |
|---|---|---|
| Mordor Intelligence | USD 52.74 B (2025) | |
| Industry Publisher A | USD 45.70 B (2024) | Uses a 2024 base year and a different refresh point for packaging price levels, which can understate the value pool when material-driven price changes are captured later. It also appears to group format and material categories slightly differently, which shifts the total when mapped to cans, bottles, cartons, and pouches. |
| Research Outlet B | USD 37.97 B (2025) | Leans more toward a narrower revenue framing and a slower growth pathway, which can miss parts of the packaging spend that sit across multiple beverage applications and formats. The lower total also suggests tighter inclusion rules on which packaging types are counted within beverage packaging. |
Across the three values, the spread is mostly explained by base-year choice, how packaging price movement is carried into the current year, and whether the scope is closer to total packaging spend versus a narrower revenue view. By documenting the format and application coverage clearly and then checking it against demand and mix signals, the resulting market size stays traceable to repeatable inputs that can be revisited during each refresh.


Key Questions Answered in the Report
What is the current value of the US beverage packaging market?
The US beverage packaging market stands at USD 54.81 billion in 2026 and is projected to hit USD 66.44 billion by 2031 at a 3.92% CAGR.
Which material segment is growing fastest?
Metal packaging, primarily aluminum, is posting the quickest gains with a 5.92% CAGR through 2031.
Why are aluminum cans overtaking plastic bottles?
Aluminum offers superior recyclability, strong light-oxygen barriers, lower freight weight, and favorable consumer sustainability perceptions, driving a 6.78% CAGR for cans.
What impact do supply constraints have on craft brewers?
Minimum-order hikes by major can suppliers force smaller brewers into distributor contracts that raise packaging costs by 15–20%.
Page last updated on:


