Market Overview
| Study Period | 2020 - 2031 |
|---|---|
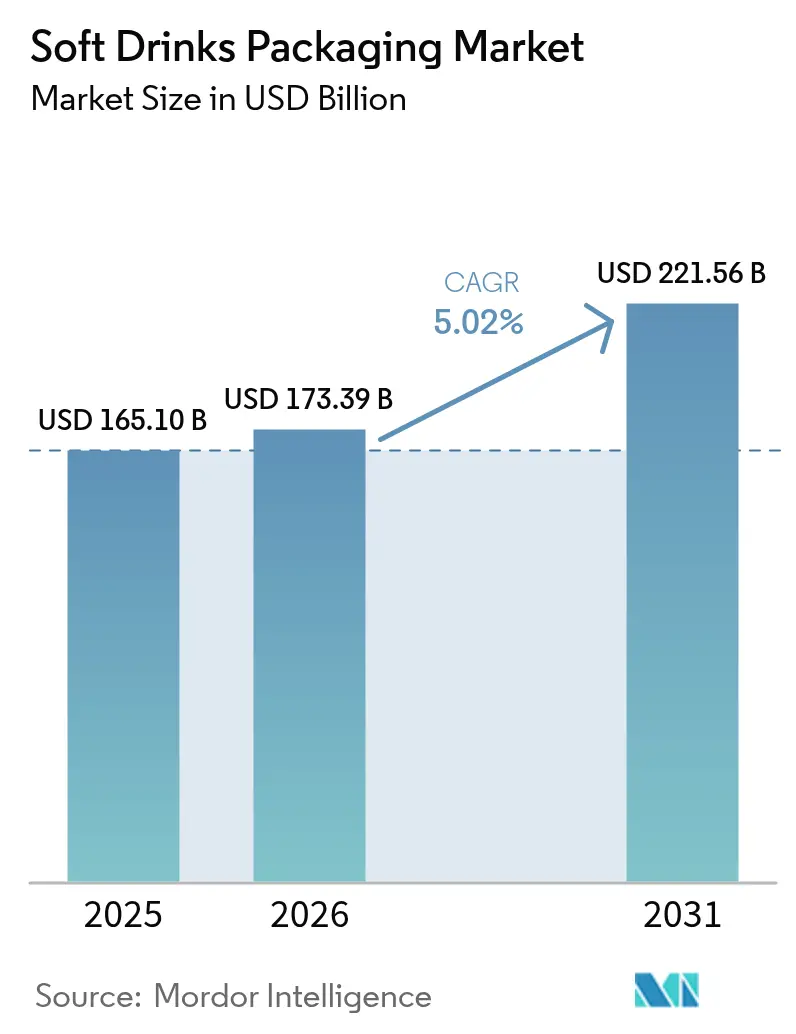
| Market Size (2026) | USD 173.39 Billion |
| Market Size (2031) | USD 221.56 Billion |
| Growth Rate (2026 - 2031) | 5.02% CAGR |
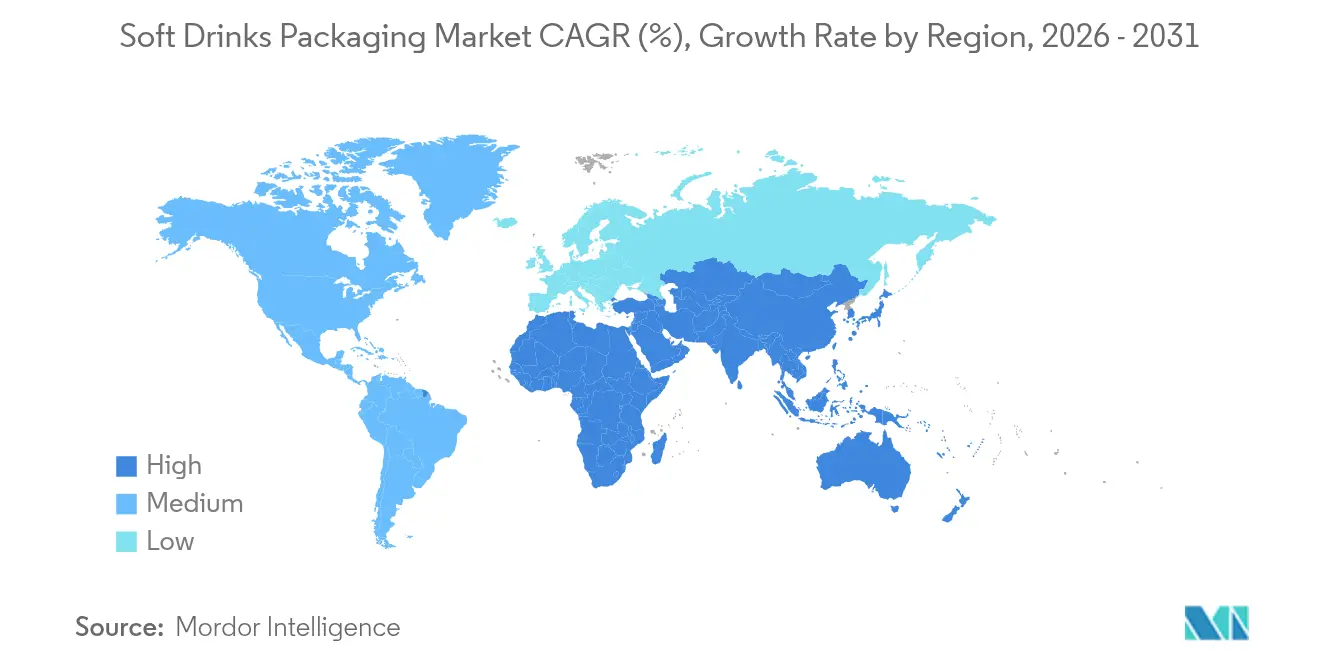
| Fastest Growing Market | Middle East |
| Largest Market | Asia Pacific |
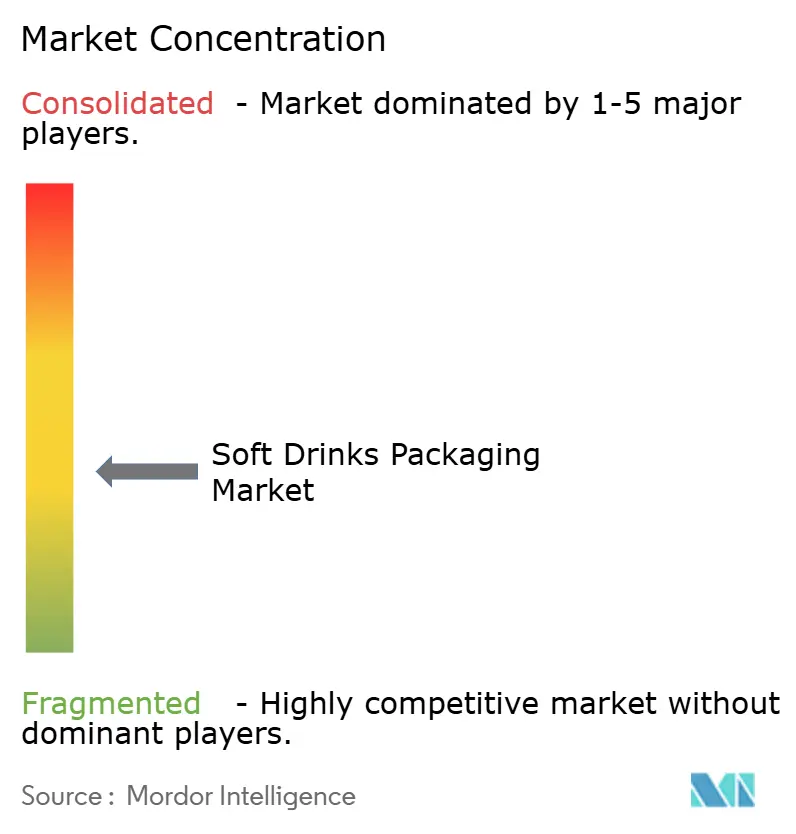
| Market Concentration | Medium |
Major Players *Disclaimer: Major Players sorted in no particular order Image © Mordor Intelligence. Reuse requires attribution under CC BY 4.0. | |
Soft Drinks Packaging Market Analysis by Mordor Intelligence
Soft drink packaging market size in 2026 is estimated at USD 173.39 billion, growing from 2025 value of USD 165.1 billion with 2031 projections showing USD 221.56 billion, growing at 5.02% CAGR over 2026-2031. Growth reflects rising regulatory demands for recyclability, accelerating brand investments in premium, connected packs, and rapid scale-up of chemical recycling assets. Stricter mandates—such as the European Union’s requirement for 30% recycled content in PET bottles by 2030—are forcing redesigns across formats while spurring rPET capacity expansion.[1]European Commission, “Regulation - EU - 2025/40 - EN,” eur-lex.europa.eu Brands are also pivoting toward lightweight bottles and bio-based polymers that lower carbon footprints, a shift intensified by Gen-Z preferences for portion-controlled, visually distinctive packs. Meanwhile, mergers such as the USD 8.4 billion Amcor–Berry Global deal highlight an industry racing to secure scale economies and innovation pipelines. Across regions, Asia-Pacific’s urbanizing middle class anchors demand, and the Middle East posts the fastest growth as governments court local beverage production.
Key Report Takeaways
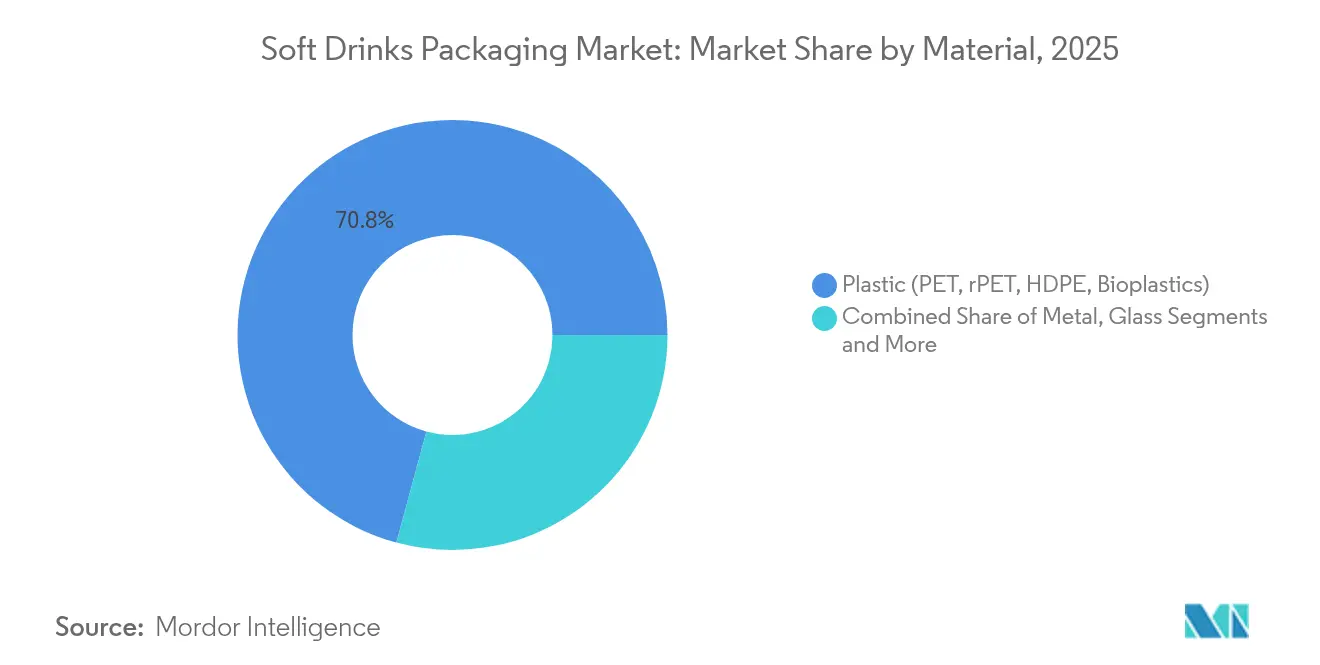
- By material, PET and rPET bottles led with 70.80% of the soft drink packaging market share in 2025, while bioplastics are forecast to expand at a 16.8% CAGR through 2031 Sulzer.
- By product type, bottles held 58.45% revenue in 2025, whereas slim aluminum cans under 250 ml are advancing at an 8.42% CAGR to 2031 Packaging World.
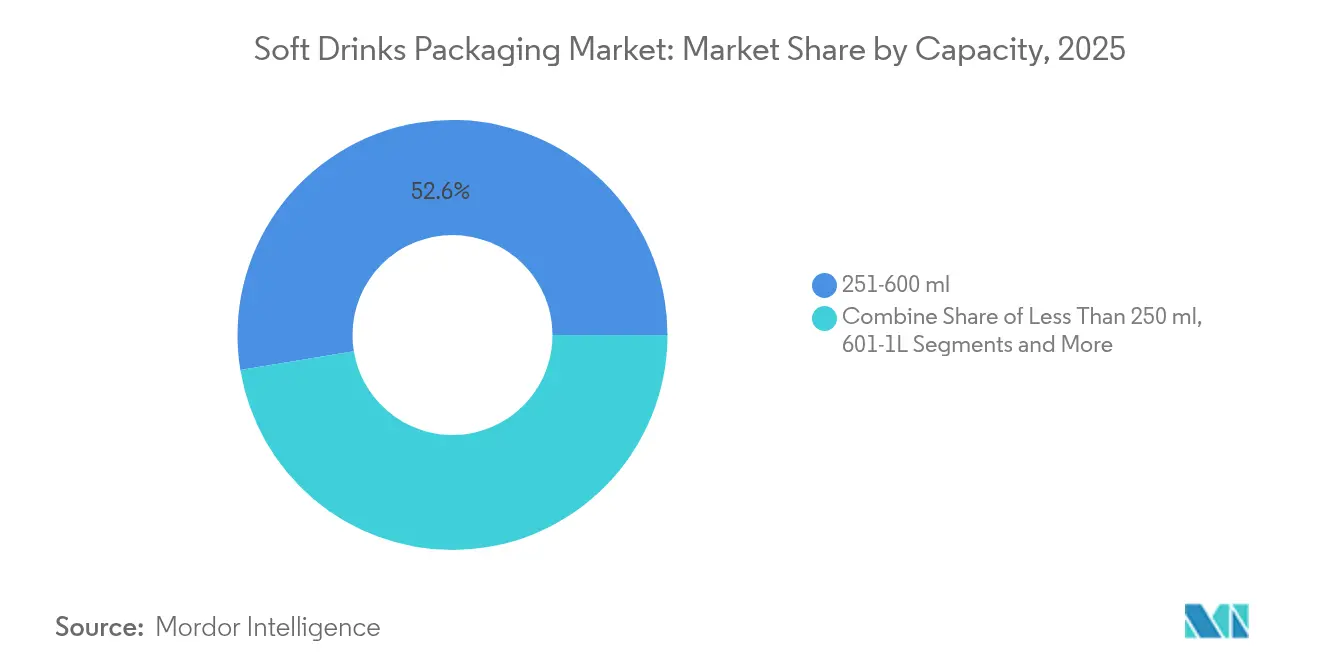
- By capacity, the 251–600 ml band accounted for 52.60% of the soft drink packaging market size in 2025; mini formats below 250 ml are recording a 9.05% CAGR Packaging World.
- By beverage category, carbonated soft drinks retained a 45.90% share of the soft drink packaging market size in 2025, while energy and functional drinks are growing at a 9.3% CAGR.
- By closure type, screw and sports caps captured 65.40% of 2025 sales, but smart, connected closures are forecast to climb at 11.9% CAGR Domino Printing Sciences.
- By geography, Asia-Pacific commanded 42.60% of 2025 revenue, and the Middle East is projected to post the highest 6.74% CAGR through 2031 Starlinger.
Note: Market size and forecast figures in this report are generated using Mordor Intelligence’s proprietary estimation framework, updated with the latest available data and insights as of 2026.
Global Soft Drinks Packaging Market Trends and Insights
Drivers Impact Analysis*
| Driver | (~) % Impact on CAGR Forecast | Geographic Relevance | Impact Timeline |
|---|---|---|---|
| Surge in PET bottle lightweighting & rPET integration | +1.2% | Global; APAC & Europe lead | Medium term (2–4 years) |
| Growth of “functional soda” SKUs demanding premium packs | +0.8% | North America & Europe; spreading to APAC | Short term (≤ 2 years) |
| On-the-go slim-can demand from Gen-Z consumers | +0.6% | Global cities; strongest in North America | Short term (≤ 2 years) |
| Bottle-to-bottle chemical recycling capacity build-out | +0.9% | Europe & North America; pilots in APAC | Long term (≥ 4 years) |
| AI-enabled design platforms shortening lead-times | +0.4% | Global, concentrated in developed markets | Medium term (2–4 years) |
| Carbon-negative PEF & PHA pilots reaching scale | +0.7% | Europe leads; North America follows | Long term (≥ 4 years) |
| Source: Mordor Intelligence | |||
Surge in PET bottle lightweighting and rPET integration
Regulatory targets and cost pressure are pushing converters to cut resin use, with some Japanese PET bottles now below 20 g—half the traditional weight.[2]Tomoyuki Ueda, “Trend of PET Bottle Resin Polymer in Japan,” Japan PET Bottle Association, petbottle-rec.gr.jp High collection rates—90% in Japan versus 75% in Europe—underpin closed-loop economics, while India’s Ganesha Ecopet is scaling to 42,000 t rPET to capture 25% of local bottle waste by 2026. Lightweighting trims material cost 15-20% and lowers freight emissions, but demands superior oxygen and CO₂ barriers to safeguard taste over shelf life.
Growth of “functional soda” SKUs demanding premium packs
Global functional beverage sales headed toward USD 198.1 billion by 2026 are forcing packs that signal health credentials and enable ingredient storytelling. Gen-Z already drives 38% of category expansion and values transparency, prompting PepsiCo to embed on-pack narratives that justify 20-30% higher packaging spend. Metal cans win favor for their light-blocking and superior gas barriers that protect active compounds without preservatives, sustaining shelf stability and delivering premium cues.
On-the-go slim-can demand from Gen-Z consumers
Slim cans under 250 ml are racing ahead at 8.9% CAGR, powered by social-media-friendly aesthetics and portion control aspirations.[3]Packaging World, “Gen Z’s Packaging Revolution,” packworld.com Surface treatments, tactile lacquers, and limited-edition graphics boost brand engagement while enabling 15-20% unit price premiums. Ball Corporation’s 9-oz aluminum cup taps the same impulse, supplying a recyclable avenue that sidelines single-use plastics.
Bottle-to-bottle chemical recycling capacity build-out
Mechanical recycling’s quality drop-off is prompting investment in depolymerization routes such as JEPLAN’s Rewind PET process, which enables infinite loops for food-grade resin. ExxonMobil is plowing USD 200 million into its Baytown plant to reach 1 billion lb annual advanced recycling output by 2027.[4]Exxon Mobil Corporation, “ExxonMobil to Expand Advanced Recycling Capacity,” investor.exxonmobil.com Scaling solves looming rPET shortfalls and aligns converters with EU rules demanding 30% recycled content in beverage bottles by decade-end.
Restraints Impact Analysis*
| Restraint | (~) % Impact on CAGR Forecast | Geographic Relevance | Impact Timeline |
|---|---|---|---|
| Extended Producer-Responsibility (EPR) fees squeezing margins | -0.8% | North America and Europe; expanding | Short term (≤ 2 years) |
| Volatile aluminium premiums and supply bottlenecks | -0.6% | Global; heavy effect in North America and Europe | Short term (≤ 2 years) |
| PFAS phase-outs disrupting barrier-coated paperboard | -0.4% | North America and Europe; Australia next | Medium term (2–4 years) |
| Retailer bans on single-use secondary plastics | -0.3% | Europe leads; North America selective | Medium term (2–4 years) |
| Source: Mordor Intelligence | |||
Extended Producer-Responsibility (EPR) fees squeezing margins
Five U.S. states have enacted EPR laws that shift 90% of curbside recycling costs to producers by 2031. Eco-modulated charges tied to design recyclability can push packaging spend up 2–3%, compressing beverage margins while firms retool to lighter, mono-material formats. Navigating multiple state PROs adds administrative load and penalty risk for non-compliance.
Volatile aluminium premiums and supply bottlenecks
Quarterly premiums swung 15-25% in 2024 as geopolitical risks met energy-cost spikes. Novelis’ search for new capital underscores the multibillion-dollar need to broaden rolling capacity to meet can-sheet demand expected to rise to 10.5 million t by 2030. Smaller brands lack leverage to seal long-term contracts, so inventory buffers rise, diluting cash flows.
*Our forecasts treat driver/restraint impacts as directional, not additive. The impact forecasts reflect baseline growth, mix effects, and variable interactions.
Segment Analysis
By Material: Bioplastics Outpace Traditional Formats
PET and rPET bottles dominated with 70.80% revenue in 2025, reflecting a decades-long alignment of cost, clarity, and line compatibility. The soft drink packaging market size for PET equated to USD 116.9 billion in 2025 and is set for stable mid-single-digit expansion as the supply of food-grade rPET improves. Avantium’s PEF and Danimer’s PHA pipelines underpin a 16.8% CAGR for bioplastics, a niche today but one poised to carve premium categories with superior barrier metrics and lower cradle-to-grave footprints.
Shifting brand targets, net-zero pledges, and recycled-content quotas are hastening rPET uptake even in price-sensitive markets, with India mandating 30% PCR by 2025. Aluminium cans benefit from infinite recyclability and a 76.1% European recycling rate, yet volatile premiums dent converter margins. Glass retains cachet in craft lines but carries logistics penalties, while paperboard innovators scramble to replace PFAS coatings before looming bans take hold.


By Product Type: Bottles Hold Ground, Slim Cans Surge
Bottles commanded 58.45% of 2025 sales thanks to entrenched blow-molding fleets, broad SKU sizes, and wrap-label real estate. The soft drink packaging market size for bottles is forecast to cross USD 124.6 billion by 2031, aided by barrier innovations allowing lower-weight preforms. Slim aluminum cans, however, are surging at 8.42% CAGR as Gen-Z ranks portability and Instagram-ready silhouettes above volume.
Retailers embrace the format’s shelf efficiencies, and brands glean up to 20% price uplifts on identical fill volumes. Cartons gain share in chilled juice aisles as Tetra Pak shifts to plant-derived HDPE caps. Sachets remain vital in emerging markets, delivering ultra-low-cost entry points even as eco-taxes loom.
By Capacity: Single-Serve Formats Define Premium
Single-serve 251-600 ml SKUs represented 52.60% of 2025 consumption, cementing their status as the global norm for on-the-go refreshment. Within this band, brands employ shrink-sleeve graphics and QR-engagement to differentiate in cluttered chillers. Mini formats under 250 ml—notably 200 ml glass and 222 ml sleek cans—record a 9.05% CAGR that underscores dual trends: sugar-conscious moderation and premium indulgence.
Family packs above 1 L skew toward price-sensitive households and food-service chains; Coca-Cola’s German expansion adds high-output blow-molders to safeguard this core volume tier. The mid-volume 601 ml–1 L grouping offers a compromise of value and portability, sharing in regions where car-based consumption remains high.
By Closure Type: Smart Caps Create Engagement
Screw and sports caps held 65.40% revenue in 2025, prized for cost efficiency and universal capping line compatibility. The soft drink packaging market share of smart, connected closures, though small, is climbing rapidly behind South Korea’s 2026 label-ban that redirects branding real estate to caps. NFC and QR-enabled tops open direct-to-consumer channels, verifying authenticity and enabling gamified promotions.
Attached-cap mandates in the EU have triggered a wave of mold upgrades as converters engineer tethered hinges that survive high-speed filling yet detach seamlessly for recycling. Crown-and-pull tabs evolve incrementally, adding tactile elements that reinforce premium cues in energy drinks.
By Soft-Drink Category: Energy Drinks Propel Differentiation
Carbonated soft drinks retained a commanding 45.90% revenue slice in 2025, buoyed by sugar-reduction reformulations and flavor line extensions. Yet the faster-moving force lies in energy and functional beverages, charting 9.3% CAGR. Their caffeine and nutraceutical loads demand oxygen-barrier excellence, making aluminium and multi-layer PET the containers of choice.
Ready-to-drink teas and coffees echo this upmarket shift with nitro-infusions that need cans able to withstand pressure cycling, whereas flavored water leans on minimalist clear bottles to signal purity. Juices navigate a sugar-tax minefield by coupling natural claim labels with PEF-lined cartons that preserve aroma compounds longer than standard PET.
Geography Analysis
Asia-Pacific’s 42.60% revenue share stems from surging middle-class purchasing power, dense urban retail, and robust post-consumer PET recovery systems that fuel low-cost rPET loops. Japan’s 90% PET collection rate supplies domestic converters, while China subsidizes chemical recycling hubs to beat ambitious recycled-content goals. India’s EPR roadmap intensifies demand for bottle-grade rPET, positioning the region as a bellwether for circular-economy scale-up.
The Middle East posts the highest 6.74% CAGR to 2031 as Saudi Arabia and the UAE fast-track local can-sheet rolling lines and beverage plants in pursuit of food-security agendas. Youthful demographics gravitate to energy drinks packaged in sleek cans, reinforcing metal demand despite global aluminium price swings. Government incentives for sustainable industry clusters further spur adoption of rPET preforms in Gulf Cooperation Council filling lines.
North America wrestles with EPR-induced cost headwinds and aluminium sheet tightness, yet benefits from first-mover commercial trials of AI-driven design software that cuts new-SKU timelines. Europe continues to set the regulatory pace: the PPWR’s recyclability mandates catalyze investment in mono-material flexible films and advanced depolymerization. South America secures steady gains through Brazil’s new ALPLA HDPE recycling plant and rising consumption of functional drinks among urban millennials. Africa, still nascent, observes double-digit volume growth on the back of urban sprawl and expanding cold-chain logistics, though inadequate collection infrastructure tempers rPET uptake.

Competitive Landscape
Industry consolidation has accelerated, producing a more concentrated yet still competitive arena. The Amcor–Berry Global merger forges a USD 24 billion revenue titan that leverages shared polymer science and global converting footprints to unlock USD 650 million annual synergies. Ball Corporation fortifies its aluminium dominance via the Alucan and Florida Can Manufacturing acquisitions, pushing 2023 shipments to 107 billion units while advancing a net-zero roadmap that targets 85% recycled content by 2030.
Innovation-leaning disruptors monetize breakthrough chemistries: Avantium’s PEF platform wins beverage pilots across eight European nations, and JEPLAN licenses Rewind PET technology globally. Mid-tier specialists like Tetra Pak and Crown hone smart-pack capabilities, integrating on-cap QR codes for provenance tracking. Competitive intensity now hinges on three vectors: access to food-grade PCR feedstock, mastery of high-barrier bio-polymers, and digital engagement toolkits.
Smaller regional converters navigate widening compliance costs and volatile metal input prices by specializing in niche packs—retort pouches, aseptic cartons, or embossed glass—for craft sodas and boutique energy blends. First-mover intellectual-property portfolios in chemical recycling and carbon-negative polymers raise capital barriers for late entrants, while scale advantages in resin sourcing and logistics fortify incumbents.
Soft Drinks Packaging Industry Leaders
Amcor PLC
Toyo Seikan Group Holdings Ltd
Graham Packaging Company
Ball Corporation
Owens-Illinois Inc.
- *Disclaimer: Major Players sorted in no particular order

Recent Industry Developments
- May 2025: Anheuser-Busch committed USD 300 million to U.S. facilities, expanding its Technical Excellence Center model and workforce training.
- February 2025: Amcor completed its USD 8.4 billion all-stock merger with Berry Global, creating a global flexible- and rigid-packaging leader.
- February 2025: Ball Corporation acquired Florida Can Manufacturing to strengthen its North American aluminium can network.
- January 2025: ALPLA launched HDPE recycling operations in Brazil, boosting South American circular-economy infrastructure.


Research Methodology Framework and Report Scope
Market Definitions and Key Coverage
Our study defines the soft drinks packaging market as all primary containers, bottles, cans, cartons, pouches, bag-in-box, and emerging smart closures, sold to brand owners or bottlers for carbonated sodas, energy and functional drinks, juices, RTD tea and coffee, and flavored or packaged water. The definition spans rigid and flexible formats made of PET/rPET, other plastics, metal, glass, paperboard, and compostable films that directly protect the beverage and carry brand graphics.
Scope exclusion: Packaging for alcoholic beverages, dairy drinks, and outer corrugated transit packs is outside our scope.
Segmentation Overview
- By Material
- Plastic (PET, rPET, HDPE, Bioplastics)
- Metal (Aluminium, Steel)
- Glass
- Paper and Paperboard
- Flexible and Compostable Films
- By Product Type
- Bottles
- Cans
- Cartons and Aseptic Bricks
- Pouches and Sachets
- Bag-in-Box / Dispense Packs
- By Capacity
- Less Than 250 ml
- 251-600 ml
- 601-1 L
- More Than 1 L Family Packs
- By Closure Type
- Screw and Sports Caps
- Crown and Pull-tab
- Snap-on / Press-fit
- Smart / Connected Closures
- By Soft-Drink Category
- Carbonated Soft Drinks
- Juices and Nectars
- Energy and Functional Drinks
- RTD Tea and Coffee
- Flavoured and Sparkling Water
- By Geography
- North America
- United States
- Canada
- Mexico
- South America
- Brazil
- Argentina
- Rest of South America
- Europe
- Germany
- United Kingdom
- France
- Italy
- Spain
- Rest of Europe
- Asia-Pacific
- China
- Japan
- India
- South Korea
- Australia
- Rest of Asia-Pacific
- Middle East
- Israel
- Saudi Arabia
- United Arab Emirates
- Turkey
- Rest of Middle East
- Africa
- South Africa
- Egypt
- Rest of Africa
- North America
Detailed Research Methodology and Data Validation
Primary Research
Mordor analysts interviewed packaging converters in Asia, PET resin suppliers in the Gulf, recycling scheme operators in Europe, and procurement managers at regional bottlers across the Americas. These discussions refined conversion yields, validated container mix shifts toward rPET and slim cans, and gauged likely price pass-through after deposit return mandates.
Desk Research
We began with trade statistics from UN Comtrade and Eurostat to understand cross-border flows of PET preforms, aluminum beverage can bodies, and glass containers. Open-access consumption data from WHO Global Dietary Database, USDA, and Euromonitor Passport helped benchmark per capita soft drink intake, while material conversion factors were verified through technical papers hosted on ScienceDirect. Company 10-Ks, investor decks, and container supplier press releases provided average selling prices and recent capacity additions. Subscription resources such as D&B Hoovers and Dow Jones Factiva furnished financials and deal activity that contextualized market shares. These sources illustrate, not exhaust, the secondary inputs we reviewed.
Market-Sizing and Forecasting
We applied a top-down demand pool model: national soft drink consumption (liters) was multiplied by container penetration ratios and average fill volumes, then monetized using country-level weighted ASPs. Select bottom-up cross-checks, such as PET preform shipments, aluminum can body output, and sampled glass furnace utilizations, helped reconcile gaps. Key variables include PET recycling rate progression, can sheet premium trends, soft drink unit growth, regulatory recycled content targets, and evolving on-the-go format preferences. A multivariate regression with PET price, GDP per capita, and health-driven category substitution underpins the 2025 to 2030 forecast.
Data Validation and Update Cycle
Model outputs pass three layers of review: variance analysis against historical ratios, peer review by a senior analyst, and a post sign-off sense check before publication. We refresh the dataset every twelve months, with mid-cycle updates if policy shifts or major capacity announcements move the baseline.
Why Mordor's Soft Drinks Packaging Baseline Deserves Trust
Published numbers often diverge because firms choose different scope boundaries, pricing anchors, and refresh cadences. By aligning container definitions with beverage category splits and by re-pricing each material annually, we reduce those sources of error.
Key gap drivers versus other studies include exclusion of flexible pouches, rigid-only counts, wholesale instead of producer price usage, and single-variable CAGR projections.
Benchmark comparison
| Market Size | Anonymized source | Primary gap driver |
|---|---|---|
| USD 165.1 Bn (2025) | Mordor Intelligence | - |
| USD 154.4 Bn (2025) | Regional Consultancy A | Omits flexible pouches; limited country set |
| USD 87.0 Bn (2024) | Global Consultancy B | Counts only rigid plastic and glass; no trade flow correction |
| USD 90.0 Bn (2025) | Industry Analyst C | Uses wholesale prices; straight-line CAGR forecast |
Taken together, the comparison shows that Mordor's mix-sensitive scope, dual-approach modeling, and yearly refresh deliver a balanced, transparent baseline that decision-makers can confidently rely on.


Key Questions Answered in the Report
What is the current size of the global soft drink packaging market?
The market generated USD 173.39 billion in 2026 and continues to expand.
What growth rate is forecast for the soft drink packaging market through 2031?
Industry revenue is projected to rise at a 5.02% CAGR, reaching USD 221.56 billion by 2031.
Which packaging material holds the largest share in soft drink applications?
Plastic bottles lead with 70.80% of global revenue, supported by recyclability and well-established filling lines.
Which region is expected to post the fastest growth in soft drink packaging?
The Middle East is forecast to advance at a 6.74% CAGR through 2031, driven by youthful demographics and local manufacturing incentives.
Why are slim aluminum cans gaining popularity in soft drink packaging?
Gen-Z’s demand for portion-controlled, visually distinctive packs is pushing slim cans under 250 ml to an 8.42% CAGR.
Page last updated on:


