Enterprise Search Market Size and Share
Market Overview
| Study Period | 2020 - 2031 |
|---|---|
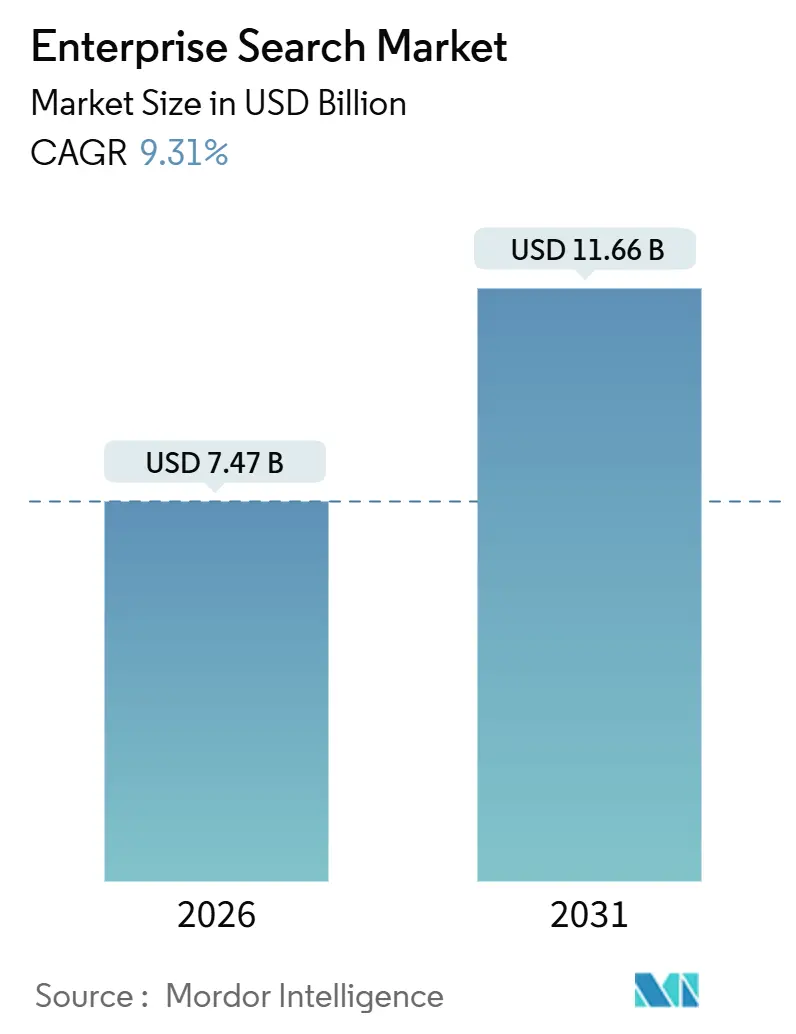
| Market Size (2026) | USD 7.47 Billion |
| Market Size (2031) | USD 11.66 Billion |
| Growth Rate (2026 - 2031) | 9.31% CAGR |
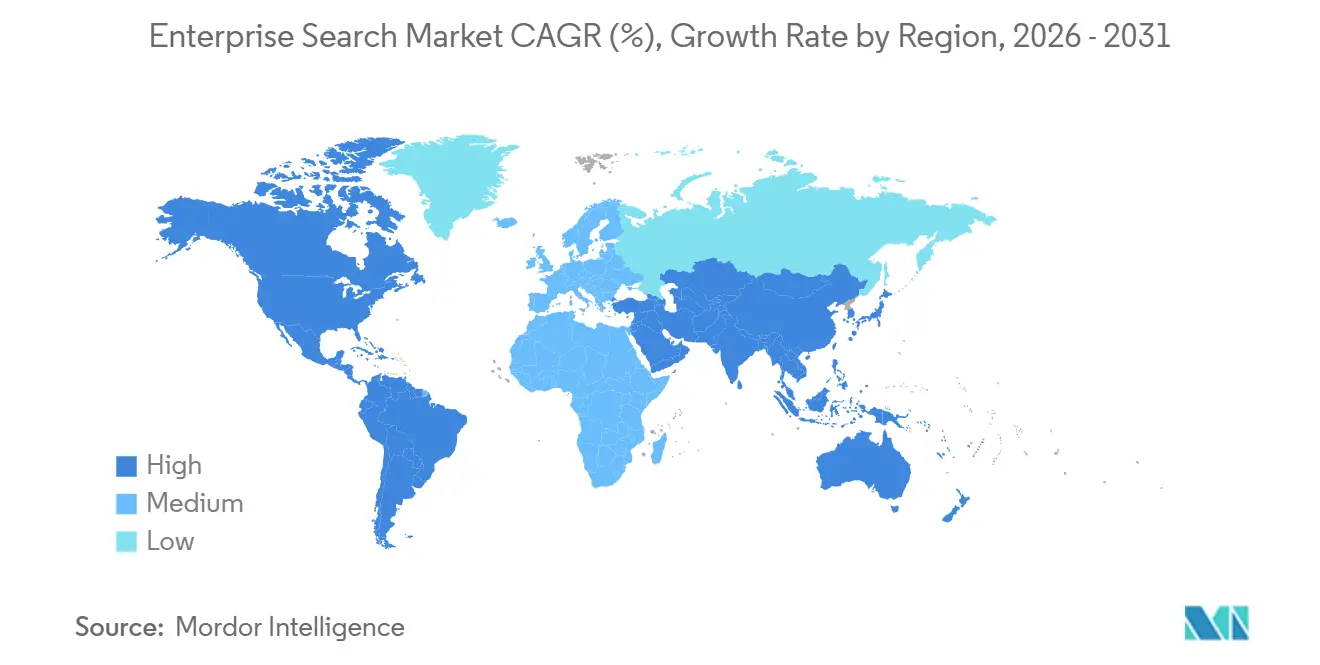
| Fastest Growing Market | Asia Pacific |
| Largest Market | North America |
| Market Concentration | Medium |
Major Players *Disclaimer: Major Players sorted in no particular order Image © Mordor Intelligence. Reuse requires attribution under CC BY 4.0. | |
Enterprise Search Market Analysis by Mordor Intelligence
The enterprise search market size reached USD 7.47 billion in 2026 and is projected to climb to USD 11.66 billion by 2031, reflecting a 9.31% CAGR. Growth is accelerating as organizations replace keyword-matching engines with neural architectures that combine vector databases, retrieval-augmented generation, and conversational interfaces. Cloud deployment continues to dominate because hyperscalers bundle managed indexing, pre-trained language models, and elastic scaling, which lower the total cost of ownership for both large enterprises and small and medium-sized enterprises. Demand for external expertise is rising; services revenue expands faster than platform sales because domain-tuned relevance models require iterative training and integration with legacy repositories. Industry adoption correlates with regulatory intensity; banking, financial services, and insurance lead on compliance mandates, while healthcare climbs quickly as hospitals surface adverse-event data in real time.
Key Report Takeaways
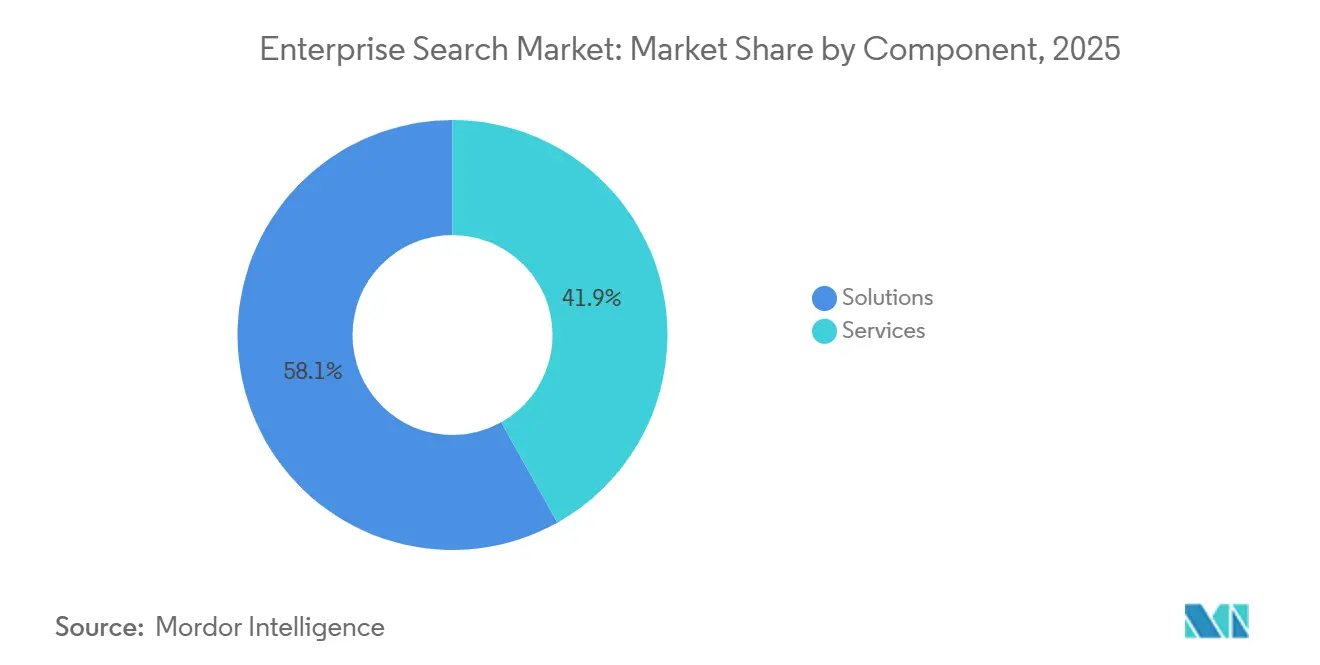
- By component, Solutions captured 58.11% of the enterprise search market share in 2025, while the enterprise search market size for Services is projected to expand at a 10.11% CAGR through 2031.
- By deployment mode, cloud deployments commanded 67.46% of the enterprise search market share in 2025 and the enterprise search market size for cloud is forecast to advance at a 12.66% CAGR to 2031.
- By search type, keyword search accounted for a 46.32% enterprise search market share in 2025, whereas the enterprise search market size for conversational and natural-language-processing search is poised to grow at an 11.43% CAGR between 2026 and 2031.
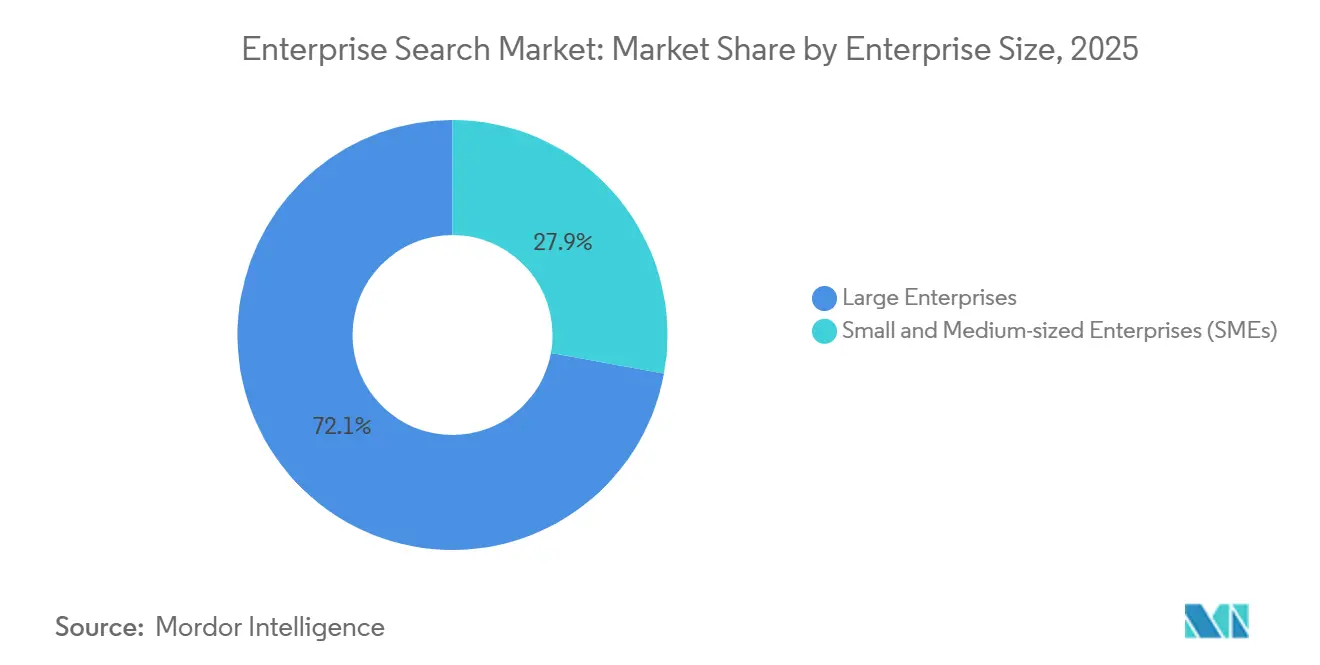
- By enterprise size, large enterprises held 72.13% of the enterprise search market share in 2025, although the enterprise search market size for small and medium-sized enterprises is anticipated to rise at a 12.27% CAGR through 2031.
- By industry vertical, banking, financial services, and insurance commanded 24.67% of the enterprise search market share in 2025, while the enterprise search market size for healthcare and life sciences is projected to register a 10.43% CAGR over the same horizon.
- By geography, North America secured 37.84% of the enterprise search market share in 2025, yet the enterprise search market size for Asia Pacific is expected to climb at an 11.01% CAGR to 2031.
Note: Market size and forecast figures in this report are generated using Mordor Intelligence’s proprietary estimation framework, updated with the latest available data and insights as of January 2026.
Global Enterprise Search Market Trends and Insights
Driver Impact Analyis*
| Driver | (~) % Impact on CAGR Forecast | Geographic Relevance | Impact Timeline |
|---|---|---|---|
| Explosive Growth in Enterprise Unstructured Data | +2.1% | Global, strongest in North America and Europe | Medium term (2-4 years) |
| Rapid Migration of Search Workloads to Cloud/SaaS | +1.8% | Global, led by North America and Western Europe | Short term (≤ 2 years) |
| Smartphone-Led Surge in Mobile Workforce Search Queries | +1.3% | Asia Pacific core, spill-over to Middle East and Africa | Medium term (2-4 years) |
| Demand for Domain-Tuned Conversational AI Interfaces | +1.9% | North America and Europe, expanding to Asia Pacific | Short term (≤ 2 years) |
| Rise of Retrieval-Augmented Generation for Gen-AI | +2.2% | Global, early uptake in North America and Europe | Short term (≤ 2 years) |
| Sovereign-Cloud Mandates Driving Hybrid Search | +1.4% | Europe, Asia Pacific, Middle East | Long term (≥ 4 years) |
| Source: Mordor Intelligence | |||
Explosive Growth in Enterprise Unstructured Data
Enterprises created 120 zettabytes of information in 2024, and more than 80% was unstructured formats such as emails, chat transcripts, and video files.[1]Source: Institute of Electrical and Electronics Engineers, “Standards for Vector Databases,” ieee.org Vector databases embed those assets as high-dimensional tensors so search systems can locate semantically similar passages instead of exact keyword hits. Financial institutions must retrieve communications within seconds during Basel III and Dodd-Frank audits, motivating the rapid adoption of neural search pipelines that outperform Boolean logic. In manufacturing, indexing computer-aided-design files cuts root-cause analysis time by nearly one-third when technicians use natural-language queries to pinpoint service bulletins. These productivity gains demonstrate why insight engines that recommend next actions are displacing federated engines that only aggregate results. The swelling volume and diversity of data, therefore, remain a structural driver for the enterprise search market.
Rapid Migration of Search Workloads to Cloud/SaaS
Cloud workloads already represent two-thirds of total deployments and are widening their lead because they eliminate capital expenses for on-premises clusters and provide instant access to pretrained language models. Amazon Kendra indexes S3 buckets and relational databases without customer-managed infrastructure, cutting operating overhead near 60% compared with self-hosted stacks. Microsoft Azure Cognitive Search plugs into Power BI and Dynamics 365 so business units query customer interactions inside familiar applications. Regulated industries still favor hybrid designs that index sensitive content on-premise while routing public documents to cloud endpoints. Sovereign-cloud mandates in Germany, France, India, and China accelerate this pattern by enforcing data-residency rules, yet they do not slow overall cloud adoption, they merely shape architecture choices.[2]Source: National Institute of Standards and Technology, “Special Publication 800-226,” nist.gov
Demand for Domain-Tuned Conversational AI Interfaces
Employees trained on consumer chatbots now expect enterprise systems to understand intent rather than Boolean syntax. Conversational search grows at 11.43% CAGR, the fastest of any modality. Coveo’s Relevance Generative Answering rewrites user prompts into embeddings, returns synthesized paragraphs, and trims customer-service handle time by one-quarter.[3]Source: Coveo, “Relevance Generative Answering,” coveo.com Clinicians query electronic health records with plain speech like “show me diabetic patients with HbA1c above eight” and receive instant lists that previously required multiple SQL joins. Domain adaptation remains critical because foundation models built on Wikipedia perform poorly on legal briefs or pharmaceutical patents, forcing vendors to fine-tune on vertical corpora with far fewer than 1,000 labeled examples.[4]Source: IBM, “Watson Discovery Vertical Packs,” ibm.com The result is a market shift toward out-of-the-box domain packs bundled with role-specific ontologies, which boosts services demand as enterprises ask specialists to curate training data.
Rise of Retrieval-Augmented Generation for Gen-AI
Retrieval-augmented generation inserts relevant passages from a vector store into the prompt window of a large language model, grounding answers in verifiable enterprise content. Slack added RAG in late 2024, so workers ask, “What was last quarter’s pricing decision?” and receive an answer with inline citations to channel messages. Elastic’s Search AI Platform pipelines retrieval through Anthropic Claude and OpenAI GPT-4 while preserving sub-200-millisecond latency across terabyte-scale indices. Organizations no longer need separate question-answering systems, which collapse two software categories into a single RAG layer that sits atop existing repositories. This architectural convergence explains why investments in standalone chatbot tools decline while spending on integrated search-plus-generation platforms rises.
Restraint Impact Analysis*
| Restraint | (~) % Impact on CAGR Forecast | Geographic Relevance | Impact Timeline |
|---|---|---|---|
| Persistent Data-Security and Privacy Concerns | -1.7% | Global, heightened in Europe and North America | Medium term (2-4 years) |
| Integration Complexity with Legacy ECM and CRM | -1.3% | North America and Europe | Long term (≥ 4 years) |
| Escalating GPU/TPU Cost for Neural-Search Inference | -0.9% | Global, acute for SMEs | Short term (≤ 2 years) |
| Ethical and Algorithmic-Bias Scrutiny | -0.6% | Europe and North America | Long term (≥ 4 years) |
| Source: Mordor Intelligence | |||
Persistent Data-Security and Privacy Concerns
Federated search that spans Salesforce, SharePoint, Google Workspace, and on-premise servers creates a single point of failure if breached. NIST Special Publication 800-226 outlines differential-privacy controls that add calibrated noise to query results, but chief information security officers still rank search logs among the most sensitive telemetry. Financial institutions face civil penalties above USD 50,000 per violation under Gramm-Leach-Bliley, and healthcare providers under HIPAA, if protected data surfaces unintentionally. Microsoft introduced customer-managed keys for Azure Cognitive Search so enterprises can revoke access instantly, yet this option adds 15-20% latency. The tension between zero-trust security and comprehensive index coverage remains unresolved, making data-protection anxiety a drag on new deployments.
Integration Complexity with Legacy ECM and CRM Stacks
Enterprises operate up to 15 content repositories with proprietary metadata and access models that resist normalization. Building custom connectors to map divergent taxonomies consumes six to nine months of professional labor. ServiceNow’s federated search polls external sources on fixed intervals, causing 30-40% of results to be duplicates or stale because many systems lack real-time change notifications. Mergers and acquisitions compound the challenge, as acquiring firms must quickly reconcile overlapping repositories to capture synergies. The cumulative integration tax delays time-to-value and dampens investment appetite, particularly among mid-market buyers with limited IT budgets.
*Our forecasts treat driver/restraint impacts as directional, not additive. The impact forecasts reflect baseline growth, mix effects, and variable interactions.
Segment Analysis
By Component: Services Gain as Model Tuning Outpaces Platform Deployment
Solutions dominated revenue with 58.11% share in 2025, headlined by cognitive platforms such as Elastic Enterprise Search, Google Cloud Search, and Microsoft Azure Cognitive Search. These offerings bundle vector indexing, semantic ranking, and packaged connectors, enabling rapid proof-of-concept launches. Federated engines retain a niche in regulated industries that prohibit data replication, but their share slips as hybrid indices prove both compliant and performant. Insight engines overlay machine-learning recommendations on search results, shortening field-service calls and boosting customer-service productivity.
Services revenue is on track for a 10.11% CAGR to 2031, reflecting enterprises’ need for domain expertise once the platform is live. Professional services cover implementation, data-curation, and relevance tuning, which can consume 60% of year-one budgets. Managed services now attract organizations that offload cluster administration in exchange for 99.9% uptime commitments under query-based pricing. The pivot from license fees to recurring consulting mirrors a broader software trend where expertise, not code, drives differentiation.


By Search Type: Conversational Interfaces Displace Keyword Matching
Keyword search still accounted for a 46.32% revenue share in 2025 and remains entrenched in e-discovery and technical documentation that demand deterministic results. Boolean operators excel when legal teams must prove exhaustive retrieval, and engineers still search exact part numbers. Yet vocabulary mismatch and limited context reasoning highlight its limits.
Conversational and natural-language-processing search leads growth at an 11.43% CAGR as employees expect ChatGPT-style interactions that synthesize answers. Glean re-engineered search around transformer models that embed queries alongside documents, letting multilingual staff find content despite typos or language shifts. Multimedia retrieval gains traction in media and manufacturing, while cross-lingual search unlocks collaboration in multinational corporations. Together, these modalities redefine user expectations and reduce tolerance for traditional ranked lists.
By Deployment Mode: Cloud Dominance Accelerates Despite Sovereignty Concerns
Cloud captured 67.46% share in 2025, and forecasts indicate a 12.66% CAGR to 2031, sustained by consumption-based pricing, managed security patches, and global points of presence that deliver sub-50-millisecond latency. Hyperscalers bundle retrieval engines with storage and GPUs, effectively subsidizing search to grow adjacent services.
On-premises persists where data-residency laws or sunk infrastructure costs prevail. Government agencies in the United States and highly regulated European banks still deploy air-gapped clusters. Hybrid patterns bridge both worlds, indexing sensitive data behind the firewall while handling public catalogs in the cloud, a compromise reinforced by European Union data-sovereignty statutes. With feature parity largely achieved, regulatory posture outweighs technical factors in deployment selection.
By Enterprise Size: SMEs Adopt Faster as SaaS Lowers Entry Barriers
Large organizations represented 72.13% of 2025 spending because their sprawling repositories and complex compliance needs justify multi-year search initiatives. Investment banks ingest hundreds of millions of emails daily, while manufacturers index petabytes of CAD files to monitor warranty exposure. Dedicated data-science teams fine-tune relevance models and monitor bias, creating high switching costs.
Small and medium-sized enterprises grow at 12.27% CAGR as SaaS vendors launch pay-as-you-grow tiers starting below USD 1,000 per month. Pre-built connectors for Google Workspace and Microsoft 365 let business users go live within days. SMEs also adopt conversational interfaces earlier because employees often hold cross-functional roles and benefit from synthesized answers that compress research time. This democratization signals a shift as enterprise search becomes a commoditized utility rather than a bespoke IT project.
By Industry Vertical: BFSI Leads While Healthcare Surges on Compliance Pressure
Banking, financial services, and insurance held 24.67% of 2025 revenue by embedding cognitive search into regulatory workflows. SEC Rule 17a-4 and MiFID II require rapid retrieval of communications, and investment banks deploy natural-language processing to flag potential violations proactively. Analysts leverage vector search to comb decades of equity research for precedents in seconds, reducing manual review costs.
Healthcare and life sciences are rising at a 10.43% CAGR as the FDA’s 21 CFR Part 11 forces pharmaceutical firms to surface audit trails across laboratory notebooks and manufacturing logs. Hospitals implement conversational search so clinicians pull patient histories without navigating multiple EHR modules, trimming administrative load and improving care coordination. The pattern shows that stringent regulation coupled with high knowledge value drives early adoption.
Geography Analysis
North America retained 37.84% share in 2025 as U.S. law firms and professional-services providers integrated cognitive search into e-discovery workflows where manual review costs exceed USD 1,000 per gigabyte. Canadian banks adopted bilingual indices to meet federal language mandates, while Mexican manufacturers leveraged search to document supply-chain traceability under USMCA rules. Growth has moderated to a steady trajectory as most large enterprises move from initial deployment to continuous optimization.
Asia Pacific records the highest regional CAGR at 11.01%, propelled by India’s 5-million-strong IT-services workforce and China’s data-sovereignty laws that enforce hybrid architectures. Multilingual search supports teams switching between English, Mandarin, Hindi, and regional languages, and mobile-first employees favor conversational interfaces integrated into WeChat Work and DingTalk. Japan, South Korea, Australia, and New Zealand collectively supply 40% of regional revenue, using search to comply with ISO 9001 quality standards.
Europe, Middle East, and Africa display mixed adoption. Western Europe focuses on GDPR compliance, compelling firms to locate and erase personal data across repositories within 30 days. Germany’s automotive sector indexes maintenance logs to reduce warranty claims, while Gulf states invest in sovereign clouds to localize public-sector data. Africa lags owing to limited cloud infrastructure, though low-bandwidth-optimized search gains traction in telecom and fintech.

Competitive Landscape
The top five vendors, Google, Microsoft, Amazon Web Services, Elastic, and IBM, controlled a major share of 2025 revenue, leaving room for independents to differentiate on connectors and domain packs. Hyperscalers aggressively price-compare to drive storage and GPU consumption; Amazon Kendra’s pricing undercuts self-hosted Elasticsearch clusters to lock customers into S3 and RDS. Coveo, Algolia, and Sinequa win mid-market deals by reducing time-to-value with pre-built connectors for Salesforce, SAP, and ServiceNow.
Vertical specialists are rising. Glean targets knowledge-intensive technology companies, while BA Insight pursues legal firms that demand e-discovery-grade audit trails. Open-source alternatives such as Apache Solr and OpenSearch remain attractive to organizations with strong DevOps talent, though operating them at scale requires deep tuning expertise. Competitive advantage now hinges less on indexing speed than on relevance optimization, which depends on proprietary training data.
Recent moves center on retrieval-augmented generation and multimodal embeddings. Microsoft added customer-managed keys and real-time indexing to Azure Cognitive Search, addressing security barriers for regulated clients. Elastic raised USD 150 million in late 2025 to fund its Search AI roadmap, indicating investor conviction in converged search-and-generation platforms. The market, therefore, exhibits moderate concentration with ongoing space for niche innovators.
Enterprise Search Industry Leaders
Google LLC
Amazon Web Services Inc.
Microsoft Corporation
IBM Corporation
Elastic N.V.
- *Disclaimer: Major Players sorted in no particular order

Recent Industry Developments
- January 2026: Microsoft expanded Azure AI Search with real-time indexing of Microsoft 365 Copilot conversations, trimming hybrid-query latency by 30%.
- December 2025: Google Cloud released Vertex AI Search with multimodal embeddings for text, image, and video.
- November 2025: Elastic secured USD 150 million to accelerate Search AI Platform development.
- October 2025: Amazon Web Services introduced Amazon Q Business with connectors for Salesforce, ServiceNow, and SAP.


Research Methodology Framework and Report Scope
Market Definitions and Key Coverage
According to Mordor Intelligence, the enterprise search market covers all packaged or cloud-delivered software that lets employees securely locate, rank, and retrieve structured or unstructured content stored across internal repositories, SaaS workspaces, and approved external sources. Revenue from licenses, subscriptions, and bundled maintenance across every geography is counted as market value.
Scope exclusion: standalone web search engines and one-off custom consulting scripts are outside this study.
Segmentation Overview
- By Component
- Solutions
- Cognitive Search Platforms
- Federated Search Engines
- Insight Engines
- Services
- Professional Services
- Managed Services
- Solutions
- By Search Type
- Keyword-Based Search
- Conversational / NLP Search
- Multimedia (Image/Video/Audio) Search
- Multilingual and Cross-Lingual Search
- By Deployment Mode
- Cloud
- On-Premise
- By Enterprise Size
- Large Enterprises
- Small and Medium-Sized Enterprises (SMEs)
- By Industry Vertical
- BFSI
- Healthcare and Life Sciences
- Government and Public Sector
- Retail and E-Commerce
- Media, Entertainment and Publishing
- Travel and Hospitality
- Manufacturing and Automotive
- Other Industry Verticals
- By Geography
- North America
- United States
- Canada
- Mexico
- South America
- Brazil
- Argentina
- Rest of South America
- Europe
- Germany
- United Kingdom
- France
- Italy
- Spain
- Rest of Europe
- Asia-Pacific
- China
- India
- Japan
- South Korea
- Australia and New Zealand
- Rest of Asia-Pacific
- Middle East
- Saudi Arabia
- United Arab Emirates
- Turkey
- Rest of Middle East
- Africa
- South Africa
- Nigeria
- Egypt
- Rest of Africa
- North America
Detailed Research Methodology and Data Validation
Primary Research
Our analysts held structured interviews with CIOs, search architects, managed-service partners, and procurement heads across North America, Europe, and Asia Pacific. Discussions validated deployment mix, seat density, price realization, and emerging AI-driven use cases, filling data gaps spotted during desk work.
Desk Research
We began with trusted public datasets such as US Census ICT tables, Eurostat digital economy indicators, and OECD ICT surveys. We then layered insights from specialist bodies like AIIM white papers and search-related patents accessed through Questel. Company filings, 10-Ks, and investor decks of leading platform vendors, plus installation metrics mined from D&B Hoovers and Dow Jones Factiva, helped us frame adoption curves and average selling prices. A second pass used trade association notes, customs records, and academic journals to cross-verify volumes and regional splits. The sources listed illustrate our approach; many additional open publications were consulted for clarification and confirmation.
Market-Sizing & Forecasting
A top-down model starts with global enterprise software outlays and corporate data-growth statistics, which are then filtered through industry-wise search penetration ratios and average seat counts. Resulting volumes are multiplied by blended ASPs derived from supplier checks. Supplier roll-ups for four key regions provide bottom-up guardrails that expose outliers. Critical variables tracked include data generated per employee, cloud workload share, conversational search adoption rate, and vector-index prevalence. Multivariate regression, enriched with scenario analysis where regulatory shifts loom, produces the forecast through 2030.
Data Validation & Update Cycle
Automated variance screens flag anomalies each quarter, analysts review variances alongside independent metrics, and corrective calls are made when deviations exceed tolerance. Reports refresh annually, with interim updates triggered by major pricing moves, landmark product launches, or material M&A activity. Before client delivery, a senior analyst replicates pivotal calculations to sign off the numbers.
Why Our Enterprise Search Baseline Commands Reliability
Published estimates differ because firms vary in product mix, price tracking, and refresh cadence. When definitions wander or list prices are frozen, totals swing.
Key gap drivers in other studies include the inclusion of basic website search tools, static on-premise license bases that ignore SaaS growth, and uniform discount assumptions instead of live deal benchmarks. Mordor's rolling cloud workload tracker and yearly ASP audits avoid these drifts.
Benchmark comparison
| Market Size | Anonymized source | Primary gap driver |
|---|---|---|
| USD 6.83 B (2025) | Mordor Intelligence | - |
| USD 6.12 B (2024) | Regional Consultancy A | Adds site-search tools, applies flat 15 % discount to list prices |
| USD 4.87 B (2023) | Trade Journal B | Relies on historic on-premise licenses, excludes SaaS subscriptions |
The comparison shows that by selecting a disciplined scope, auditing real-world prices, and refreshing models yearly, Mordor Intelligence delivers a balanced, transparent baseline that decision-makers can rely on.


Key Questions Answered in the Report
How big is the enterprise search market in 2026?
The enterprise search market size stands at USD 7.47 billion in 2026.
What is the expected CAGR for enterprise search between 2026 and 2031?
The market is forecast to post a 9.31% CAGR during the 2026-2031 period.
Which deployment model is growing fastest in enterprise search?
Cloud deployment leads with a projected 12.66% CAGR to 2031, driven by managed services and elastic scaling benefits.
Why are services revenue rising faster than platform sales?
Enterprises increasingly rely on external specialists for model tuning, data curation, and integration, propelling services at a 10.11% CAGR.
Page last updated on:


