
Market Overview
| Study Period | 2020 - 2031 |
|---|---|
| Market Size (2026) | USD 11.39 Billion |
| Market Size (2031) | USD 16.99 Billion |
| Growth Rate (2026 - 2031) | 8.34 % |
| Fastest Growing Market | Asia Pacific |
| Largest Market | Europe |
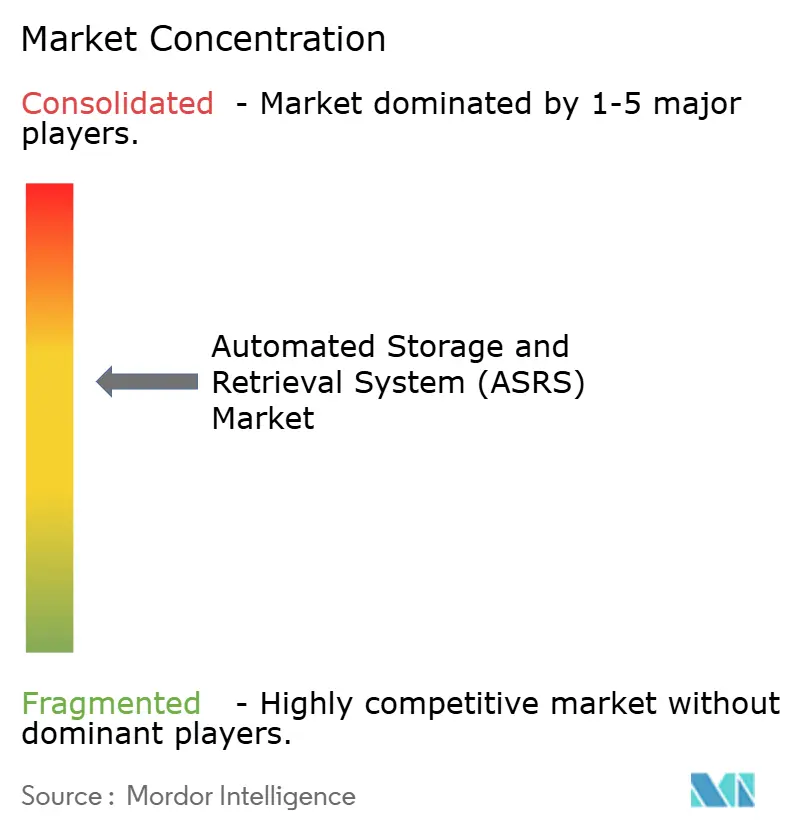
| Market Concentration | Medium |
Major Players *Disclaimer: Major Players sorted in no particular order Image © Mordor Intelligence. Reuse requires attribution under CC BY 4.0. | |
Automated Storage And Retrieval System (ASRS) Market Analysis by Mordor Intelligence
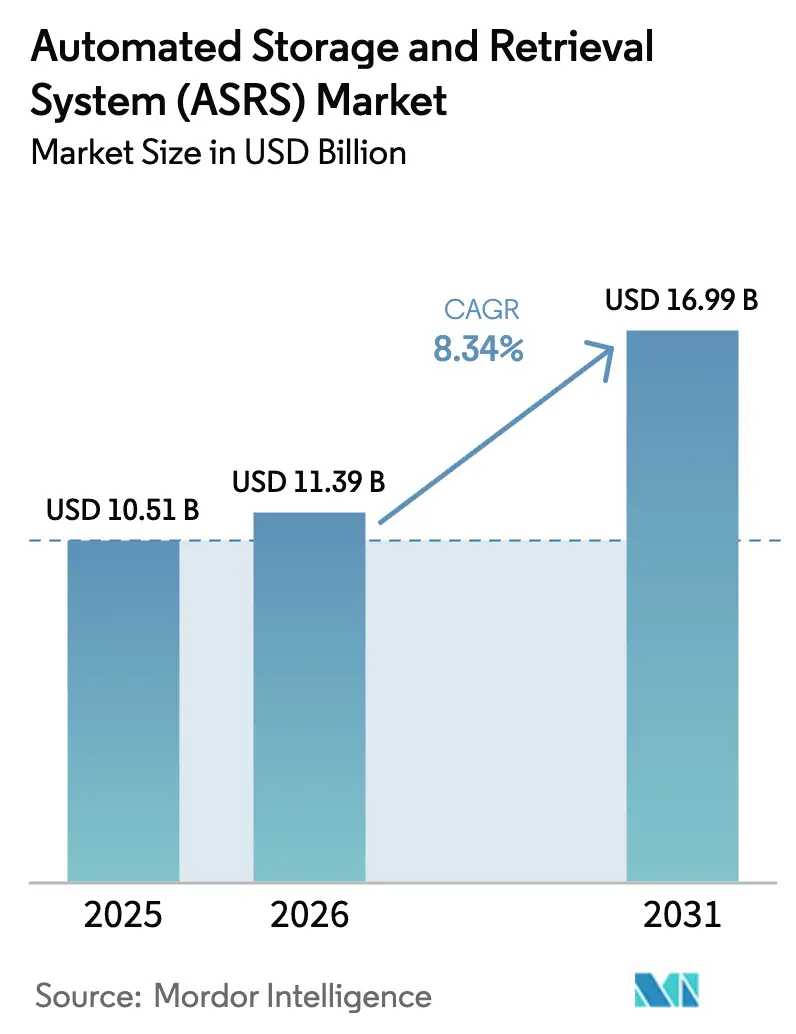
The automated storage and retrieval system market size was valued at USD 10.51 billion in 2025 and estimated to grow from USD 11.39 billion in 2026 to reach USD 16.99 billion by 2031, at a CAGR of 8.34% during the forecast period (2026-2031). Growing e-commerce volumes, chronic labor shortages, and escalating real-estate costs have combined to create a tipping point at which automated storage and retrieval system market deployments deliver measurable gains in throughput, accuracy, and space utilization. Companies facing 5%–7% annual wage inflation in logistics roles have treated capital-intensive automation projects as a hedge against rising operating expenses, while energy-efficient cube and shuttle solutions align with corporate sustainability mandates. Technology convergence is reshaping solution design; modern platforms integrate robotics, AI routing algorithms, and predictive maintenance analytics that cut unplanned downtime by up to 30%. Early adopters report cycle-time reductions of 40% for high-mix order profiles, positioning automated storage and retrieval system market investments as a foundation for omnichannel fulfillment strategies.
Key Report Takeaways
- By product type, fixed-aisle crane systems led with 37.65% automated storage and retrieval system market share in 2025, whereas cube-based and robotic storage platforms are projected to expand at 11.92% CAGR to 2031.
- By load type, unit-load solutions accounted for 41.92% automated storage and retrieval system market size in 2025; mini-load tote systems represent the fastest growth at 11.08% CAGR through 2031.
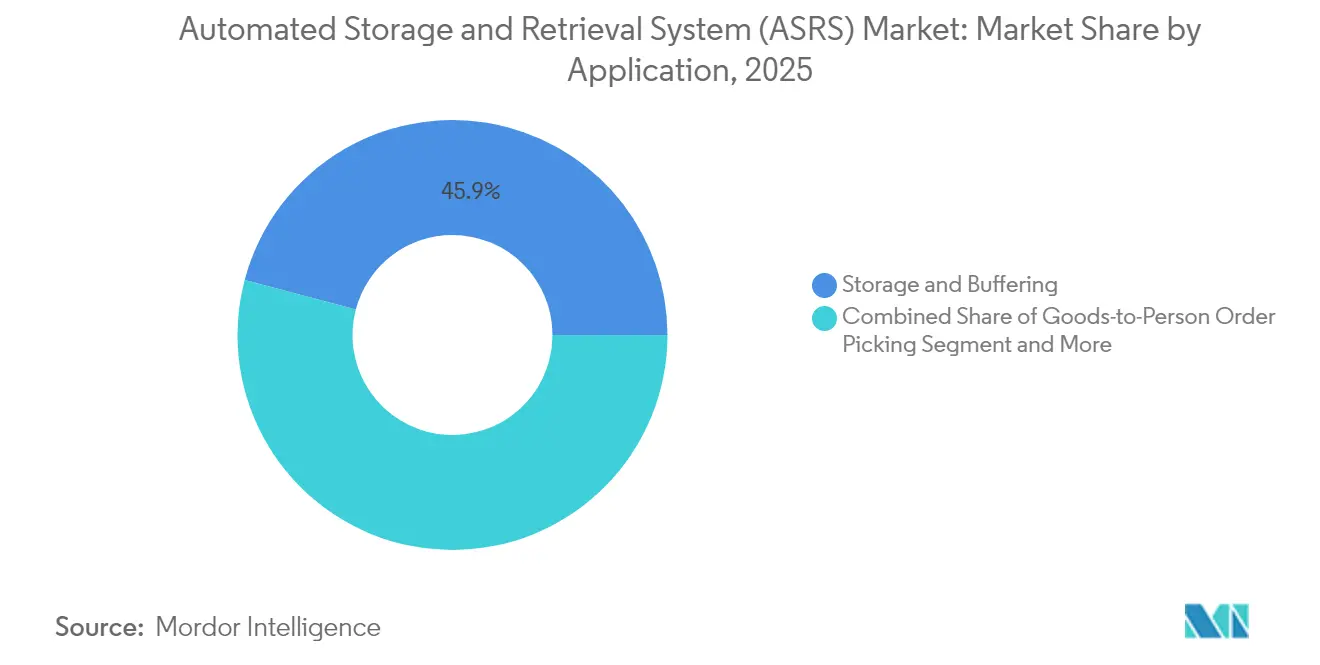
- By application, storage and buffering maintained 45.88% share of the automated storage and retrieval system market size in 2025 while goods-to-person order picking is advancing at 13.78% CAGR.
- By end-user industry, manufacturing-automotive held 26.75% automated storage and retrieval system market share in 2025, yet e-commerce and retail is registering the highest forecast CAGR of 13.12%.
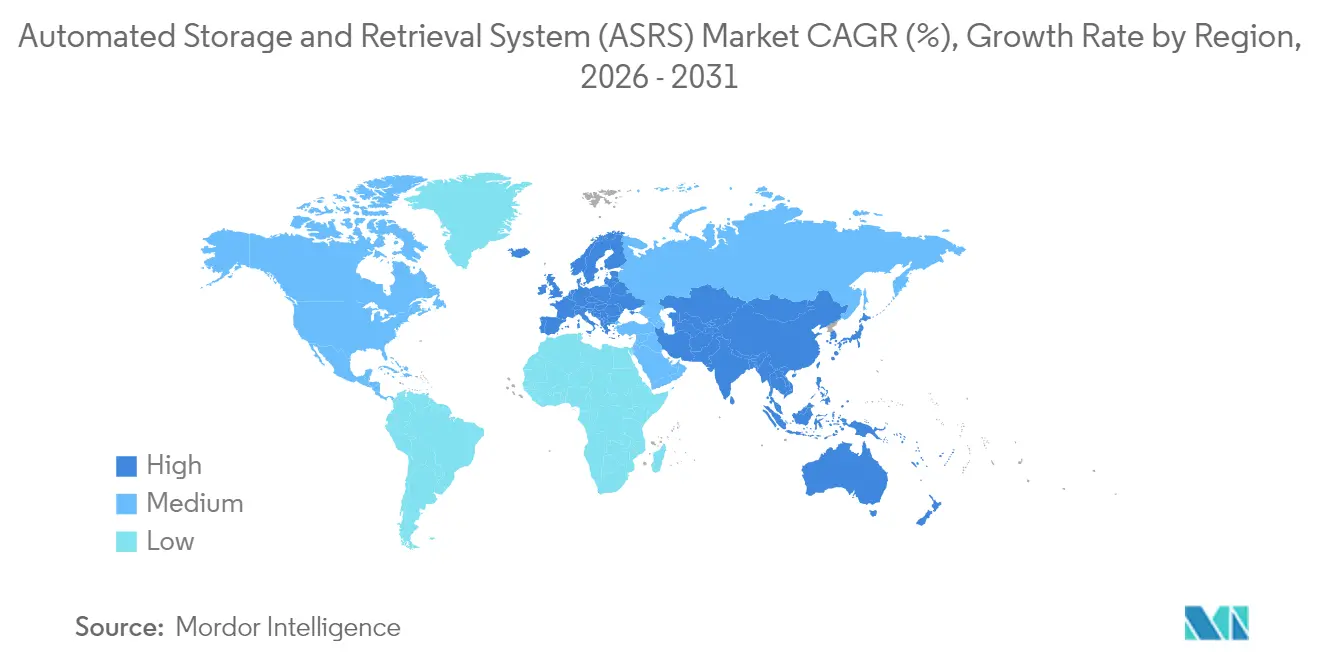
- By geography, Europe contributed 33.42% revenue in 2025; Asia-Pacific is the fastest-growing regional segment at 11.67% CAGR to 2031.
Note: Market size and forecast figures in this report are generated using Mordor Intelligence’s proprietary estimation framework, updated with the latest available data and insights as of 2026.
Market Trends and Insights
Drivers Impact Analysis of Automated Storage And Retrieval System (ASRS) Market*
| Driver | (~) % Impact on CAGR Forecast | Geographic Relevance | Impact Timeline |
|---|---|---|---|
| E-commerce fulfillment pressure | +2.8% | Global, led by North America and Asia-Pacific | Short term (≤ 2 years) |
| Rising labor-cost and safety mandates | +2.1% | North America and EU, expanding to Asia-Pacific | Medium term (2-4 years) |
| Shift toward micro-fulfillment centers | +1.4% | Urban hubs worldwide | Medium term (2-4 years) |
| Deep-freeze warehouse automation | +1.2% | Europe and North America first adopters | Long term (≥ 4 years) |
| Predictive-maintenance analytics | +0.9% | Europe, North America, Japan | Long term (≥ 4 years) |
| Industrial-policy incentives | +1.1% | China, Japan, Korea, EU | Medium term (2-4 years) |
| Source: Mordor Intelligence | |||


E-commerce fulfillment pressure
By mid-2025, Amazon’s deployment of 1 million robots served as visible proof that manual picking cannot sustain order profiles approaching 300 lines per hour. Peer retailers responded by fast-tracking cube and shuttle projects that shrink order cycle times from hours to minutes, driving accelerated bookings for the automated storage and retrieval system market. Higher return rates in apparel and electronics sharpened the focus on accuracy; AI-enhanced grippers now achieve item recognition accuracy above 99%, cutting costly reships. Fulfillment operators also discovered that robotics lowered energy cost per order by 8% by limiting forklift movements and lighting requirements.
Rising labor costs and safety mandates
Forklift incidents accounted for most fatal warehouse accidents in 2024, costing USD 84 million in weekly injury claims across the United States[1]Damotech, “5 Surprising Warehouse Safety Statistics,” damotech.com. New OSHA guidelines issued in 2025 shifted employer liability, prompting accelerated conversion to goods-to-person cells that remove humans from high-traffic aisles. Automotive maintenance depots suffering a projected 20% technician shortfall by 2028 adopted mini-load systems to reassign scarce labor from retrieval to diagnostic roles. Collectively, these dynamics add more than two percentage points to automated storage and retrieval system market growth over the mid-term.
Shift toward micro-fulfillment centers
Urban real-estate prices forced grocers and pharmacies to reimagine last-mile logistics. Cube-based grids process 1,000 orders per hour in footprints under 10,000 square feet, an 85% space saving compared with legacy rack layouts. Retailers that placed micro-fulfillment nodes adjacent to storefronts reported delivery windows shrinking to under two hours, raising customer retention by 4–6 percentage points. Investment appetite continued to rise because modular designs allow incremental capacity additions, protecting ROI as demand fluctuates.
Deep-freeze warehouse automation
Cold-chain operators faced triple pressures of labor scarcity, strict temperature compliance, and energy costs that climbed 12% in 2024. AutoStore’s 18-level multi-temperature grid lowered kWh consumption 40% by combining chilled and frozen goods in one structure. Dematic’s fully automated Quebec facility validated continuous operation at −28 °C without manual intervention, signaling long-term adoption potential.
Restraints Impact Analysis of Automated Storage And Retrieval System (ASRS) Market*
| Restraint | (~) % Impact on CAGR Forecast | Geographic Relevance | Impact Timeline |
|---|---|---|---|
| High initial CAPEX and long payback | -1.8% | Global, toughest for SMEs | Short term (≤ 2 years) |
| Scarcity of ASRS-skilled technicians | -1.2% | Economies with aging workforces | Medium term (2-4 years) |
| Integration complexity with legacy WMS | -0.9% | Enterprises running legacy stacks | Medium term (2-4 years) |
| Cyber-security vulnerabilities | -0.7% | Highly connected regions | Long term (≥ 4 years) |
| Source: Mordor Intelligence | |||
High initial CAPEX and extended payback periods
Turnkey projects ranging from USD 70,000 to USD 3 million deterred many small distributors despite demonstrable cost-out potential[2]Berkshire Grey Announces Formal Partnership with Kardex,” kardex.com. TCO models reveal software, commissioning, and training often add another 40% to sticker price, stretching payback beyond CFO comfort zones during periods of macro uncertainty. Subscription-based “pay-per-pick” models started to mitigate upfront expense, though current availability is limited to select high-volume use cases.
Cyber-security vulnerabilities threaten connected ASRS operations
Sixty-eight publicly disclosed operational-technology incidents hit manufacturing in 2023, up 19% year on year, and ransomware represented more than half of those events. Automation platforms that converge IT and OT expose new attack surfaces; many operators lack staff certified to secure industrial protocols. Breaches that halt inventory movement for even a day can erase weeks of margin in high-volume e-commerce nodes, dampening near-term adoption among risk-averse firms.
*Our forecasts treat driver/restraint impacts as directional, not additive. The impact forecasts reflect baseline growth, mix effects, and variable interactions.
Automated Storage And Retrieval System (ASRS) Market Segment Analysis
By Product Type:
Cube-based systems challenge crane dominanceFixed-aisle crane installations still delivered 37.65% of global revenue in 2025, anchored in automotive and bulk consumer-goods plants where predictable flows justify tall rack structures. These installations historically set the design template for the automated storage and retrieval system market, yet they lock users into specific aisle widths and throughput ceilings. Cube-based grids and robotic storage lines gained momentum by raising storage density 60% and slashing retrieval times to under 70 seconds, driving a 11.92% CAGR that will shift the revenue mix before decade-end. AutoStore and populous 3PLs such as DSV scaled cube deployments across nine countries, underscoring multipurpose adaptability. Shuttle-based systems occupy a middle ground; modular shuttle lanes allow firms to expand incrementally without major building retrofits. That flexibility appeals to fast-growing retailers who want automated storage and retrieval system market investments aligned with year-to-year demand swings.
Vertical lift modules (VLMs) and carousel solutions remain niche at under 10% revenue share, yet they add critical value where floor area is scarce and parts integrity is paramount. Medical-device assemblers, for example, use VLMs to protect micro-mechanical parts from contamination while achieving pick accuracies above 99.9%. Hybrid facilities increasingly mix cranes, shuttles, and cubes, an architecture that exemplifies how the automated storage and retrieval system market evolved toward tailored ecosystems rather than single-technology bets. Kardex’s collaboration with Berkshire Grey incorporated AI vision pick cells into VLM lines, attaining 99.99% accuracy and reinforcing the cross-pollination trend shaping modern warehouse design.



By Load Type:
Mini-load momentum mirrors SKU proliferationUnit-load pallet systems captured 41.92% of 2025 revenue, powered by automotive subassemblies, beverage palletizing, and other bulk flows where each storage location houses homogenous items. Yet the SKU explosion in e-commerce drove tote-level retrieval rates that unit-load cranes cannot satisfy cost-effectively, opening demand for mini-load systems advancing at 11.08% CAGR. The automated storage and retrieval system market size for mini-load tote solutions is projected to expand even faster in omnichannel grocery, where online order lines per basket average 35. A single mini-load aisle can process up to 1,200 tote cycles per hour, enabling store replenishment and click-and-collect fulfillment from one footprint.
Pallet shuttle subsystems bridge high-throughput pallet storage with selective access demands, permitting configurable depth that balances density and speed. Mid-load applications, though smaller in headline numbers, handle awkward medium-sized components in electronics and aftermarket auto parts, functions often overlooked in project scoping yet critical to end-to-end flow. Operators increasingly blend load types inside unified software platforms so that WMS directs picks based on real-time cost per move, rather than rigid siloed zones, signaling a nuanced maturity within the automated storage and retrieval system market.
By Application:
Goods-to-person picking reshapes labor modelsStorage and buffering accounted for 45.88% of spending in 2025, affirming that inventory density and FIFO compliance remain core motivations. However, goods-to-person lines grew the fastest at 13.78% CAGR because they directly solve escalating labor scarcity and error-rate issues. When a cube robot places a tote at an ergonomic workstation every 3.5 seconds, walk-time virtually disappears, and operators can hit 450 picks per hour with sub-0.3% error rates. Facilities have reported labor saving ratios approaching 4:1, lowering cost to fulfill single-line orders from USD 2.40 to USD 0.95. This is especially salient for apparel and beauty verticals where order profiles skew heavily toward single units.
Kitting and sequencing functions integrate directly into assembly lines. Automotive OEMs deploy sequence buffering to deliver parts within ±30 seconds of takt time, avoiding costly line stops. Assembly support applications route totes via AMRs directly to workstation gravities, removing fork trucks entirely from production floors. Cold-storage and deep-freeze handling remains a specialized high-margin niche; yet vaccine producers and frozen-food distributors increasingly rely on multi-temperature cubes that demonstrate unassisted uptime at −25 °C, maintaining GDP compliance without manual audits. The breadth of applications reflects how the automated storage and retrieval system market penetrated from back-of-house reserve storage into core production and consumer-facing operations alike.
By End-User Industry:
Retail and 3PLs outpace legacy leadersAutomotive manufacturing dominated 26.75% revenue share owing to high volumes and early adoption precedent, but its growth curve flattened as plants already run dense unit-load setups. Meanwhile, e-commerce and retail logged 13.12% CAGR, adding more incremental dollars than any other vertical. Same-day delivery promises pushed chains to install micro-fulfillment islands inside regional hubs, propelling new orders for cube and shuttle kits optimized for 5,000–15,000 order lines per hour. Consumer goods brands mirrored that urgency; PepsiCo’s Thailand campus unified production staging and outbound order prep in a single automated building, cutting cross-dock transfers by 60%.
Food and beverage manufacturers invested heavily in deep-freeze shuttles to meet regulatory mandates on traceability and expiration control. Pharmaceutical and life-science users adopted robots to guarantee 100% audit-ready chain-of-custody for serialized packages. Third-party logistics firms, under client pressure to quote transactional rather than headcount-based fees, became fast followers, bundling automated storage and retrieval system market capabilities as a premium differentiator. Defense depots and government stores deployed mini-load grids inside hardened facilities where personnel access is restricted, underscoring the technology’s versatility across security tiers.
Geography Analysis
Europe Automated Storage and Retrieval System (ASRS) Market
Europe retained the largest regional contribution at 33.42% of 2025 global revenue. High labor costs exceeding USD 28 per hour and stringent worker-safety legislation made automation financially compelling, while EU sustainability rules recognized high-density cube grids as a path to lower building energy footprint. Germany’s High-Tech Strategy 2025 earmarked USD 369.2 million for robotics R&D, reinforcing commercial ecosystems that nurture solution providers. Scandinavian retailers compressed six conventional warehouses into a single automated facility and cut CO₂ per shipped order by 35%.
APAC Automated Storage and Retrieval System (ASRS) Market
Asia-Pacific delivered the fastest growth at 11.67% CAGR. China’s trillion-yuan robotics megaproject signaled state-level commitment to factory automation, while Japan proposed a 500-kilometer conveyor belt network linking Osaka and Tokyo, creating demand for high-throughput sortation nodes. Korean policy incentives added USD 128 million in grants for smart-factory deployments, and India became a production hub following Daifuku’s 2025 plant opening that lowers lead times for regional customers. The automated storage and retrieval system market in Asia-Pacific therefore benefits from both domestic demand and localized manufacturing capacity.
North America, LATAM and MEA Automated Storage and Retrieval System (ASRS) Market
North America remains innovation center, with hyperscale e-commerce proving grounds that set global benchmarks. Amazon introduced AI foundation models to re-route swarm robots, improving energy efficiency while increasing picks per hour, which directly influences design specifications adopted by peers. AutoStore’s new headquarters in New Hampshire houses an academy that trains technicians, addressing the skill-gap restraint and underscoring the company’s forecast to surpass 300 regional installations by late-2026. Latin America and Middle East and Africa are emerging corridors; Saudi pharmaceutical distributors piloted semi-automated fulfillment in 2024, and Brazilian 3PLs benefitted from tax breaks on capital goods, positioning both regions as growth white space over the next five years.

Regulatory Landscape
ASRS deployments sit at the intersection of machine safety, workplace safety, and cross-border trade compliance. Globally, projects commonly map risk assessment and safety validation to ISO 12100 and ISO 13849, while US facilities must also align with OSHA requirements under 29 CFR 1910 for warehousing operations. This shapes requirements across guarding and emergency stops, as well as lockout-tagout procedures during commissioning and maintenance.
On the trade and policy side, US Customs and Border Protection ruling N359280 (March 10, 2026) clarified tariff classification for imported automated storage systems from Germany and Switzerland, providing an anchor for landed-cost modeling on crane, shuttle, and cube-system imports. In the United Kingdom, the Smart Machines Strategy 2035 sets a pro-innovation stance while placing robotics activity alongside the Health and Safety at Work Act and the National Security and Investment Act. The UK Regulatory Innovation Office (January 16, 2026) also prioritized robotics and defence to streamline overlapping approvals that can affect time-to-deploy for automated systems.
Value Chain Analysis
The ASRS value chain begins with upstream components and subsystems, including structural steel and racking, motors and drives, sensors and safety hardware, conveyors and shuttle or crane mechanics, and electronic control modules (PLCs, industrial networks, and edge compute). System OEMs and robotics providers then integrate these into cranes, shuttles, vertical lift modules and carousels, and cube-based grids, bundling controls, Warehouse Control System and Warehouse Execution System layers, and interfaces to customer WMS or ERP. Site engineering, commissioning, and operator training represent a material share of delivered cost, particularly where integration effort is higher in brownfield warehouses.
Downstream, value concentrates in turnkey project delivery, lifecycle service, and software-led optimization (monitoring, predictive maintenance, and orchestration across mixed automation). Evidence in 2025 pointed to procurement pressure tied to tariff measures and higher costs for imported electronic control modules and specialized automation elements, which encouraged manufacturers and integrators to regionalize parts of the supply base and qualify domestic suppliers where feasible. Adoption continues to rely on 3PLs, retail distribution operators, and manufacturers, while financing and service models (including consumption-oriented approaches in select high-volume use cases) are increasingly used to address high initial CAPEX barriers.
Competitive Landscape
Moderate consolidation characterizes the automated storage and retrieval system market, with the top five vendors controlling the majority of global revenue. These incumbents leverage multi-technology portfolios—cranes, shuttles, cube robots—combined with proprietary software suites to lock in enterprise accounts. Symbotic’s USD 5 billion acquisition of Walmart’s Advanced Systems and Robotics unit doubled its project backlog and solidified a decade-long roll-out pipeline across more than 40 regional distribution centers. Such tie-ups create high switching costs for retailers seeking integrated automation and maintenance agreements.
Strategic thrusts in 2025 centered on ecosystem alliances. KION Group tapped NVIDIA’s Omniverse to simulate robot fleet performance, allowing clients to stress-test configurations virtually before committing capex. Kardex and Berkshire Grey cross-licensed pick software and VLM hardware to deliver modular solutions with 99.99% accuracy guarantees. Such collaborations blur lines between equipment OEMs, software integrators, and robotics specialists, increasing competitive intensity around AI-driven orchestration layers.
Entrants exploit niches that incumbent roadmaps overlook—for example, software-defined orchestration that decouples hardware brand from control logic. Start-ups promote API-first platforms that ingest IoT sensor data, predict load imbalance, and reroute tasks autonomously. Another white-space opportunity lies in hazardous-material storage where explosion-proof robotics remain scarce. Market leaders counter by extending service portfolios, offering 24/7 remote support, lifetime performance guarantees, and consumption-based financing. In this environment, product leadership alone is insufficient; the battlefront extends to analytics, cybersecurity, and turnkey lifecycle services, all of which shape procurement criteria for automated storage and retrieval system market buyers.
Automated Storage And Retrieval System (ASRS) Industry Leaders
Daifuku Co. Ltd
Schaefer Systems International Pvt Ltd
Dematic (Kion Group AG)
Murata Machinery Ltd
Mecalux SA
- *Disclaimer: Major Players sorted in no particular order
Automated Storage And Retrieval System (ASRS) Market Companies Covered in this Report
- Daifuku Co., Ltd.
- Schaefer Systems International GmbH (SSI SCHAEFER)
- Dematic Corp. (KION Group AG)
- Murata Machinery, Ltd.
- Mecalux, S.A.
- Honeywell Intelligrated, Inc.
- KUKA AG
- KNAPP AG
- Kardex Holding AG
- Toyota Industries Corporation
- Viastore Systems GmbH
- AutoStore Holdings Ltd.
- Swisslog Holding AG
- Vanderlande Industries B.V.
- Bastian Solutions LLC
- System Logistics S.p.A.
- Hänel Storage Systems
- Modula S.p.A.
- TGW Logistics Group GmbH
- BEUMER Group GmbH & Co. KG
- Stöcklin Logistik AG
- Godrej Körber Supply Chain Ltd.
- Westfalia Technologies, Inc.
- Shanghai Jingxing Logistics Equipment Engineering Co., Ltd.
- Unitechnik Systems GmbH

Market Opportunities and Future Outlook
Opportunity is widening around standardization and faster decision-making for buyers that are earlier in their automation journey, particularly as SKU proliferation pushes facilities toward mini-load and goods-to-person configurations. In June 2025, the MHI ASRS Industry Group introduced an ASRS Roadmap at the 2025 MHI Spring Meeting, signaling structured demand for implementation guidance, specification templates, and vendor-neutral frameworks that can shorten evaluation cycles and reduce project risk for first-time adopters.
There is also whitespace in rapid-deploy, modular installations and in performance upgrades that connect ASRS with broader digital operations. Kardex delivered a fully operational AutoStore system for Balluff in Florence, Kentucky in six months (reported October 2025), and the site achieved a 177% increase in lines processed per hour. Additional opportunity is forming in smart-factory logistics centers that combine pallet ASRS, mini-load tote ASRS, and goods-to-person picking as an integrated material-flow layer, exemplified by the May 2026 launch of a smart factory logistics center by China JSSL Company. This supports demand for unified WES and WCS platforms, OT-IT cybersecurity controls, and retrofit-friendly designs that integrate with legacy WMS stacks without extended downtime.
Recent Industry Developments in Automated Storage And Retrieval System (ASRS) Market
- June 2026: Dematic partnered with Pattison Food Group on an automated grocery fulfillment solution in Langley, British Columbia, featuring nearly 62,000 automated storage locations. The project underscores continued investment in high-density storage and goods-to-person automation for grocery order profiles, where throughput and accuracy directly affect service levels and spoilage control.
- April 2026: Daifuku completed a new factory building at its Shiga Works in Japan for semiconductor production line storage systems, expanding cleanroom production capacity by 30%. The added capacity ties ASRS demand to semiconductor and electronics manufacturing requirements, where controlled environments and high uptime raise the value of automated storage and retrieval.
- April 2025: Daifuku launched a new manufacturing plant in India to address growing regional demand for material handling automation. The localization move supports shorter lead times and service responsiveness for Asia-Pacific projects as deployments expand beyond early adopters into broader manufacturing and logistics networks.


Automated Storage And Retrieval System (ASRS) Market Report Scope and Research Methodology
Market Definition and Coverage
This market is defined as the revenue generated from automated storage and retrieval systems that store, buffer, and retrieve materials in warehouses and factories through computer control, including core system hardware and the operating software needed to run it.
Scope exclusions (not counted): Basic racking, manual forklifts, and generic warehouse labor services that are not part of an AS/RS installation.
Segments Covered in This Report
- By Product Type
- Fixed-Aisle Crane Systems
- Shuttle-Based Systems
- Vertical Lift Modules (VLM)
- Carousel Modules (Vertical and Horizontal)
- Cube-Based / Robotic Cube Storage
- By Load Type
- Unit Load
- Pallet Load Shuttle
- Mini Load
- Mid Load
- Tote / Carton and Others
- By Application
- Storage and Buffering
- Goods-to-Person Order Picking
- Kitting and Sequencing
- Assembly / Production Support
- Cold-Storage and Deep-Freeze Handling
- By End-user Industry
- Manufacturing
- Automotive
- Food and Beverages
- Pharmaceuticals and Life Sciences
- Electronics and Semiconductor
- Metals and Machinery
- Non-manufacturing
- E-commerce and Retail
- Third-Party Logistics (3PL) and Warehousing
- Airports and Baggage Handling
- Defense and Government Stores
- Manufacturing
- By Geography
- North America
- United States
- Canada
- Mexico
- South America
- Brazil
- Argentina
- Rest of South America
- Europe
- Germany
- United Kingdom
- France
- Italy
- Russia
- Rest of Europe
- Asia-Pacific
- China
- Japan
- South Korea
- India
- ASEAN
- Rest of Asia-Pacific
- Middle East and Africa
- Middle East
- Saudi Arabia
- United Arab Emirates
- Turkey
- Rest of Middle East
- Africa
- South Africa
- Nigeria
- Rest of Africa
- Middle East
- North America
Data Sources, Market Sizing, and Validation
Desk Research
Desk research was used to set the base structure of the model and to anchor demand signals by geography and end-use. We relied on public sources such as the US Census Bureau manufacturing and trade tables, Eurostat industrial production series, UN Comtrade customs statistics, and national statistics offices for output and investment indicators tied to warehousing and factory automation.
To tighten assumptions around adoption and project intensity, we also reviewed materials from organizations such as the International Federation of Robotics, World Bank logistics indicators, and peer reviewed journals that cover intralogistics automation and warehouse design. Company annual reports, investor presentations, and reputable press releases were then used to cross-check product mix language and deployment patterns. These checks were supported by paid subscriptions focused on company financials and intelligence plus patent databases for technology direction. These sources are illustrative only, and many other references were used for data collection, validation, and clarification.
Primary Interviews and Surveys
Primary work focused on validating what an AS/RS deal typically includes, how pricing moves by configuration, and how order pipelines look across warehouse, logistics, and manufacturing users. We spoke with a mix of system suppliers, integrators, component providers, and end users across APAC, EMEA, and the Americas, and then used the feedback to close data gaps and confirm the final assumptions.
Distribution of primary research fieldwork respondents
| Company type | Respondent position | Region |
|---|---|---|
| Top tier: 34% | CXOs: 15% | APAC: 41% |
| Mid tier: 45% | Functional/Unit leaders: 31% | EMEA: 34% |
| Smaller Players: 21% | Managers: 54% | Americas: 25% |
Market-Sizing & Forecasting
Sizing starts with a top-down build where warehouse and factory investment signals are reconstructed into an addressable demand pool for automated storage projects, and then filtered by AS/RS penetration by end-use. After that, the totals are corroborated with selective bottom-up approximations, such as sampled project value ranges, system shipment indicators from supplier commentary, and channel checks on typical installed configurations, which are then used to adjust outliers.
Key inputs in the model include greenfield warehouse additions, modernization cycles in manufacturing plants, e-commerce fulfillment expansion, cold storage capacity additions, and typical system value by payload class and throughput needs. When the data was not available at a clean cut, we used ranges by application (goods-to-person order picking, buffering, kitting, and production support) and then normalized them through interview-validated mix assumptions.
Forecasts are built using scenario analysis supported by a light multivariate regression check, where drivers such as industrial production, logistics investment, and labor cost pressure were tested for direction and sensitivity. Final growth paths were reviewed against what respondents described as realistic lead times, project financing behavior, and the speed of commissioning in each region.
Data Validation & Update Cycle
Validation happens through a simple set of cross-checks that an analyst can repeat, then it is tightened through review. We compare outputs against independent signals like warehouse construction activity, automation investment commentary, and observed order backlogs, and then anomalies are investigated before sign-off.
If a variance is material, we re-contact selected respondents to confirm whether the shift is real or caused by a scope mismatch, currency timing, or a one-time project spike. The report is refreshed annually, and interim updates are done when major events occur, such as sharp capex changes or policy and trade shifts that impact industrial equipment spending. Before delivery, we run a final pass so clients receive the latest updated view.
Mordor Intelligence's Automated Storage and Retrieval System Market Sizing Compared With Other Published Estimates
It is normal to see different market values for AS/RS because researchers do not always count the same items, and they also do not anchor demand to the same activity indicators. The spread usually comes from differences in what is included in an AS/RS project, how software and integration are treated, and which year is used as the true base for currency conversion.
Some published estimates lean narrower by treating AS/RS mainly as equipment shipments, and some go broader by bundling wider warehouse automation hardware into the same number. In the Mordor Intelligence approach, the total is counted as AS/RS system revenue across core configurations, with scope kept tight so adjacent automation categories and unrelated warehouse infrastructure are not rolled in by default.
Benchmark comparison
| Source | Market Size | Gaps in Research Methodology |
|---|---|---|
| Mordor Intelligence | USD 11.39 B (2026) | |
| Industry Publisher A | USD 6.52 B (2024) | Uses an earlier base year and often reflects a tighter equipment-centric interpretation, which can leave out parts of system-level value that show up in full AS/RS deployments. |
| Industry Publisher B | USD 10.65 B (2025) | Uses a different base year and a longer forecast frame, and the mix of included system types and applications can shift the total if broader automation items are grouped under AS/RS in practice. |
The table shows that year choice and what is counted inside an AS/RS project are the main reasons the numbers do not line up. Our approach stays traceable by tying totals to clear demand drivers, then checking them against grounded project and pricing patterns so the final number can be replicated and explained.


Key Questions Answered in the Report
What is driving the strong growth of the automated storage and retrieval system market between 2026 and 2031?
Rapid e-commerce expansion, rising labor costs, urban real-estate constraints, and government incentives collectively fuel a 8.34% CAGR through 2031.
Which product technologies are gaining share fastest?
Cube-based and robotic storage systems are growing at 11.92% CAGR as they offer flexible, high-density solutions suited for micro-fulfillment and omnichannel operations.
Why is Asia-Pacific the fastest-growing regional market?
Massive state investments in robotics, acute labor shortages, and localized manufacturing capacity are propelling an 11.67% CAGR across China, Japan, Korea, and India.
How long is the typical payback period for ASRS projects?
Best-practice deployments achieve ROI within 18 months, but total cost of ownership can extend payback when software integration and training fees add 30%-50% to capital cost.
What cybersecurity risks affect ASRS operations?
Increased OT-IT convergence creates entry points for ransomware and network attacks; manufacturing recorded 68 OT incidents in 2023, with over half linked to ransomware.
Who are the leading vendors in the automated storage and retrieval system market?
Symbotic, AutoStore, Daifuku, SSI SCHAEFER, and Dematic dominate with a combined share slightly above 55%, leveraging integrated hardware-software portfolios and global service networks.
Page last updated on:





