Market Overview
| Study Period | 2020 - 2031 |
|---|---|
| Forecast Data Period | 2026 - 2031 |
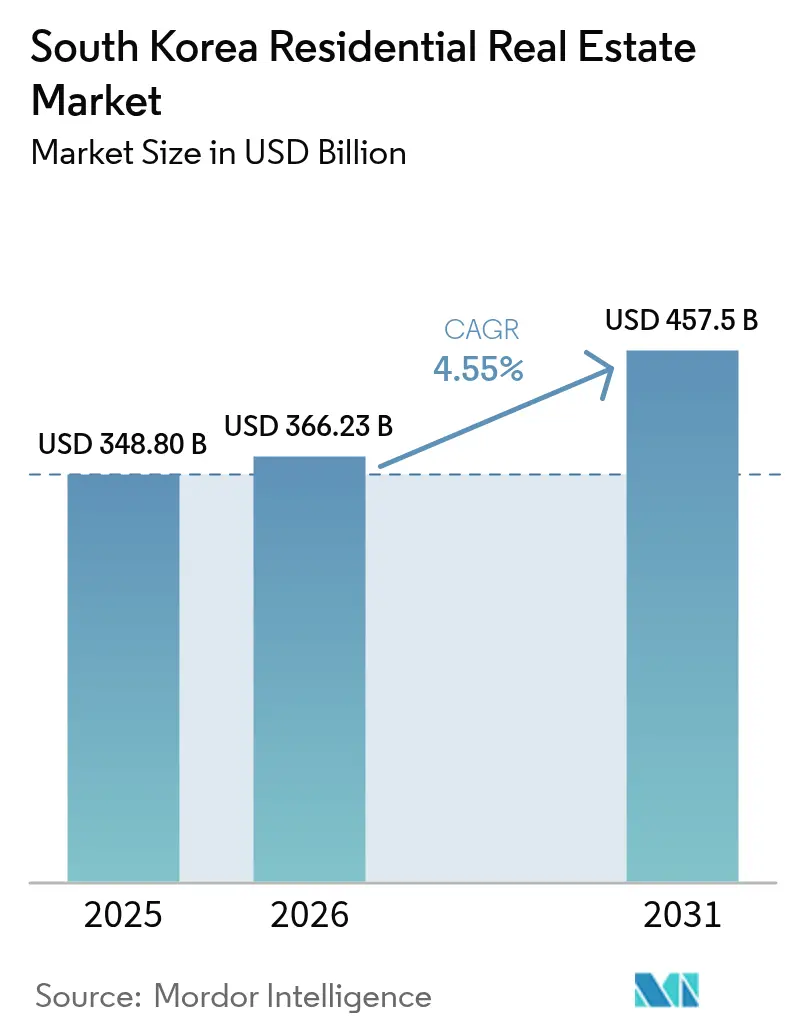
| Base Year Market Size (2025) | USD 348.80 Billion |
| Market Size (2026) | USD 366.23 Billion |
| Market Size (2031) | USD 457.5 Billion |
| Growth Rate (2026 - 2031) | 4.55% CAGR |
| Market Concentration | Low |
Major Players *Disclaimer: Major Players sorted in no particular order Image © Mordor Intelligence. Reuse requires attribution under CC BY 4.0. | |
South Korea Residential Real Estate Market Analysis by Mordor Intelligence
The South Korea residential real estate market size was valued at USD 348.8 billion in 2025 and estimated to grow from USD 366.23 billion in 2026 to reach USD 457.50 billion by 2031, at a CAGR of 4.55% during the forecast period (2026-2031). A decisive policy pivot toward institutionally managed rental housing, coupled with shifting household structures and carbon-neutral construction mandates, is redefining demand fundamentals. Single-person households continue to multiply, steering developers toward micro-studio formats and driving a premium for smart, energy-efficient units. Monetary tightening has lifted average mortgage rates above 4%, tilting buyer preference toward rentals and strengthening the case for build-to-rent platforms. In parallel, public-sector supply programs and REIT-friendly tax incentives are reducing barriers for large-scale landlords, while technology adoption—IoT energy monitoring and modular construction—lowers operating costs and accelerates project timelines.
Key Report Takeaways
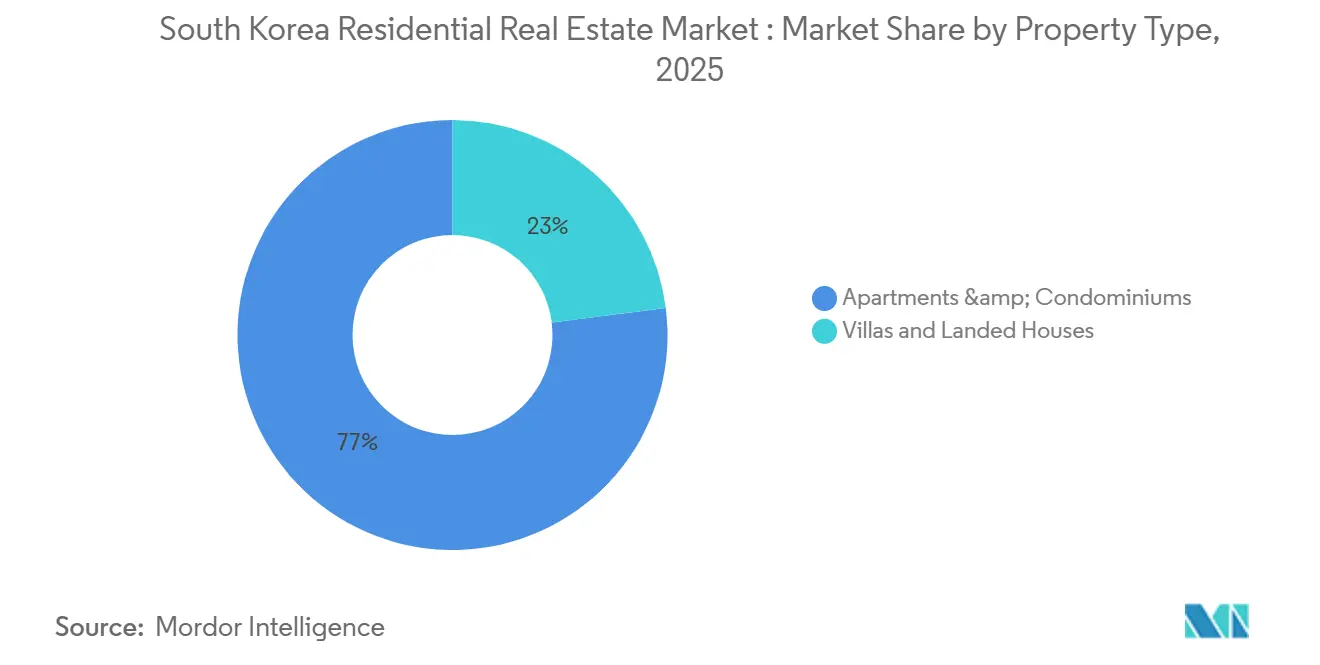
- By property type, apartments and condominiums held 77% of the South Korea residential real estate market share in 2025, while villas and landed houses are projected to expand at a 4.75% CAGR through 2031.
- By price band, the mid-market segment accounted for 63% of the South Korea residential real estate market size in 2025, whereas the affordable segment is expected to register a 4.69% CAGR to 2031.
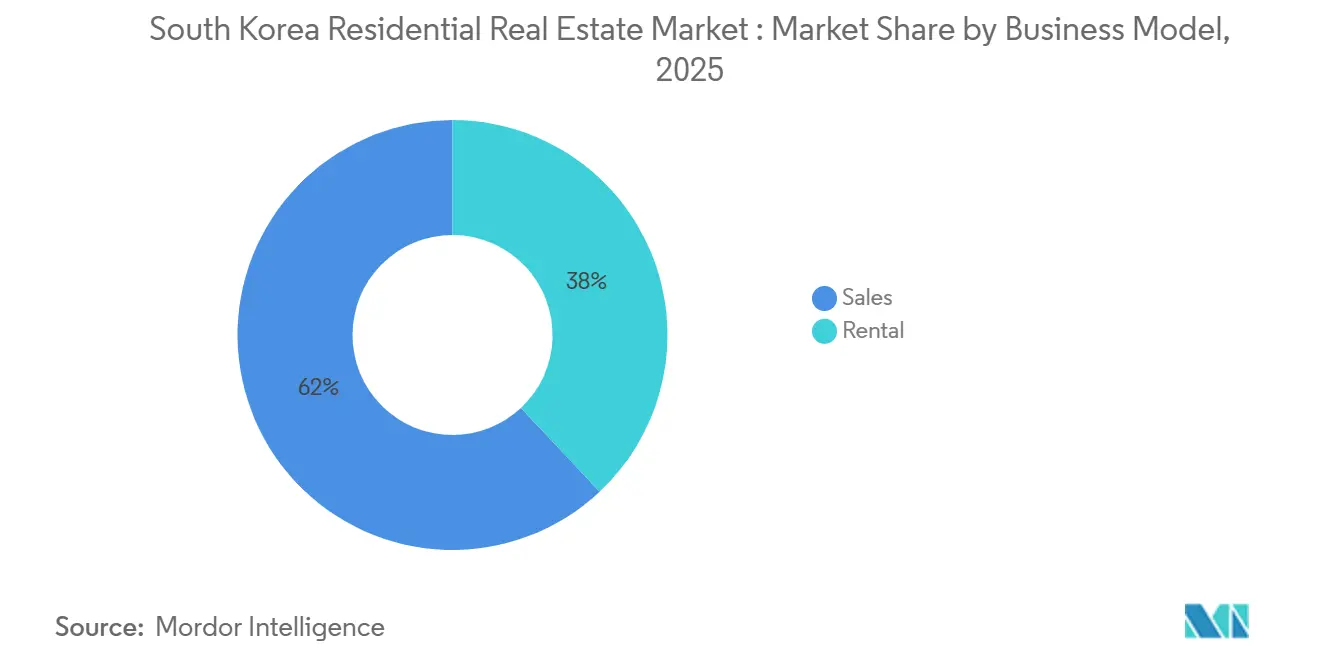
- By business model, sales accounted for 62.00% of the market in 2025, while the rental segment is projected to expand at a CAGR of 4.85% between 2026 and 2031, supported by rising preference for asset-light ownership and flexible usage models.
- By mode of sale, secondary transactions captured 65.21% of volume in 2025; primary sales are forecast to grow at 4.80% through 2031 as zero-energy code compliance boosts new-build appeal.
- By region, Seoul led with 41% revenue share in 2025, but Busan is forecast to advance at a 4.87% CAGR between 2026 and 2031.
Note: Market size and forecast figures in this report are generated using Mordor Intelligence’s proprietary estimation framework, updated with the latest available data and insights as of 2026.
South Korea Residential Real Estate Market Trends and Insights
Drivers Impact Analysis*
| Drivers | (~)% Impact on CAGR | Geographic Focus | Impact Timeline |
|---|---|---|---|
| Public-rental housing stability plan accelerates supply | +0.8% | National (Seoul, Incheon, Gyeonggi) | Medium term (2-4 years) |
| Rise in single-person households lifts demand for micro-units | +0.7% | Seoul, Busan, metro cores | Long term (≥ 4 years) |
| REIT tax cuts stimulate build-to-rent capital flows | +0.6% | Seoul, Gyeonggi, Incheon | Medium term (2-4 years) |
| Zero-energy code lifts premium for efficient new builds | +0.5% | National, early Seoul & Incheon | Medium term (2-4 years) |
| Smart-home retrofit subsidies spur renovation | +0.4% | Seoul, Gyeonggi, early Busan | Short term (≤ 2 years) |
| Fractional ownership platforms broaden retail access | +0.3% | National, digital hubs | Short term (≤ 2 years) |
| Source: Mordor Intelligence | |||
Public-Rental Housing Stability Plan Accelerates Supply Pipeline
The 2023-2028 program targets 270,000 new rental units annually and delivered 54,000 in 2025, easing shortages in transit-oriented corridors around Seoul and Incheon. Increased inventory is pushing private landlords to differentiate via amenities rather than pricing, while pension funds partner with Korea Land & Housing Corporation to secure long-dated cash flows under favorable REIT rules.
Rise in Single-Person Households Lifts Demand for Micro-Units
Population data show single-person households rising toward 9.24 million by 2050, translating into persistent appetite for studios below 40 m². Developers are re-stacking floor-plates—Samsung C&T allocated 35% of a recent Gangnam tower to micro-units—driving modular construction uptake and eroding Korea’s traditional lump-sum jeonse leasing structure.
REIT Tax Cuts Stimulate Build-to-Rent Capital Flows
June 2024 amendments lowered headline tax rates on residential REITs to 16%, prompting USD 4.2 billion of institutional commitments in 2025, a 38% year-on-year jump. Conglomerates are now shifting from sales-led models to rental portfolios that bundle smart services and predictive maintenance, raising tenant service benchmarks industry-wide.
Zero-Energy Code Lifts Premium for Efficient New Builds
The January 2024 carbon-neutral code requires new homes to offset 20% of annual consumption via on-site renewables. Higher construction costs are fully recouped: ZEB-compliant apartments in Songpa sold at 14-16% premiums in 2025, supported by green-mortgage discounts of up to 0.7 percentage points.
Restraints Impact Analysis*
| Restraints | (~) % Impact on CAGR | Geographic Focus | Impact Timeline |
|---|---|---|---|
| Mortgage rates stay above 4% after policy tightening | -0.6% | National, intense in Seoul & Gyeonggi | Short term (≤ 2 years) |
| Stricter DTI/LTV rules curb borrowing capacity | -0.5% | High-price metros | Medium term (2-4 years) |
| Shrinking working-age cohort limits long-run absorption | -0.4% | Nationwide, acute in tertiary cities | Long term (≥ 4 years) |
| 2025 property-tax revaluation inflates holding costs | -0.3% | Gangnam, Seocho, Songpa | Short term (≤ 2 years) |
| Source: Mordor Intelligence | |||
Mortgage Rates Remain Elevated
Policy rates at 3.5% keep average housing loans above 4%, forcing monthly payments on a USD 300,000 mortgage to absorb over 38% of median Seoul household income. The affordability squeeze redirects demand toward rentals and slows new project launches as developer IRRs compress.
Stricter DTI/LTV Rules Curb Borrowing
The September 2024 stressed-DSR framework tests borrowers 150 bps above current rates, trimming loan size eligibility by roughly 15%. Self-employed applicants and buyers of multiple units face steeper reductions, extending the tenure of “involuntary renters” who cannot bridge deposit gaps.
*Our forecasts treat driver/restraint impacts as directional, not additive. The impact forecasts reflect baseline growth, mix effects, and variable interactions.
Segment Analysis
By Property Type: Apartments Anchor Demand While Villas Regain Allure
Apartments and condominiums contributed 77% of 2025 value, underscoring Korea’s high-rise urban DNA[1]Korea Real Estate Board, “Residential Transaction Statistics,” REB.OR.KR. Regulatory focus on transit corridors continues to channel bulk supply into vertical formats, yet villas and landed houses are projected to grow at a 4.75% CAGR as families with school-age children and retirees migrate to lower-density suburbs in Gyeonggi and coastal Busan. Carbon-neutral standards broaden this gap: ZEB-compliant towers enjoy double-digit sale premiums, whereas villa developers offset higher per-unit green costs through modular panels and neighborhood solar hubs. The South Korea residential real estate market size for villas is comparatively small today, but fresh highway linkages slated for 2027 will compress commute times and lift suburban appeal.
Legacy high-rise stock built prior to 2010 struggles with efficiency shortfalls that depress resale values by 10-12% versus new builds. Retrofit grants are flowing first to high-density complexes, putting villas at a strategic crossroads: develop premium eco-enclaves or risk marginal relevance. Samsung C&T’s pilot villa cluster near Suwon, which embeds shared renewable micro-grids, illustrates how low-density formats can coexist with the nation’s net-zero roadmap.


By Price Band: Affordable Supply Gains Momentum
Units between USD 300,000 and USD 600,000 held 63% of 2025 turnover, cementing the mid-market as the backbone of urban transactions. Yet affordable stock under USD 300,000 is forecast to expand at a 4.69% CAGR, buoyed by public rentals and tax-advantaged lending. The South Korea residential real estate market share for affordable homes is climbing fastest in satellite cities where land costs remain manageable. LH Corporation devoted 68% of its 2025 pipeline to sub-USD 250,000 pricing, sparking rent compression for nearby private landlords.
Conversely, luxury product above USD 600,000 trails at a 4.20% CAGR as tighter DTI ceilings and elevated holding taxes temper speculative appetite. Even Gangnam’s luxury stratum saw 6% volume contraction in 2025, nudging institutional funds to scout price-friendly districts with healthier yields. Developers adapting flexible payment plans and offering fractional shares are partially cushioning sales slippage at the top end.
By Business Model: Rental Ascendancy Sustains Momentum
Ownership transactions still comprised 62% of market value in 2025, yet the rental model is advancing at a 4.85% CAGR through 2031, reshaping cash-flow dynamics across the South Korea residential real estate market size. Monthly wholesale contracts recorded an 18% year-over-year rise as elevated mortgage rates squeezed debt eligibility. Jeonse deposits are shrinking, eroding a historic capital channel for mom-and-pop landlords, while institutional portfolios thrive on predictable monthly income streams.
Policy is amplifying this rotation: REIT tax relief and the 270,000-unit annual public-rental target funnel capital toward rental schemes. Insurance companies and pension funds allocated 34% of 2025 residential commitments to Busan and Gyeonggi rentals, up from 22% two years earlier, mirroring geographically diversified yield-hunt behavior.
By Mode of Sale: New-Build Premium Widens
Resale homes made up 65.21% of closings in 2025, spotlighting the South Korea residential real estate market’s deep secondary pool. New-build transactions, however, are on track for a 4.80% CAGR, outstripping the 4.35% pace of resales as energy-efficient codes entice buyers chasing lower utility bills. Songpa’s 2025 launches fetched 14-16% price spreads over comparable pre-2010 stock, validating the willingness to pay for smart-ready, sustainable living.
Older inventory risks accelerated obsolescence without retrofit investment. In Seoul alone, 112,000 apartment units erected before 2000 will fail mandatory energy audits by 2028, risking valuation markdowns unless landlords tap into IoT retrofit subsidies. Meanwhile, demand for primary sales remains modest in tertiary cities where new-build pipelines are thinner, and affordability trumps efficiency.
Geography Analysis
Seoul maintained a commanding 41% slice of 2025 value, underpinned by its job density and transit infrastructure[2]Statistics Korea, “Regional GDP and Population Data,” KOSTAT.GO.KR. Nonetheless, its forward CAGR moderates to 4.20% as zoning constraints, higher taxes, and affordability strains stifle incremental uptake. Surrounding Gyeonggi Province benefits from spillover demand, charting a 4.50% growth path powered by subway extensions and 2027 expressway completions that trim commutes by nearly 20 minutes.
Busan emerges as the fastest-growing hub at a 4.87% CAGR through 2031. Port modernization, second-home demand from retirees, and preparation for the 2030 World Expo are invigorating both sales and rental markets, with median home prices roughly 45% below Seoul benchmarks. Incheon follows with a 4.60% trajectory as airport expansion attracts expatriate professionals. Secondary metros like Daegu and Gwangju lag at about 4.35%, hampered by youth out-migration and limited high-value employment, yet selective redevelopment around university clusters offers pockets of resilience.
Divergent rental yields accentuate the regional pivot: Seoul averages below 3%, whereas Busan and Incheon deliver 3.8-4.4%, prompting funds to rebalance portfolios. Subsidized green-mortgage schemes further widen the gap, as capital-hungry buyers chase incentive-linked projects beyond the capital’s pricey core.
Competitive Landscape
Market concentration is moderate. Korea Land & Housing Corporation anchors public-rental output, leaving conglomerates—Hyundai Development, Samsung C&T, GS E&C, Lotte E&C—to compete on technology integration and build-to-rent scale. REIT tax reform catalyzed USD 1.8 billion of build-to-rent pledges by Hyundai and Lotte in 2025, a stark pivot from earlier sales-centric pipelines.
Technology is the new battleground. GS E&C’s alliance with a Seoul IoT provider slashed operating costs by up to 9% across 12,000 units, while Samsung C&T’s modular factories trimmed per-unit expense by 15% and accelerated project cycles[3]Samsung C&T Investor Relations, “Modular Construction Roll-outs,” SAMSUNGCNT.COM. White-space innovation flourishes in suburban Gyeonggi and Busan, where developers test villa communities with shared e-mobility hubs and on-site childcare.
Fractional ownership platforms, backed by major builders, further fracture the traditional brokerage channel. Hyundai Development’s 2025 tokenized offering demonstrated how presales to retail investors can de-risk financing while offering sub-USD 10,000 entry tickets. Meanwhile, legacy landlords, pinched by higher property taxes, are offloading older assets to REITs seeking refurbishment opportunities at scale.
South Korea Residential Real Estate Industry Leaders
Booyoung Group
Korea Land and Housing Corporation.
Hyundai Development Company (HDC)
GS Engineering & Construction
Lotte Engineering & Construction
- *Disclaimer: Major Players sorted in no particular order

Recent Industry Developments
- February 2026: LH and Hyundai Development agreed to co-develop 8,400 rental units in Incheon and Gyeonggi, leveraging modular construction to deliver rents 15-18% below prevailing levels.
- January 2026: Samsung C&T clinched a USD 315 million contract for a ZEB-grade, 1,200-unit complex in Songpa featuring integrated smart-home systems and on-site solar.
- December 2025: GS E&C purchased a 340-unit Busan portfolio for USD 280 million, with retrofit plans aimed at 8-12% rent uplifts by 2027.
- November 2025: Lotte E&C and a proptech start-up launched a digital leasing platform to cut vacancy cycles by up to four weeks across 14,000 units.


Research Methodology Framework and Report Scope
Market Definitions and Key Coverage
Our study defines the South Korean residential real-estate market as the cumulative value of newly built and existing homes, apartments, condominiums, villas, and landed houses transacted for owner-occupation or long-term rental, monetized at prevailing market prices and tracked in Korean won before uniform USD conversion.
Scope Exclusion: Short-stay serviced apartments, officetels, and commercial or industrial premises are excluded to maintain a pure housing lens.
Segmentation Overview
- By Business Model
- Sales
- Rental
Detailed Research Methodology and Data Validation
Primary Research
Mordor analysts complemented documents with interviews and online surveys of developers, mortgage lenders, appraisal firms, buyer agents, and municipal planners across Seoul, Busan, Daegu, and emerging satellite cities. These conversations verified cost drivers, demand sentiment, and the realistic uptake of policy incentives, letting us fine-tune price and volume assumptions we had sketched from secondary data.
Desk Research
We began with structured desk work that pulled macro and micro housing indicators from authoritative public portals such as the Ministry of Land, Infrastructure and Transport (MOLIT), Statistics Korea (KOSIS), Bank of Korea monetary statistics, and Korea Housing Market Institute dashboards. Additional context on price dispersion and affordability arrived from OECD regional housing datasets, while regulatory shifts were mapped through National Assembly bill trackers and policy white papers. To enrich firm-level intelligence, D&B Hoovers and Dow Jones Factiva fed company filings and transaction news into our evidence pool. The sources cited illustrate the breadth of material consulted; many other credible publications supplemented fact-checking and interpretation.
Market-Sizing & Forecasting
We anchor the 2025 baseline through a top-down reconstruction that multiplies MOLIT-reported housing transaction counts by segment-specific average selling prices, then layers rental stock valuation using observed yield bands. Supplier roll-ups and sampled ASP-by-floor-area checks serve as bottom-up cross-tests before totals are locked. Key variables like household formation rates, urban migration flows, mortgage rate paths, construction completions, and government supply quotas feed a multivariate regression, whose coefficients are stress-tested under alternative inflation and credit scenarios. Data gaps in rural county figures were bridged by ratio-imputing from similar density clusters validated during lender discussions.
Data Validation & Update Cycle
Triangulation is iterative. Variance exceeding +/-5% against Bank of Korea collateral values or Korea Appraisal Board indices prompts analyst re-work. Draft outputs undergo senior review, after which the model is refreshed each year, with interim adjustments triggered by policy shocks, large land auctions, or material interest-rate shifts.
Why Mordor's South Korea Residential Real Estate Baseline Earns Trust
Published estimates often diverge because firms slice the market differently, employ dissimilar price proxies, or refresh numbers on uneven schedules.
Key gap drivers here include varying treatment of secondary-market resale value, inclusion or omission of rental stock capitalization, and the degree to which provincial cities are folded into national totals.
When others rely on single-source price trackers or static conversion rates, we apply blended ASP series and quarterly FX updates, and our annual refresh cadence captures fast-moving policy tweaks that shape buyer leverage.
Benchmark comparison
| Market Size | Anonymized source | Primary gap driver |
|---|---|---|
| USD 402.02 B | Mordor Intelligence | - |
| USD 248.31 B | Regional Consultancy A | Excludes rental segment and narrows scope to new-build sales in six metros |
| USD 85.42 B | Industry Journal B | Counts only developer-recorded transactions, omits secondary deals, uses conservative price discount |
In sum, our disciplined mix of transparent scope, multi-source variables, and dual-path validation delivers a balanced, reproducible baseline that decision-makers can depend on while remaining alert to evolving market realities.


Key Questions Answered in the Report
What is the current size of the South Korea residential real estate market?
The sector reached USD 366.23 billion in 2026 and is on track to hit USD 457.50 billion by 2031.
How fast is the rental segment growing compared with sales?
Rental value is projected to climb at a 4.85% CAGR during forecasted period.
Which region is forecast to expand the quickest?
Busan is poised for a 4.87% CAGR through 2031, buoyed by port upgrades and retiree demand.
What impact does the zero-energy building code have on pricing?
New ZEB-compliant apartments are selling at 14-16% premiums over older stock thanks to lower utility bills and green-mortgage incentives.
Page last updated on:


