Market Overview
| Study Period | 2020 - 2031 |
|---|---|
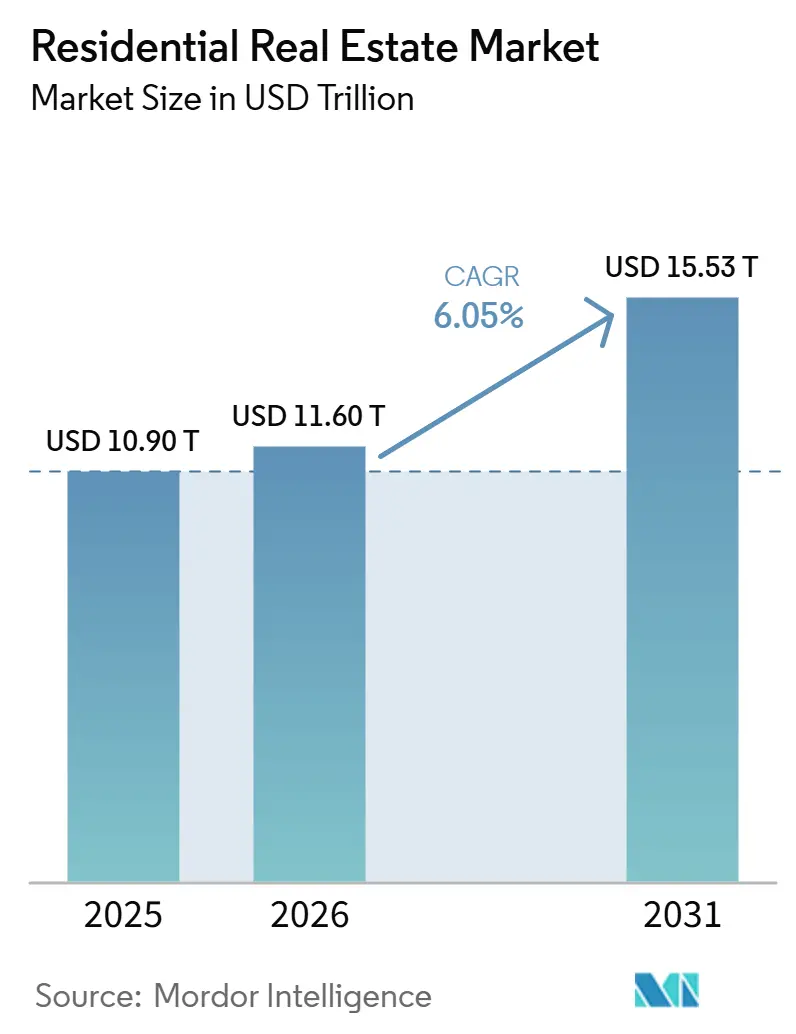
| Market Size (2026) | USD 11.60 Trillion |
| Market Size (2031) | USD 15.53 Trillion |
| Growth Rate (2026 - 2031) | 6.05% CAGR |
| Fastest Growing Market | Asia-Pacific |
| Largest Market | Asia-Pacific |
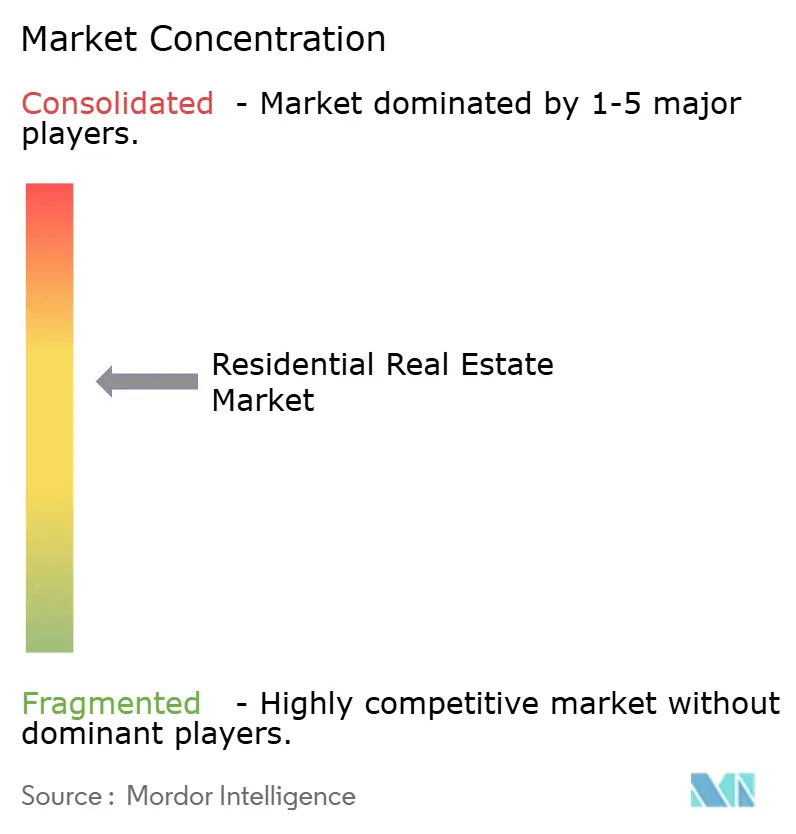
| Market Concentration | Medium |
Major Players *Disclaimer: Major Players sorted in no particular order Image © Mordor Intelligence. Reuse requires attribution under CC BY 4.0. | |
Residential Real Estate Market Analysis by Mordor Intelligence
The Residential Real Estate Market size is expected to grow from USD 10.90 trillion in 2025 to USD 11.60 trillion in 2026 and is forecast to reach USD 15.53 trillion by 2031 at 6.05% CAGR over 2026-2031.
Residential real estate market growth continues to draw from persistent housing undersupply in several large economies and policy-led acceleration of new construction, while institutional investment reshapes rental living and professionalizes operations at scale. Affordability pressure is redefining tenure choices in developed markets as price-to-income ratios and financing costs push first-time buyers toward rentals, widening the addressable base for multifamily and single-family rental platforms. Large public programs in India, Saudi Arabia, and Brazil are providing budget commitments, approvals reform, and mortgage support that stabilize pre-sales, de-risk delivery, and crowd in private capital for affordable and mid-market supply pipelines. In Europe, the revised Energy Performance of Buildings Directive is forcing an upgrade cycle across an older residential stock, tightening codes for newbuilds, and steering financing toward retrofits and low-emissions construction.[1]https://www.gov.br/pt-br
Key Report Takeaways
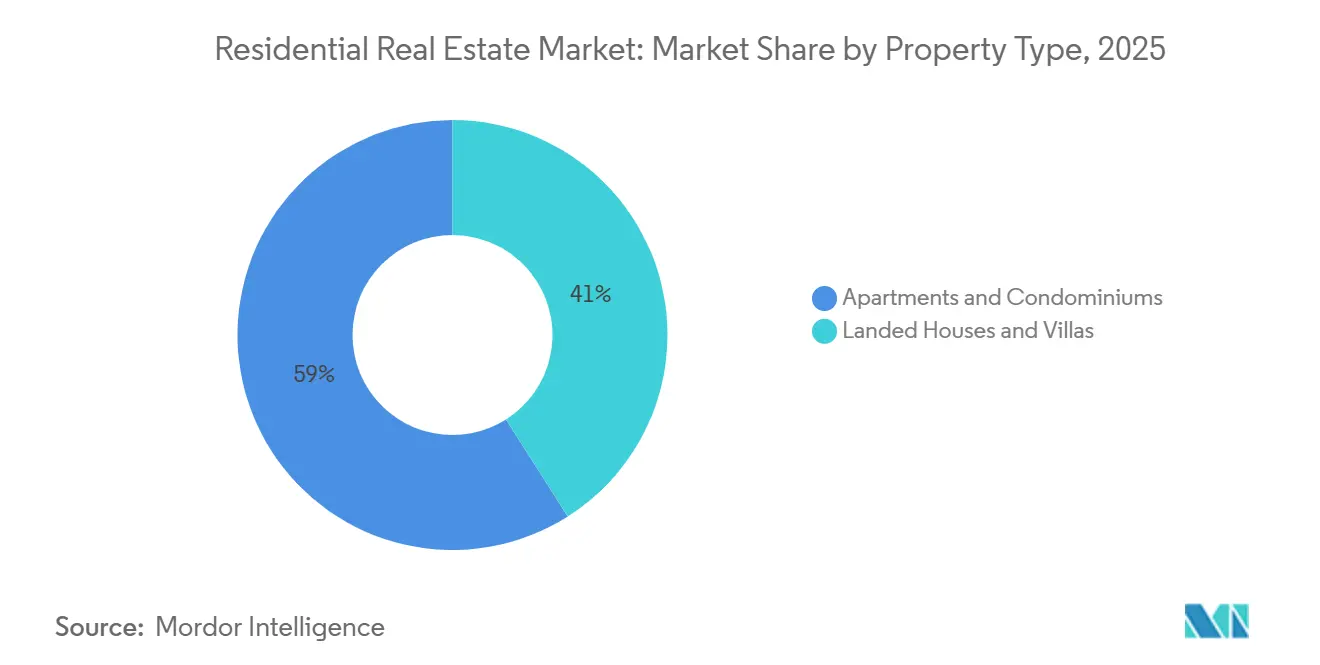
- By property type, apartments and condominiums led with a 59.0% residential real estate market share in 2025; villas and landed houses are expected to record a 6.23% CAGR during 2026–2031.
- By price band, mid-market accounted for 47.0% of 2025 volumes; luxury and super-prime are projected to expand at a 6.30% CAGR during 2026–2031.
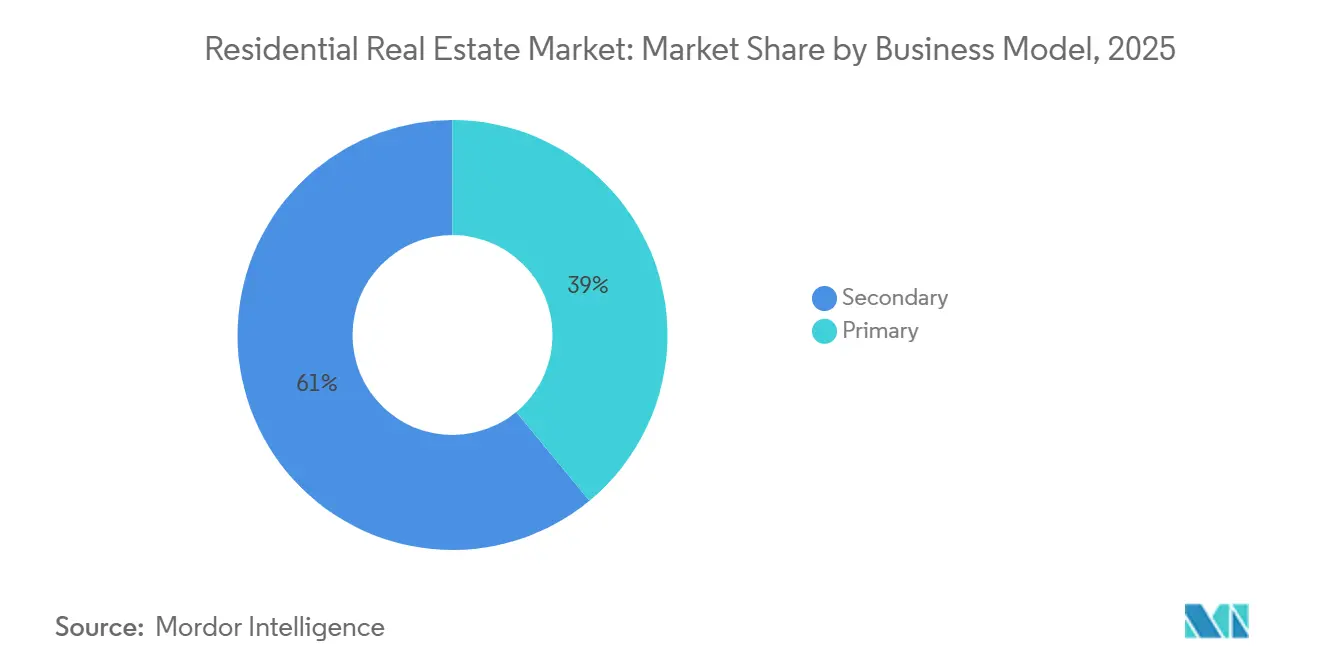
- By business model, the secondary market held a 61.0% share in 2025; primary sales are set to grow at a 6.66% CAGR through 2031.
- By mode of sale, outright sales captured 62.0% activity in 2025; rentals are forecast to grow at a 6.84% CAGR through 2031.
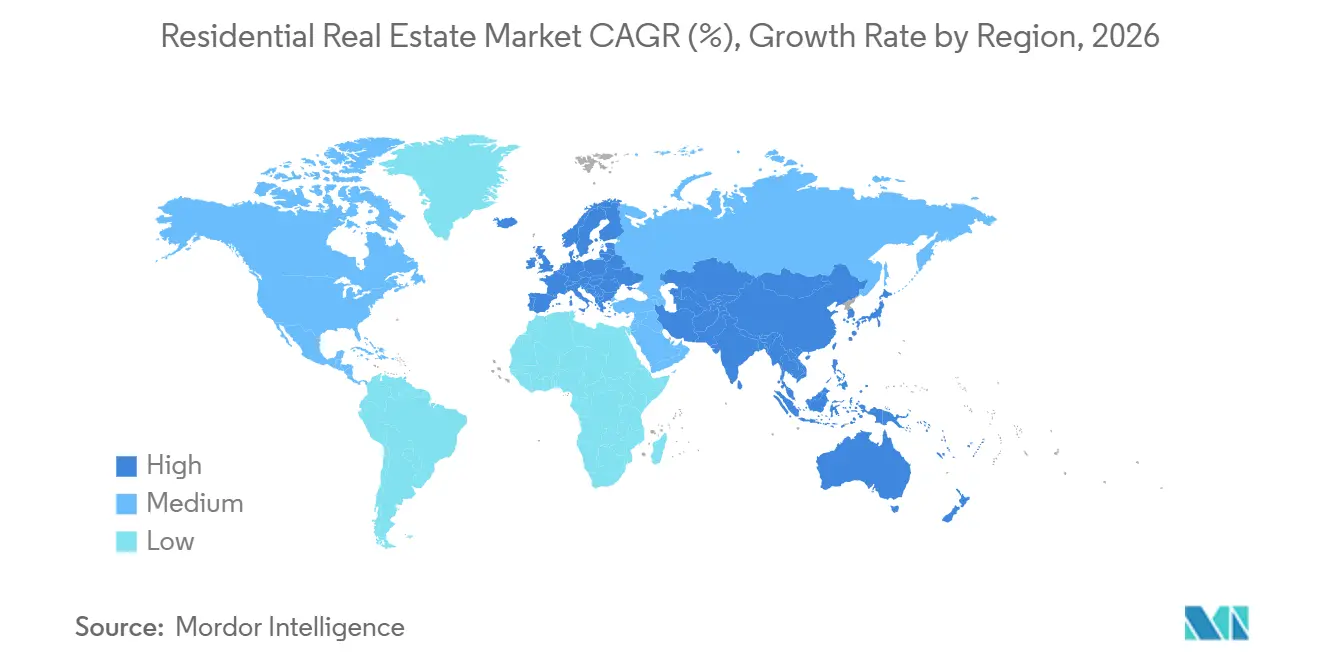
- By geography, Asia-Pacific led with 34.50% residential real estate market share in 2025; the region is also expected to post the fastest growth at 6.96% CAGR during 2026–2031.
Note: Market size and forecast figures in this report are generated using Mordor Intelligence’s proprietary estimation framework, updated with the latest available data and insights as of January 2026.
Global Residential Real Estate Market Trends and Insights
Drivers Impact Analysis*
| Drivers | (~) % Impact on CAGR Forecast | Geographic Relevance | Impact Timeline |
|---|---|---|---|
| Rapid urbanisation & middle-class expansion | +1.8% | Global, concentrated in APAC (India, Indonesia, Vietnam), Sub-Saharan Africa, and Latin America | Long term (≥ 4 years) |
| Institutional BTR & SFR capital inflows | +1.2% | North America & EU core markets, expanding to APAC hubs (Tokyo, Seoul, Singapore) | Medium term (2-4 years) |
| Wealth migration & second-home demand in tax-advantaged hubs | +0.9% | UAE, Portugal, Singapore, Monaco, selected Caribbean jurisdictions | Medium term (2-4 years) |
| Net-zero mandates driving green-retrofit premium | +0.7% | Europe & North America, emerging in Asia-Pacific | Long term (≥ 4 years) |
| Climate-risk migration reshaping housing pipelines | +0.6% | North America, Australia, EU | Long term (≥ 4 years) |
| Blockchain-enabled fractional ownership | +0.4% | UAE, Singapore, Switzerland, selective US states | Medium term (2-4 years) |
| Source: Mordor Intelligence | |||
Rapid Urbanisation & Middle-Class Expansion
The UN projects 68% of the global population will reside in urban areas by 2050, adding approximately 2.5 billion urban dwellers by that date, with 90% of this growth concentrated in Asia and Africa. In India alone, household formation is outpacing supply additions by an estimated 1.2 to 1.4 million units annually, compressing the country's housing deficit to critical levels despite government interventions such as the Pradhan Mantri Awas Yojana. Middle-class income thresholds are expanding fastest in Southeast Asian economies—Indonesia recorded a 23% rise in households earning above USD 5,000 annually between 2022 and 2025, directly fueling condominium absorption in Jakarta, Surabaya, and Bandung. This driver disproportionately benefits the mid-market price band, which commands 47% of the 2025 transaction share, yet it simultaneously tightens affordability ratios when wage growth lags property-price appreciation. Urbanisation's compound effect on land scarcity and infrastructure capex is pushing developers toward vertical-housing formats and transit-oriented developments, reshaping density norms in tier-2 and tier-3 cities. Policy frameworks such as India's Real Estate (Regulation and Development) Act, 2016 (RERA) and Indonesia's land-banking mandates are critical enablers that reduce project-delivery risk and attract institutional capital into previously informal markets.
Institutional BTR & SFR Capital Inflows
Institutional allocations to build-to-rent (BTR) and single-family rental (SFR) portfolios exceeded USD 85 billion globally in 2025, a 31% year-on-year increase, with North American platforms capturing 52% of that capital. Sovereign wealth funds and pension plans are treating rental housing as core infrastructure, drawn by inflation-linked cash yields averaging 4.5% to 5.8% net, regulatory stability, and demographic tailwinds such as delayed homeownership among millennials and Gen Z. In the EU, BTR supply now represents 18% of new multifamily completions in the UK and 11% in Germany, addressing a structural shortage of professionally managed rental stock that has depressed homeownership rates to multi-decade lows. Asia-Pacific is emerging as the next frontier: Japan's Ministry of Land, Infrastructure, Transport and Tourism approved BTR zoning incentives in 12 metropolitan zones in 2025, while South Korea's National Pension Service committed KRW 2.1 trillion (USD 1.6 billion) to domestic rental-housing funds. This capital is professionalizing asset management, embedding ESG standards, and pushing rental yields toward convergence with bond proxies, though it also intensifies competition with individual investors in secondary markets. Regulatory influence from bodies such as the Financial Conduct Authority (UK) and the Securities and Exchange Commission (US) ensures disclosure and tenant-protection compliance, further legitimizing the asset class for conservative allocators.
Net-Zero Mandates Driving Green-Retrofit Premium
The EU’s Energy Performance of Buildings Directive requires residential properties to reach EPC E by 2030 and C by 2033, impacting roughly 35 million homes and triggering an estimated EUR 275 billion retrofit investment cycle. In the UK, sub-E rental properties will face letting bans from 2025, tightening to EPC C by 2028, with early compliance already driving 7%–11% sale premiums for green-certified homes in major cities. California’s Title 24 mandates solar PV and battery-ready infrastructure for new single-family homes, adding USD 15,000–20,000 in upfront costs but supported by PACE financing and green-mortgage programs. Beyond regulation, retrofitting is reshaping capital allocation as institutional ESG frameworks penalize high-carbon assets with higher financing costs. Singapore’s 2024 Green Mark scheme offers up to 20% property-tax rebates for certified existing homes, accelerating adoption across aging housing stock. As a result, regulatory pressure is bifurcating asset valuations within micro-markets, creating upgrade-driven alpha opportunities for proactive investors.
Climate-Risk Migration Reshaping Housing Pipelines
Climate risk reshapes migration and pricing. US Census data show net domestic migration above 2.5% annually (2023–2025) into inland metros such as Boise, Spokane, and Raleigh-Durham, while coastal Florida counties recorded their first net outflows in three decades. Under FEMA’s Risk Rating 2.0, flood-insurance premiums in high-risk zones rose 300%–400%, reducing sales velocity by 18% in affected ZIP codes. In Australia, CoreLogic reports 12%–15% valuation discounts in bushfire-prone areas of New South Wales and Victoria versus inland comparables, despite rising national prices. Developers are redirecting capital toward climate-resilient corridors, with US single-family permits up 22% year-on-year in the Great Lakes and upper Southeast in 2025, while California coastal permits declined 9%. This under-recognized shift is embedding climate resilience into valuation frameworks and will increasingly influence regional price hierarchies, infrastructure planning, and development strategies.
Restraints Impact Analysis*
| Restraints | (~) % Impact on CAGR Forecast | Geographic Relevance | Impact Timeline |
|---|---|---|---|
| Global housing-affordability crisis | -1.5% | Global, most severe in developed markets | Short term (≤ 2 years) |
| Rising policy rates & tighter credit standards | -1.1% | North America & Europe, spreading globally | Short term (≤ 2 years) |
| Construction-labour shortages & material-cost volatility | -0.8% | Global, acute in North America and Europe | Medium term (2-4 years) |
| Hybrid-work vacancy drag in urban cores | -0.6% | Major metropolitan areas globally | Medium term (2-4 years) |
| Source: Mordor Intelligence | |||
Global Housing-Affordability Crisis
Housing affordability across OECD markets reached historic stress levels in 2025, with the median house-price-to-income ratio rising to 8.7×, led by Sydney (13.2×), Toronto (11.8×), and Auckland (10.9×). In the UK, first-time buyers now require 5.8 years of gross income to fund a 15% deposit, up from 3.2 years in 2010, pushing younger households into the private-rental sector. Hong Kong’s ratio eased marginally to 18.8× but remains prohibitive, with subsidised homeownership waitlists exceeding 280,000 applications. Governments are responding with affordability controls—foreign-buyer restrictions, vacant-home taxes, tighter loan-to-value limits, and the removal of interest-only mortgages—dampening transaction volumes and speculative demand. Intergenerational transfers now fund roughly 38% of UK first-time purchases, reinforcing inequality and constraining market mobility. These pressures weigh most heavily on entry- and mid-market segments, which represent over 60% of unit volumes, and are likely to persist absent sustained wage growth or meaningful supply-side reform.
Rising Policy Rates & Tighter Credit Standards
Central bank rate hikes and stricter mortgage underwriting are reducing purchasing power and transaction volumes across most developed economies. The US Federal Reserve held rates between 5.25% and 5.50% through mid-2025, pushing 30-year fixed mortgage rates above 7%, the highest sustained level since 2001, and contributing to a 19% decline in existing home sales versus 2022. The European Central Bank maintained policy rates at 4.0% in 2025, tightening credit availability in markets like Germany and France, where adjustable-rate mortgages dominate, and monthly payments jumped 28% to 35% for new borrowers. Emerging economies with dollar-pegged currencies faced compounded pressure—UAE mortgage rates climbed from 3.5% in 2021 to 6.2% in 2025, cooling Dubai's transaction volumes by 14% despite strong wealth-migration demand. Lenders simultaneously tightened standards: UK banks reduced maximum loan-to-income multiples from 5.5× to 4.5× for the majority of applicants, and Australian regulators mandated stress-testing at 3 percentage points above the actual rate. These combined forces are compressing first-time buyer cohorts and extending holding periods, dampening turnover and slowing price appreciation even in supply-constrained markets.
*Our forecasts treat driver/restraint impacts as directional, not additive. The impact forecasts reflect baseline growth, mix effects, and variable interactions.
Segment Analysis
By Property Type: Vertical Living Gains While Horizontal Sprawl Targets Wealth
Apartments and condominiums accounted for 59.0% of the 2025 global total, the largest slice of residential real estate market share by product type, supported by higher land-use efficiency in dense urban centers and continued demand in gateway cities. This concentration reflects the economics of height in core districts, with master developers using larger towers to spread land costs and maintain acceptable project margins even as input inflation persists. Villas and landed houses remain the fastest-growing category, with a 6.23% CAGR expected during 2026–2031 as affluent buyers seek more space, privacy, and the lifestyle benefits of low-density neighborhoods. Select Gulf markets continue to prioritize horizontal communities that blend private plots with club amenities, which has reinforced premium absorption at the upper end of the residential real estate market. Developers in India have scaled villa formats in high-demand leisure and suburban submarkets, aiming to capture non-resident and upgrade demand as mortgage availability remains supportive for higher-income households.
The growth of townhouses and duplexes in North America and Europe illustrates the rise of “missing middle” formats, which add units within established neighborhoods without high-rise typologies. Modular and manufactured solutions have improved build speed and cost predictability for select programs, supporting affordability targets where standardization and procurement scale lower unit economics. Quality standards and energy codes have also converged, with developers investing in envelope performance, HVAC efficiency, and air-tightness metrics that reduce operating costs for residents. With supply concentrated in vertical formats and demand diversifying, the residential real estate market offers distinct value propositions across built forms that will continue to shape pricing and absorption patterns by location and income band.[2]https://www.emaar.com/


By Price Band: Mid-Market Volumes Anchor Scale While Luxury Outpaces on Margin Velocity
The mid-market represented 47.0% of 2025 unit volumes, giving it the largest contribution to the residential real estate market size by price band as builders prioritize functional layouts and dependable commute access for dual-income households. Branded strategies that package popular finishes and smart home features at accessible price points continue to capture elastic demand when combined with targeted financing incentives. Price-sensitive absorption improves when monthly payments drop through rate buydowns or smaller price adjustments, and that responsiveness has made the mid-market a primary focus for inventory turns in several large metros. Developers are aligning product mix with local income distributions, which has produced more stable pre-sales profiles in markets with strong employment nodes and established school districts.
Luxury and super-prime segments in the residential real estate market are forecast to grow at a 6.30% CAGR during 2026–2031, supported by cash-rich buyers, branded residences, and international capital that seeks trophy assets, residency pathways, and inflation hedges. Sales campaigns for premium launches in India and the UAE demonstrate the speed of uptake when branding, location, and amenity programming align with high-net-worth preferences. In the same period, subsidized affordable housing pipelines remain central in emerging markets, where programmatic support reduces funding costs and ensures demand for targeted brackets. Builders in those programs have emphasized industrialized construction to maintain unit margins while meeting delivery timelines, proving that cost control is compatible with quality standards at scale.[3]https://ri.tenda.com/en
By Business Model: Primary Sales Surge on Builder Incentives While Secondary Volumes Stagnate
The secondary market accounted for 61.0% of 2025 transactions, the largest portion of the residential real estate market size measured by sales channel, reflecting a deep base of existing stock and slower listings turnover under lock-in effects. At the same time, primary sales are expected to grow at a 6.66% CAGR through 2031 as builders deploy aggressive incentives, including rate buydowns and closing credits that pull forward demand at ready-to-move communities. In the U.S., leading platforms reported high capture rates on in-house mortgage and title, improving customer conversion and providing more levers to manage affordability at the point of sale. Builders have accepted lower near-term margins in exchange for faster inventory turns, while continuing to optimize controlled lots to reduce land risk cycle-to-cycle.
In several large Indian metros, primary sales dominate where developers front-load pre-sales and use construction-linked payment plans that create predictable cash flows and incentivize timely progress. Brazil’s programmatic loan structures have also sustained primary launches and sales, channeling subsidized mortgages to eligible buyers and improving developer working capital positions. These dynamics suggest that the residential real estate market will continue to show a mix shift toward new-build in jurisdictions where incentives, approvals, and subsidy frameworks align with demand and where resale inventory remains tight.
By Mode of Sale: Rentals Outpace Ownership on Flexibility Premium and Institutionalization
Outright sales captured 62.0% of 2025 activity, the largest share by tenure mode within the residential real estate market, reflecting cultural preferences and wealth-building objectives across several regions. Rentals are projected to grow at a 6.84% CAGR to 2031, supported by affordability constraints, delayed household formation, and the emergence of institutionally managed stock that offers consistency in operations and service. Portfolio operators have invested in technology, maintenance systems, and customer service models that reduce friction and stabilize occupancy, making rentals competitive against ownership on total cost and convenience. Builders have also created rental-focused platforms to address demand from families seeking single-family layouts without ownership commitments.
Market rules on tenancy and rent caps vary by jurisdiction, but greater clarity on landlord-tenant rights and standardized enforcement are drawing more institutional capital to rental strategies. In select Asian markets, the shift from legacy deposit-based models to monthly rental frameworks has increased demand for professionally managed living, often within mixed-use districts that blend housing with work and lifestyle amenities. As builders, operators, and lenders align around durable rental yields and service standards, the residential real estate market is likely to see deeper pools of capital for multifamily and single-family rental assets in gateway and secondary cities alike.
Geography Analysis
Asia-Pacific held 34.50% of global activity in 2025 and is set to grow at a 6.96% CAGR during 2026–2031, making it both the largest and the fastest-growing region in the residential real estate market. Policy-backed delivery in India remains a core pillar, with PMAY-Urban 2.0 underpinning demand through interest subsidies, approval reforms, and transparent tracking of project milestones. In China, state-owned developers have gained share as they absorb pipeline and support stability in premium urban districts, while nationwide volumes continue to rationalize. Japan’s urban markets maintain steady rent growth and long-duration mortgage products at low rates, supporting transactional resilience. Australia’s tight rental markets reflect sustained migration and supply frictions, reinforcing development interest where feasibility holds. Across Southeast Asia, integrated townships are scaling to capture employment-led urbanization and household formation, bolstering mid-market and starter-home demand in key corridors.[4]https://mohua.gov.in/
North America is navigating a sizable supply gap and persistent affordability challenges, but rate stabilization and incentives on new-builds are helping to unlock transactions in the residential real estate market. Builders continue to price to market with financing support, seeking inventory turns that offset margin pressure and shifting focus toward community segmentation by buyer profile. In the U.S., regulatory constraints and long approval cycles are still binding in many jurisdictions, which limits supply elasticity and slows rebalancing in constrained metros. Canada’s major cities remain undersupplied as population growth and immigration sustain household formation, while policy and stress-test rules influence buyer capacity. Mexico’s regional growth benefits from nearshoring-driven jobs in manufacturing hubs, channeling demand into the workforce and mid-market housing in several industrial corridors.
Europe faces a twin imperative to retrofit aging stock and tighten standards for new-builds under the EPBD, creating both cost pressure and a large, investable upgrade pipeline within the residential real estate market. Landlords investing in energy efficiency report better net operating income through lower tenant utility costs and small rent premiums, strengthening the long-run case for modernization. Living-sector investment remains a favored allocation for institutions seeking defensive, inflation-linked cash flows across residential, student housing, and senior living. In the Middle East and parts of Africa, Saudi Arabia’s Vision 2030 and active housing programs have advanced ownership goals while continuing to expand delivery capacity and eligibility for support. The United Arab Emirates continues to attract international buyers to master planned communities and branded residences, supported by long-term residency options and investment-friendly rules. Brazil anchors South America’s activity through Minha Casa Minha Vida, where expanded eligibility and revised caps sustained launches and sales in 2025, supporting a diverse range of price points.

Competitive Landscape
Global delivery remains fragmented outside a small cohort of very large builders, with many regional and local developers contributing meaningful volumes in their submarkets across the residential real estate market. Leading U.S. platforms have built vertically integrated models in land development, mortgage, and title, lifting capture rates and providing more control over affordability levers during sales cycles. Faster construction cycle times, tighter working capital management, and digital engagement tools are central to improving inventory turns and maintaining return on equity through different macro environments. These operational strategies, paired with selective geographic diversification and brand segmentation by buyer need, have supported share gains in the new-home segment.
Several leaders in the residential real estate market have also expanded into rental strategies to meet demand for move-in-ready communities without ownership commitments, using SFR and build-to-rent to diversify income and accelerate cash conversion. Institutional buyers continue to acquire stabilized pools, and some builders monetize rental communities through bulk sales rather than holding long-term, reducing capital intensity while keeping development pipelines active. In Europe, large landlords have prioritized modernization and decarbonization, investing in building envelopes and heat systems that improve tenant experience and long-run portfolio performance.[5]https://investor.drhorton.com/
At the premium end, brands and partnerships with hospitality operators or design houses have gained traction, particularly in the UAE and India, where branded residences reinforce pricing and speed of sale within the residential real estate market. Developers continue to launch phased master plans that integrate housing with retail, leisure, and office components to strengthen absorption and capture destination premiums. Across all price bands, the competitive bar is rising on energy performance, technology integration, and customer service as buyers place greater weight on total cost of ownership and lifestyle quality.
Residential Real Estate Industry Leaders
D.R. Horton, Inc.
Lennar Corporation
PulteGroup, Inc.
NVR, Inc.
Toll Brothers, Inc.
- *Disclaimer: Major Players sorted in no particular order

Recent Industry Developments
- December 2025: Aldar Properties and Mubadala Capital launched Aldar Capital, an investment management platform headquartered in Abu Dhabi Global Market, targeting USD 1 billion for its inaugural fund in 2026 to channel global institutional capital into residential and infrastructure opportunities across the UAE and wider GCC region.
- November 2025: Brazil’s Minha Casa Minha Vida program revised subsidy structures and property-value caps, increasing limits in large metropolitan areas and expanding eligibility to middle-income bands to unlock additional demand and sustain developer launches.
- October 2025: D.R. Horton acquired SK Builders, strengthening its presence in high-growth South Carolina metros and reinforcing scale advantages in entry-level housing.
- June 2025: KKR acquired a USD 2.1 billion multifamily portfolio spanning 5,200 units across 18 Class A properties in California, Florida, and Texas, reinforcing its conviction in high-growth metros.


Research Methodology Framework and Report Scope
Market Definitions and Key Coverage
Our study defines the residential real estate market as the annual dollar value of completed ownership transfers and formal rental contracts for dwellings that are legally zoned for human habitation, including single-family houses, villas, townhomes, cooperatives, apartments, and condominiums, across primary (new-build) and secondary (existing-home) channels.
Scope exclusion: Land banking, off-plan raw land deals, timeshares, informal rental agreements, and corporate staff housing lie outside the present scope.
Segmentation Overview
- Sales
- Rental
Detailed Research Methodology and Data Validation
Primary Research
Mordor analysts conduct semi-structured interviews and surveys with developers, brokerage heads, mortgage lenders, and institutional landlords across Asia-Pacific, North America, Europe, Latin America, and the GCC. These exchanges validate absorption rates, typical price-per-square-meter bands, build-to-rent yields, and construction lead times, enabling us to refine assumptions that secondary data alone cannot illuminate.
Desk Research
Analysts begin by aggregating publicly available building completions, housing-transaction filings, mortgage-registry feeds, and census-level household data issued by bodies such as the World Bank, UN DESA, the U.S. Census Bureau, Eurostat, and major central banks. Industry associations and housing ministries supply price indices and inventory pipelines, while 10-K filings, investor decks, and press archives accessed through Dow Jones Factiva and D&B Hoovers contextualize corporate exposure. Additional insights come from trade portals, patent trends on prefabrication systems, and customs data on key inputs like cement and steel. This source list is illustrative rather than exhaustive; many other repositories inform the desk review.
Market-Sizing & Forecasting
A top-down model converts national transaction registers and rental-value pools into regional totals, normalized for currency, inflation, and shadow-market leakage. Select bottom-up checks, including developer sales roll-ups, portal traffic-to-closing ratios, and sampled average-selling-price times unit volumes, are then overlaid to reconcile gaps. Key drivers embedded in the model include housing starts, median mortgage rates, urban household formation, construction cost indices, cross-border capital flows, and policy incentives such as first-time-buyer subsidies. Forecasts leverage a multivariate regression blended with ARIMA for price trajectories, producing baseline, conservative, and accelerated scenarios; inputs are benchmarked with expert consensus before finalization.
Data Validation & Update Cycle
Each draft passes a two-level peer review that flags anomalies against macro indicators and independent sector metrics. Discrepancies trigger re-contacts with data owners. The global dataset refreshes annually, with interim flashes when material events, such as rate shocks, major housing programs, or regulatory shifts, alter market direction. Before release, a fresh analyst pass ensures clients receive the most current view.
Why Mordor's Residential Real Estate Baseline Commands Reliability
Published estimates often diverge because firms vary in scope, variable selection, and refresh cadence. Some tally only new-home sales, others track listed property stock, while a few rely on price-index proxies that overlook rental flows.
Key gap drivers include Mordor's inclusion of both rental and ownership turnover, our unit-level currency normalization, and an annual refresh against live transaction feeds; alternate publishers may apply static cost-per-unit multipliers, omit rental value, or update infrequently, leading to sizeable variance.
Benchmark comparison
| Market Size | Anonymized source | Primary gap driver |
|---|---|---|
| USD 11.59 trn (2025) | Mordor Intelligence | |
| USD 10.64 trn (2024) | Global Consultancy A | Excludes rental contracts; relies on regional ASP averages without currency re-indexing |
| USD 1.46 trn (2024) | Trade Journal B | Tracks only professionally managed stock and new completions, omitting secondary sales and informal markets |
Taken together, the comparison shows that while headline numbers vary widely, Mordor's disciplined mix of broad scope, dual-track modeling, and frequent updates provides a balanced, transparent baseline that decision-makers can trace back to clear variables and replicable steps.


Key Questions Answered in the Report
Why is institutional capital moving into housing now?
Institutional investors are reallocating from low-yield commercial assets into the global residential real estate market, where stable occupancy and inflation-linked rent growth promise superior risk-adjusted returns.
Which region offers the strongest near-term growth?
Asia-Pacific leads with a 6.96% CAGR through 2031, supported by urbanisation, rising middle-class incomes, and proactive infrastructure spending recorded across China, India, and Southeast Asia.
How are net-zero rules affecting valuations?
Properties that already meet rigorous efficiency codes command rent and price premiums, while non-compliant stock faces retrofit costs that can erode value, particularly in Europe and North America.
Will higher interest rates derail housing demand?
Tighter credit is slowing ownership transactions but simultaneously boosting rental demand, sustaining overall revenue growth for the global residential real estate market despite headwinds.
How severe is the global housing shortage?
Shortfalls vary by market: the United States lacks up to 3.8 million units, Germany could be short 1 million by 2027, and Australia is targeting 1.2 million new homes in five years, underscoring widespread supply gaps that underpin long-run demand.
Page last updated on:


