
Market Overview
| Study Period | 2021 - 2031 |
|---|---|
| Market Size (2026) | USD 7.56 Billion |
| Market Size (2031) | USD 9.59 Billion |
| Growth Rate (2026 - 2031) | 4.87 % |
| Fastest Growing Market | Asia-Pacific |
| Largest Market | Asia-Pacific |
| Market Concentration | Medium |
Major Players *Disclaimer: Major Players sorted in no particular order Image © Mordor Intelligence. Reuse requires attribution under CC BY 4.0. | |
Instrument Transformer Market Analysis by Mordor Intelligence
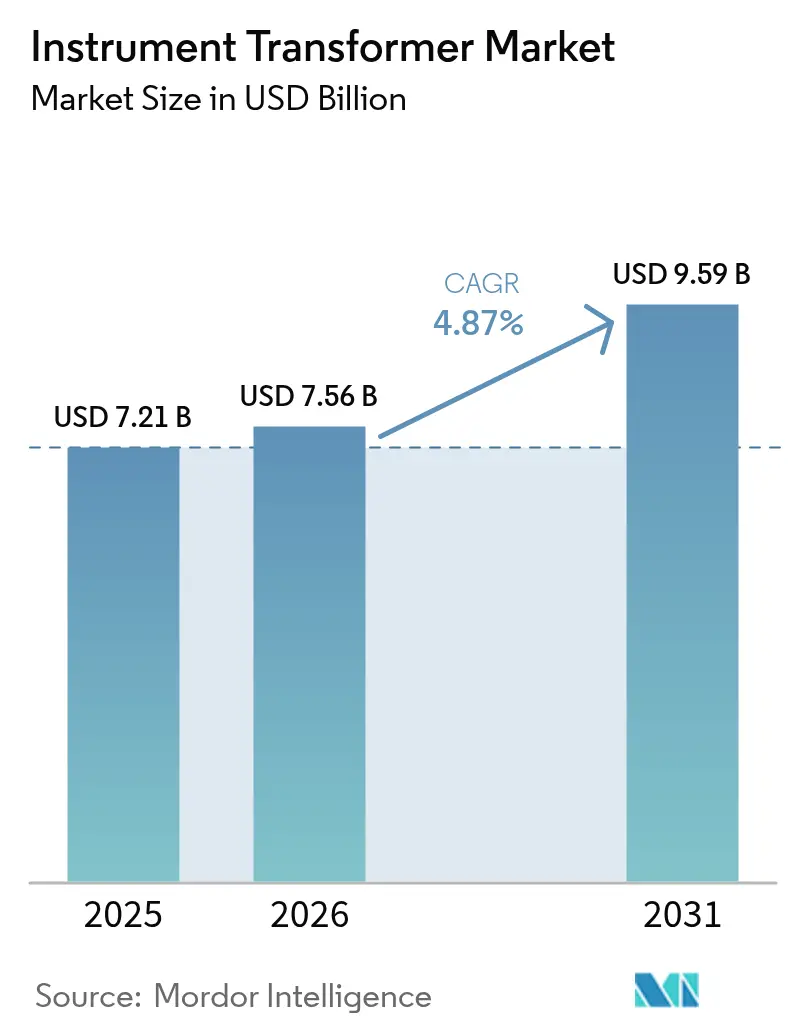
The Instrument Transformer Market size was valued at USD 7.21 billion in 2025 and estimated to grow from USD 7.56 billion in 2026 to reach USD 9.59 billion by 2031, at a CAGR of 4.87% during the forecast period (2026-2031).
Grid modernization spending, hyperscale data center additions, and renewable integration programs anchor this expansion. Utilities continue to specify high-accuracy devices that enable synchrophasor-based protection schemes, while data center developers demand compact sensors that fit within constrained switchgear lineups. Accelerating investments in ultra-high-voltage transmission, notably in China and India, are creating multi-year procurement pipelines for 800 kV and 1,000 kV units. Lead times that now exceed 60 weeks for many magnetic designs have handed pricing power to established manufacturers, yet they have also spurred interest in electronic current and voltage sensors that reduce copper and steel content. The steady rollout of IEC 61850 digital substations is driving demand for process-level merging units that interface seamlessly with electronic transformers, positioning vendors with software competencies to capture additional revenue streams.
Key Report Takeaways
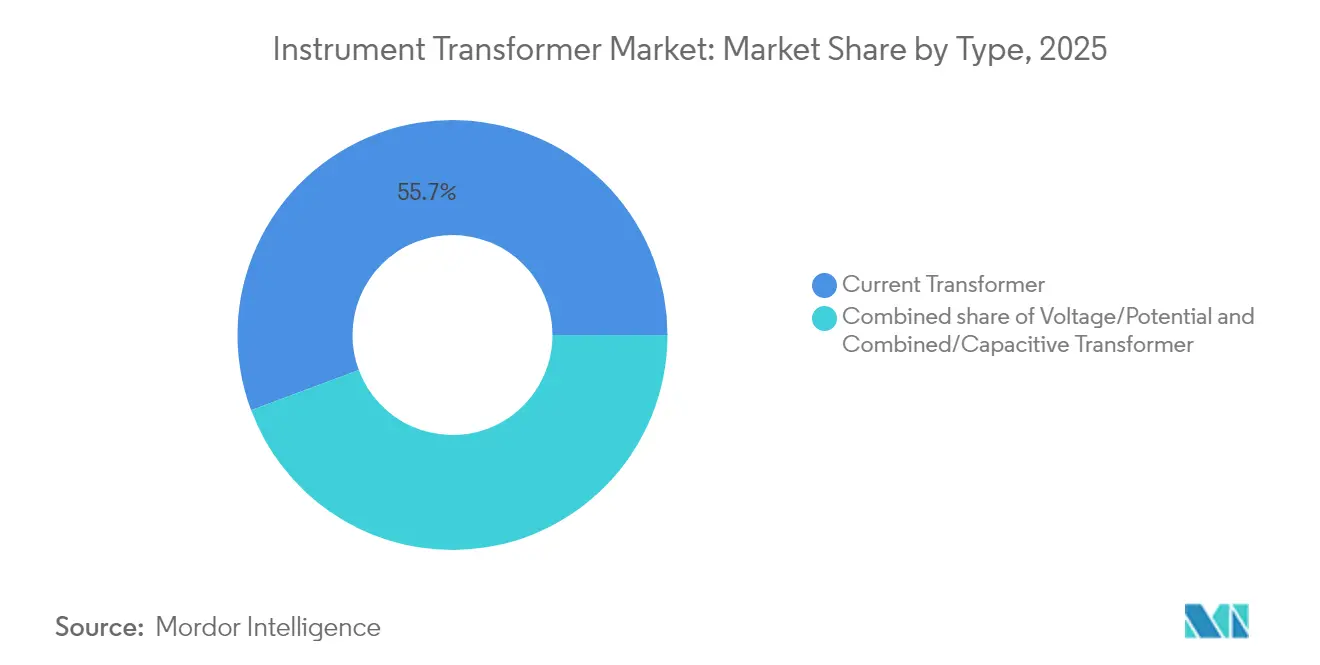
- By type, current transformers led the instrument transformer market with 55.70% of the market share in 2025. Combined/capacitive transformers are forecast to expand at a 7.08% CAGR through 2031.
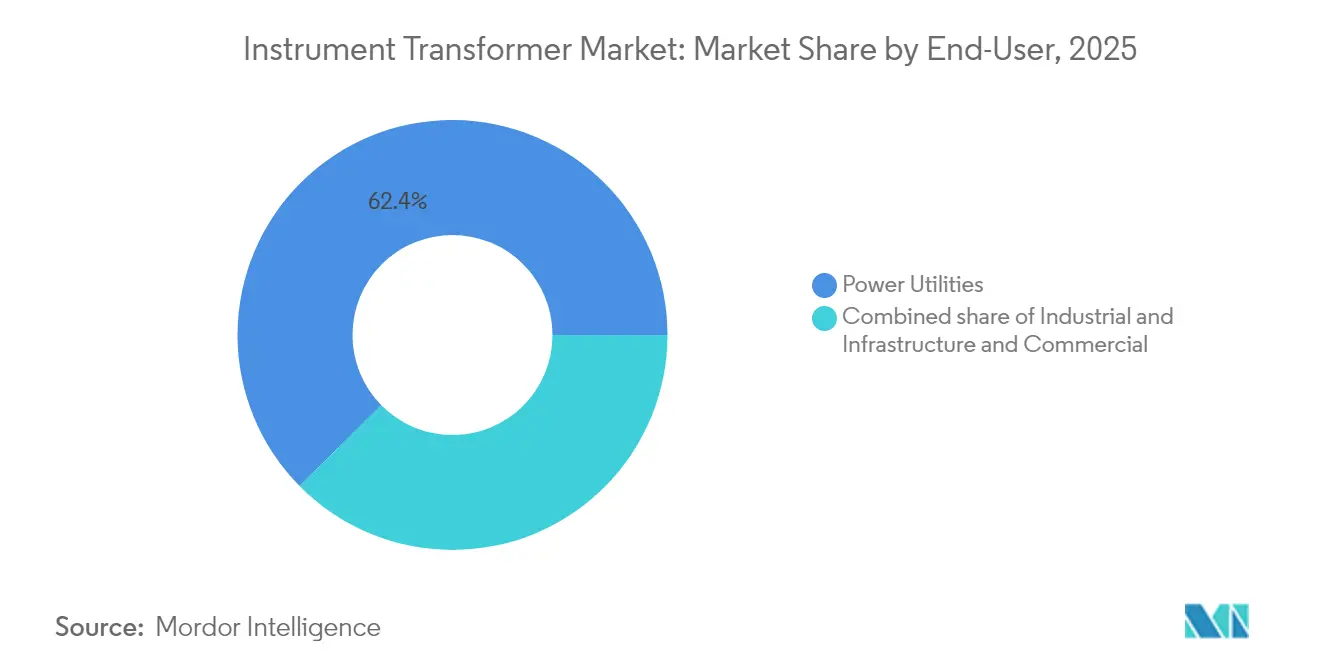
- By end-user, power utilities accounted for a 62.40% share of the instrument transformer market size in 2025. Infrastructure and commercial installations are advancing at a 6.65% CAGR between 2026 and 2031.
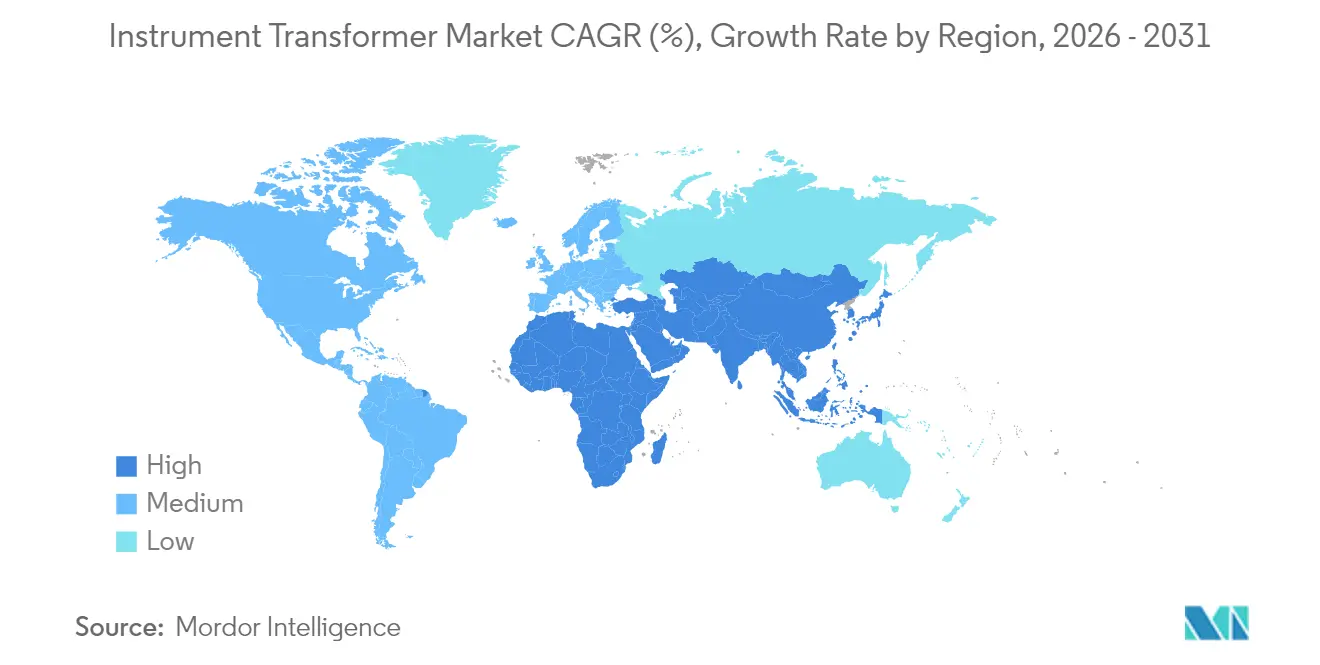
- By geography, the Asia-Pacific region captured a 43.65% revenue share in 2025 and is also the fastest-growing regional cluster, growing at a 6.62% CAGR to 2031.
Note: Market size and forecast figures in this report are generated using Mordor Intelligence’s proprietary estimation framework, updated with the latest available data and insights as of 2026.
Market Trends and Insights
Drivers Impact Analysis of Instrument Transformer Market*
| Driver | (~) % Impact on CAGR Forecast | Geographic Relevance | Impact Timeline |
|---|---|---|---|
| Substantial T&D grid-modernization outlays | 1.20% | Global, North America & APAC focus | Medium term (2-4 years) |
| Accelerated renewable-integration build-outs | 0.90% | Global, Europe & APAC corridors | Long term (≥ 4 years) |
| Rapid industrialisation across APAC | 0.80% | APAC core, spill-over to Middle East & Africa | Medium term (2-4 years) |
| Digitisation of substations & adoption of electronic CTs/VTs | 0.70% | North America & EU early adopters | Long term (≥ 4 years) |
| Stricter IEC/IEEE accuracy-class upgrades for PMU roll-outs | 0.50% | Global, led by North America & EU | Short term (≤ 2 years) |
| Surging hyperscale-data-centre additions | 0.60% | North America, EU, select APAC metros | Short term (≤ 2 years) |
| Source: Mordor Intelligence | |||
Substantial T&D Grid-Modernization Outlays
Transmission-upgrade programs are accelerating. The U.S. Department of Energy approved USD 1.5 billion of interregional projects in 2024, noting that national transfer capacity must double by mid-century.[1]U.S. Department of Energy, “Biden-Harris Administration Invests USD 1.5 Billion to Bolster the Nation's Electricity Grid,” energy.gov The European Commission estimates that EUR 584 billion (USD 640 billion) of grid spending is required by 2030 to integrate renewable resources.[2]European Commission, “European Union Electricity Market Design,” europa.eu These plans specify high-accuracy instrument transformers compatible with synchrophasor measurement units, driving multi-year procurement for class 0.2 and 0.15 devices. Utilities are standardising on IEC 61869 performance envelopes, which is widening the addressable demand for premium optical and electronic designs. Vendors with global production footprints can meet country-of-origin guidelines and mitigate tariff exposure, securing frame agreements with transmission owners.
Accelerated Renewable-Integration Build-Outs
Wind and solar projects introduce high harmonic content that stresses traditional magnetic cores. The Asia-Pacific region leads global renewable capacity additions and is forecast to grow at a 9% annual rate, requiring collector transformers rated up to 500 kV with specialized winding configurations.[3]PTI Transformers LP, “Renewable Energy Collector Transformers,” ptitransformers.com Utility-scale inverters demand wide-bandwidth current measurement, spurring orders for Rogowski-coil sensors and resistive divider voltage units that maintain linearity under distorted waveforms. Manufacturers able to certify products for both grid-code compliance and inverter OEM specifications command price premiums and repeat orders across regional solar clusters.
Rapid Industrialisation Across APAC
Developing Asian economies require USD 1.7 trillion in annual infrastructure investment, with 56% of that allocation allocated to electric power systems.[4]Asian Development Bank, “Infrastructure Development in Asia: 12 Things to Know,” adb.org China’s State Grid invested CNY 600 billion (USD 83 billion) in 2024 alone, with a focus on 800 kV and 1,100 kV corridors. India is following with capacity expansions by Hitachi Energy and domestic OEMs. This capital expenditure (capex) wave boosts the instrument transformer market, as manufacturing zones require medium-voltage sensors, while new transmission lines necessitate extra-high-voltage equipment. Suppliers offering designs tested in ambient ranges of −40 °C to 55 °C address tropical and desert environments, broadening contract eligibility.
Digitisation of Substations & Adoption of Electronic CTs/VTs
Utilities are replacing copper pilot wires with Ethernet architectures anchored by IEC 61850 process buses. Electronic current and voltage transformers feed digital merging units, which, in turn, supply virtualized protection relays. Toshiba and ABB have demonstrated 15% lifecycle cost savings when electronic sensors replace conventional wound cores. Hitachi Energy’s SAM600 3.0 converts analog signals to sampled values while maintaining IEC 61869 compliance. As brownfield stations are refurbished, hybrid yards emerge, where electronic and conventional transformers coexist, allowing for a gradual migration and stable aftermarket demand.
Restraints Impact Analysis of Instrument Transformer Market*
| Restraint | (~) % Impact on CAGR Forecast | Geographic Relevance | Impact Timeline |
|---|---|---|---|
| HVDC transmission roll-outs replacing conventional AC bays | -0.80% | Global, long-distance corridors | Long term (≥ 4 years) |
| Copper & CRGO steel price volatility | -0.60% | Global, acute in North America & Europe | Short term (≤ 2 years) |
| 60-plus-week global lead-times & supply-chain bottlenecks | -0.90% | Global, severe in North America | Medium term (2-4 years) |
| Optical non-intrusive sensing alternatives gaining traction | -0.40% | North America & EU early adoption | Long term (≥ 4 years) |
| Source: Mordor Intelligence | |||
HVDC Transmission Roll-Outs Replacing Conventional AC Bays
Multi-terminal HVDC schemes reduce reactive losses on long routes and employ measurement principles that differ from those used in 50/60 Hz AC practice. Ready4DC test beds in Europe illustrate the shift, specifying fiber-optic voltage dividers instead of inductive potential transformers. While total unit volumes remain comparatively small, every 500 kV DC converter station displaces several AC bays. Instrument transformer vendors must therefore add DC-graded designs, or risk erosion of addressable demand in long-distance corridors.
Copper & CRGO Steel Price Volatility
Copper prices spiked to record highs in early 2024, while electrical-steel mills reported capacity at near full utilisation. Materials represent up to 70% of the ex-works cost of a conventional current transformer. Manufacturers locked into fixed-price frame agreements face margin compression during commodity surges. The development of electronic sensors with minimal magnetic material content provides a partial hedge; however, adoption remains gradual.
*Our forecasts treat driver/restraint impacts as directional, not additive. The impact forecasts reflect baseline growth, mix effects, and variable interactions.
Instrument Transformer Market Segment Analysis
By Type:
Current Transformers Underpin Protection SchemesCurrent transformers retained a 55.70% share of the instrument transformer market in 2025, owing to their mandatory role in relay operations across all voltage classes. The instrument transformer market size for current transformers is projected to climb steadily as every new breaker panel incorporates at least two measurement cores. Demand strength is particularly evident in 145 kV and 245 kV ratings associated with onshore wind projects. In contrast, voltage/potential transformers remain relevant for revenue metering, where class 0.2 accuracy is still required; however, they face a substitution risk from capacitive sensors in gas-insulated substations. Combined/capacitive units registered the fastest CAGR at 7.08% through 2031, reflecting compact builds that fit into urban GIS yards.
The digital transition is altering the attributes of products. Electronic current transformers based on Rogowski coils offer ±0.5% accuracy over a 1 Hz–10 kHz bandwidth, aligning with harmonic-rich inverter applications. GE Vernova’s 1 200 kV porcelain-clad series retains market attention for ultra-high-voltage corridors, while ABB’s shielded resin sensors address indoor switchgear below 36 kV. Suppliers combining magnetic design know-how with embedded signal-conditioning boards satisfy utilities that must standardise both conventional and process-bus topologies during phased retrofits.



By End-User:
Utilities Dominate, Infrastructure Applications SurgePower utilities represented 62.40% of the instrument transformer market share in 2025, underpinned by long-haul transmission additions and distribution refurbishment programs. Utilities locked in multiyear framework agreements with tier-one OEMs, ensuring volume stability. The infrastructure and commercial segment is the fastest riser, expanding at a 6.65% CAGR as hyperscale data-centre and airport projects deploy sophisticated power-quality monitoring. The instrument transformer market size for these facilities is benefiting from pre-engineered packages that integrate sensors, merging units, and analytics dashboards, enabling facility managers to comply with uptime certifications.
Industrial users occupy the middle ground. Petrochemical and metals plants require high-accuracy metering for their energy-management systems, yet they often purchase on a project basis rather than on a continuous annual schedule. Vendors offering modular medium-voltage panels with embedded sensors gain an edge as process industries pursue digital twins and predictive maintenance frameworks that depend on reliable electrical data.
Geography Analysis
APAC Instrument Transformer Market
The Asia-Pacific region led the instrument transformer market with a 43.65% share in 2025 and is forecasted to grow at a 6.62% CAGR through 2031. China’s State Grid invested USD 83 billion in 2024 alone, commissioning multiple 800 kV lines that each require hundreds of bushing-type current transformers. India’s smart-metering and renewable corridors add further momentum, and Japanese utilities are retrofitting GIS yards with SF₆-free switchgear equipped with electronic sensors. Korean suppliers, such as Hyosung, leverage domestic GIS expertise to export compact transformers, highlighting the APAC region’s manufacturing self-sufficiency.
North America Instrument Transformer Market
North America exhibits moderate expansion anchored by federal funding for transmission upgrades. The Grid Resilience and Innovation Partnerships program allocates USD 10.5 billion for the replacement of aging assets, resulting in sustained orders for 362 kV and 550 kV instrument transformers. U.S. utilities are early adopters of electronic sensors in distribution switchgear, stimulated by wildfire mitigation mandates that require fast-acting protection.
Europe Instrument Transformer Market
Europe’s growth is steadier yet driven by offshore-wind interconnections. Each offshore platform integrates compact gas-insulated bays populated with capacitive dividers to minimise footprint. EU industrial policy encourages SF₆-free equipment, steering orders toward dry-air-insulated transformers from EU-based factories. Procurement guidelines now include embedded life-cycle assessment data, prompting vendors to disclose material traceability.
MEA and South America Instrument Transformer Market
The Middle East and Africa are recording a rising spend as diversification agendas target petrochemical clusters and green hydrogen zones. Saudi Arabia’s transmission operator has standardized 400 kV gas-insulated substations for desert resilience, and these substations incorporate polymer-clad current transformers rated for 60 °C ambient temperatures. South America remains a smaller share yet benefits from Chilean solar developments that require 220 kV collector yards equipped with split-core sensors for easy field retrofits.

Regulatory Landscape
Instrument transformers used for revenue metering and grid-protection functions fall under a mix of international performance standards and country or state approval regimes. The IEC 61869 series provides the core technical conformity framework, including IEC 61869-1:2023 (general requirements) and IEC 61869-20:2025 (safety requirements for high voltage applications), with Corrigendum 1 incorporated in January 2026 that tightens the compliance baseline for HV designs in utility and industrial settings.
In North America, access for metering-class units typically requires regulator approval of specific models alongside standards testing. In New York, the New York State Public Service Commission approves instrument transformer models for metering applications under 16 NYCRR Part 93, as reflected in an order effective April 21, 2026 approving Trench Germany GmbH's AUD 145/S95T voltage transformer for use in electric metering. Canada follows a similarly prescriptive pathway through Measurement Canada, where Specification S-E-07 governs approval of measuring instrument transformers, reinforcing requirements around validated accuracy class, labeling, and inspection readiness for revenue metering deployments.
Competitive Landscape
The instrument transformer market is moderately fragmented. ABB, Siemens Energy, Hitachi Energy, and GE together supplied just under 40% of 2024 shipments, reflecting broad portfolios and global service footprints. These incumbents defend their share through multi-year framework agreements and by bundling transformers with protection relays and digital-substation software. Hitachi Energy’s additional USD 250 million expansion, announced in 2025, underscores its scale ambitions.
Regional specialists such as Pfiffner, Arteche, and KONČAR compete on custom designs and quick-turn manufacturing. They win contracts in markets that prioritise local content or rapid delivery, especially in secondary transmission voltages. New entrants with optical sensing technologies are challenging traditional players by promoting maintenance-free operations and lightweight designs that are ideal for offshore platforms.
Strategic acquisitions continue. Siemens agreed to purchase Trayer Engineering in 2024, adding medium-voltage switchgear that pairs with its electronic sensors. Meanwhile, ABB acquired Gamesa Electric’s power-electronics arm to deepen its renewable integration capabilities. Steelmaker Cleveland-Cliffs entered downstream manufacturing with a USD 150 million transformer plant that secures demand for its domestic grain-oriented steel. Vendors are also investing in software. ABB’s SSC600-SW virtual relay platform collapses thirty physical devices into a single server image, shifting value from hardware margins to recurring licences.
Instrument Transformer Industry Leaders
General Electric Company
Schneider Electric SE
Arteche Group
Siemens Energy AG
ABB Ltd.
- *Disclaimer: Major Players sorted in no particular order

Instrument Transformer Market Companies Covered in this Report
- ABB Ltd
- Siemens Energy AG
- General Electric Co.
- Schneider Electric SE
- Arteche Group
- PFIFFNER Instrument Transformers Ltd
- CG Power & Industrial Solutions Ltd
- Mitsubishi Electric Corp.
- Nissin Electric Co. Ltd
- Amran Inc.
- Hitachi Energy
- Toshiba Energy Systems
- Hyosung Heavy Industries
- Bharat Heavy Electricals Ltd
- WEG SA
- Trench Group
- KONČAR – Instrument Transformers
- Jiangsu Huapeng Group
- Instrument Transformers Ltd (UK)
- Kappa Engineering

Market Opportunities and Future Outlook
Digital-substation architectures create room for low-power and non-conventional instrument transformers designed to simplify IEC 61850 process bus integration and reduce copper wiring. Utility-led pilots are providing a route to broader standardization: Scottish and Southern Electricity Networks Distribution initiated the NIA_SSEN_0081 innovation project in April 2026 to trial Low-Power Instrument Transformers (LPIT) alongside IEC 61850 digital technology at 132 kV substations, supporting uptake of sensor and merging-unit solutions rather than standalone magnetic devices.
Transmission reinforcements and local-content supply-chain strategies are also opening procurement channels for EHV instrument transformers and related HV components. Trench Group publicized a U.S. 765 kV strategy in May 2026, including a 765 kV CVT project award in Texas tied to ERCOT grid buildout, while manufacturers expanded regional footprints through disclosed investments such as Hitachi Energy India announcing INR 2000 crore in June 2026 for a new large power transformer factory in Karjan (Vadodara), and Hitachi Energy announcing USD 150 million in April 2026 to expand transformer manufacturing capacity in Colombia and Brazil through 2028. Together, these developments point to active opportunity areas in 420 kV to 765 kV classes, with emphasis on faster delivery commitments and bundled offerings that combine sensors, digital interfaces, and testing services aligned to IEC 61869 and local metering-approval requirements.
Recent Industry Developments in Instrument Transformer Market
- July 2026: Standex International Corporation completed the acquisition of the remaining 9.9% interest in Narayan Powertech Pvt. Ltd. for approximately USD 64 million. The transaction strengthens Standex's position in power equipment components relevant to grid buildouts, reinforcing supplier capability and scale in a market shaped by extended lead times.
- June 2026: Hitachi Energy India announced INR 2000 crore for a new large power transformer factory in Karjan (Vadodara). The investment expands domestic manufacturing capacity to serve 420 kV to 765 kV applications, improving delivery resilience and local content alignment in the regional grid segment.
- May 2026: Trench Group publicized a 765 kV strategy in Texas tied to ERCOT grid buildout, including a 765 kV CVT project award. The contract supports higher voltage transformer component deployment and signals stronger demand for integrated sensor ecosystems and testing services.


Instrument Transformer Market Report Scope and Research Methodology
Market Definition and Coverage
For this study, the instrument transformer market is defined as revenue earned from current transformers and voltage or potential transformers (including combined or capacitive designs) that are used for metering, protection, and control in power networks and industrial electrical systems.
Scope exclusions: It does not include power transformers, distribution transformers, or switchgear assemblies where instrument transformers are only an internal component.
Segments Covered in This Report
- Type
- Current Transformer
- Voltage/Potential Transformer
- Combined/Capacitive Transformer
- End User
- Power Utilities
- Industrial
- Infrastructure and Commercial
- Geography
- North America
- United States
- Canada
- Mexico
- Europe
- Germany
- United Kingdom
- France
- Italy
- NORDIC Countries
- Russia
- Rest of Europe
- Asia-Pacific
- China
- India
- Japan
- South Korea
- ASEAN Countries
- Rest of Asia-Pacific
- South America
- Brazil
- Argentina
- Rest of South America
- Middle East and Africa
- Saudi Arabia
- United Arab Emirates
- South Africa
- Egypt
- Rest of Middle East and Africa
- North America
Data Sources, Market Sizing, and Validation
Desk Research
Desk research was used to set the market boundaries, build the country and regional demand context, and pressure test early assumptions before numbers were modeled. We reviewed public grid and electricity data such as IEA electricity statistics, U.S. EIA datasets, World Bank indicators, and national grid and regulator publications, which help explain load growth and network expansion needs.
To translate demand signals into a practical sizing model, standards and technical references were also checked (such as IEC and IEEE references), followed by trade association and utility planning documents that indicate substation build plans and replacement cycles. We also used company annual reports, investor presentations, and reputable press coverage to understand product mix and regional exposure, and a paid subscription for company financials, patent databases, and shipment-level trade statistics where relevant to validate directional trends. The desk sources cited above are illustrative and not exhaustive, and additional public and paid references were used for data collection, validation, and clarification during the study.
Primary Interviews and Surveys
Primary work focused on confirming what is actually being bought and installed, and how pricing and demand move by project type. We spoke with a mix of manufacturers, EPC and installer channels, utility procurement teams, and industrial users across APAC, EMEA, and the Americas so the gaps left by public sources could be closed and key assumptions cross checked.
Distribution of primary research fieldwork respondents
| Company type | Respondent position | Region |
|---|---|---|
| Top tier: 25% | CXOs: 13% | APAC: 43% |
| Mid tier: 59% | Functional/Unit leaders: 39% | EMEA: 31% |
| Smaller Players: 16% | Managers: 48% | Americas: 26% |
Market-Sizing & Forecasting
Sizing starts with a top-down build where grid expansion and refurbishment activity is reconstructed using utility capex signals, substation additions, and transmission and distribution upgrade indicators, and then translated into instrument transformer demand pools by typical equipment intensity. The totals are then corroborated with selective bottom-up checks, such as sampled pricing by voltage class and installation type, supplier revenue mix checks, and channel feedback on order cycles, which are used to adjust outliers.
Key inputs that shaped the model included substation commissioning pipelines, grid modernization programs, renewable interconnection activity, replacement cycles for aging assets, and tender activity patterns that often drive short-term spikes. Pricing was handled using an average selling price ladder by type and application, with separate assumptions for utility versus industrial buying behavior and for project versus maintenance demand.
For forecasting, we relied on scenario analysis supported by a simple multivariate regression, where demand is linked to power network investment and electricity demand growth, and then moderated by lead-time and supply constraints highlighted by interviewees. Where country data was thin, proxy indicators (such as regional capex, trade flows, and installed capacity growth) were applied, then normalized using expert feedback so the final curve stays realistic.
Data Validation & Update Cycle
Validation is done in layers so the final number is not driven by one dataset or one assumption. We compare modeled totals against independent signals like transformer and switchgear investment cycles, utility budget releases, and import/export trends, and then run variance checks by region, end use, and type to spot breaks that do not match market behavior.
Before sign-off, the model and narrative go through analyst peer review, and any large deltas trigger a re-check of drivers like price progression, project timing, or scope alignment. The report is refreshed on an annual cycle, and interim adjustments are made when material events occur, such as major policy shifts or sudden changes in grid spending. Right before delivery, a final data pass is completed so clients receive the latest updated view.
Mordor Intelligence's Instrument Transformer Market Size Versus Other Published Estimates
Published market sizes for instrument transformers can look far apart even when everyone is describing similar hardware, because the math depends heavily on what is counted and how demand is translated into revenue. Differences usually come from boundary choices, the year used for pricing, and whether the estimate leans more on planning indicators or on observed purchase behavior.
By tracking utility substation additions, grid capex signals, and price ladders by transformer type, Mordor Intelligence keeps the total aligned to metering and protection use cases, instead of blending in adjacent transformer or switchgear value that can inflate the headline number.
Benchmark comparison
| Source | Market Size | Gaps in Research Methodology |
|---|---|---|
| Mordor Intelligence | USD 7.21 B (2025) | |
| Trade Journal B | USD 7.53 B (2024) | The published number is anchored to an earlier base year and appears to use a higher growth stance, with limited visibility on whether combined or capacitive units and retrofit demand are treated consistently across regions. |
| Regional Consultancy A | USD 7.10 B (2023) | This estimate uses a different starting year and may apply broad regional multipliers, which can miss the impact of country-level grid replacement cycles and ASP changes tied to voltage class and installation environment. |
Across the sources, the spread is largely explained by base-year selection, what gets included around combined designs and retrofit projects, and how pricing is rolled forward over the forecast window. When those items are normalized and checked against grid investment signals, the market size becomes easier to trace back to clear demand drivers and repeatable steps.


Key Questions Answered in the Report
What is the current value of the instrument transformer market?
The instrument transformer market size was USD 7.56 billion in 2026 and is projected to reach USD 9.59 billion by 2031.
Which segment leads by product type?
Current transformers led with 55.70% instrument transformer market share in 2025.
Which region is growing the fastest?
Asia-Pacific is the fastest-growing region, advancing at a 6.62% CAGR through 2031.
Why are electronic transformers gaining traction?
Electronic current and voltage transformers offer wider bandwidth, reduced maintenance, and easy integration with IEC 61850 digital substations.
How are supply-chain constraints affecting the market?
Lead times extending beyond 60 weeks have pushed utilities to hold higher inventories and have given pricing power to manufacturers able to ship faster.
What impact will HVDC adoption have on demand for conventional transformers?
Expanded HVDC corridors may displace some AC instrument-transformer demand, but they also create niche requirements for DC-rated sensors, offering new opportunities for adaptable suppliers.
Page last updated on:


 Your data is secure and never sold or shared.


