Transformer Core Market Size and Share
Market Overview
| Study Period | 2020 - 2030 |
|---|---|
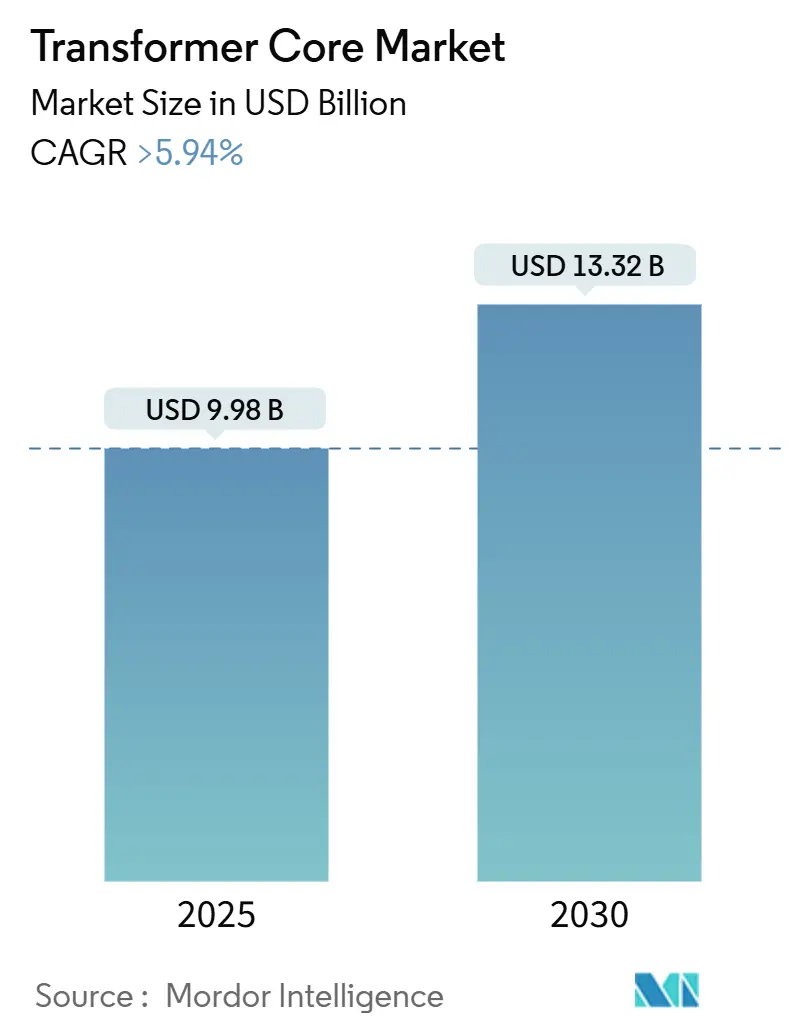
| Market Size (2025) | USD 9.98 Billion |
| Market Size (2030) | USD 13.32 Billion |
| Growth Rate (2025 - 2030) | 5.94% CAGR |
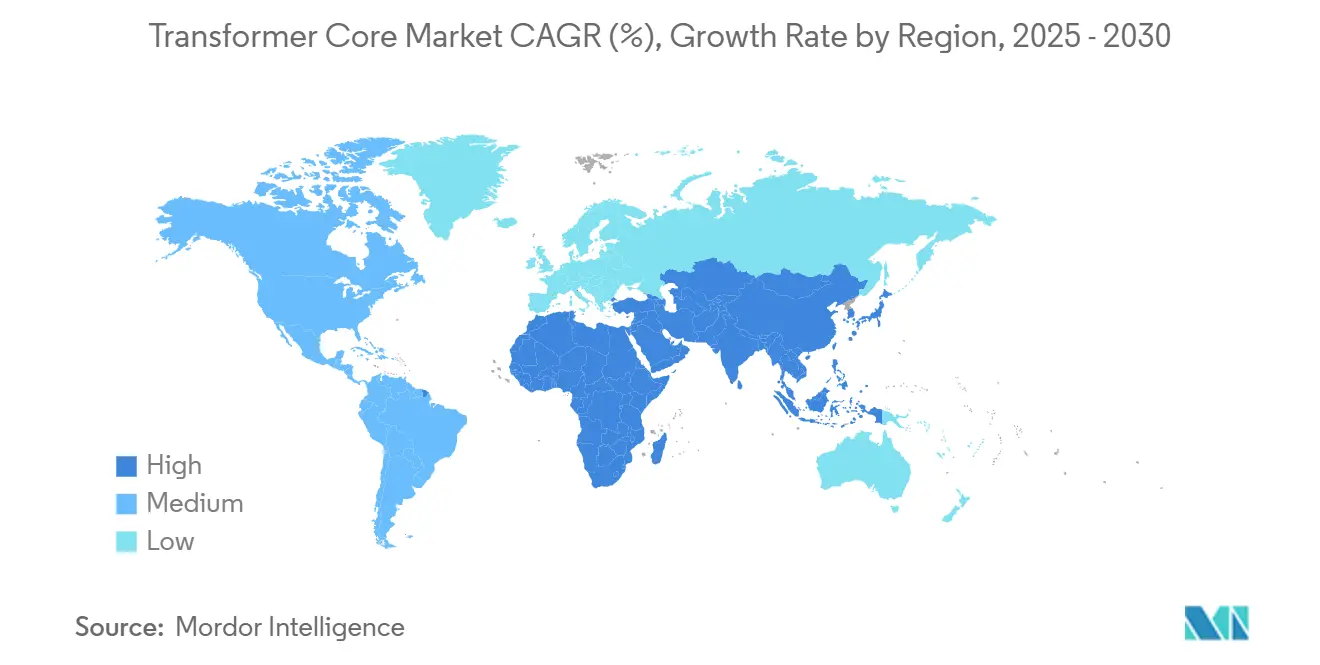
| Fastest Growing Market | Asia Pacific |
| Largest Market | Asia Pacific |
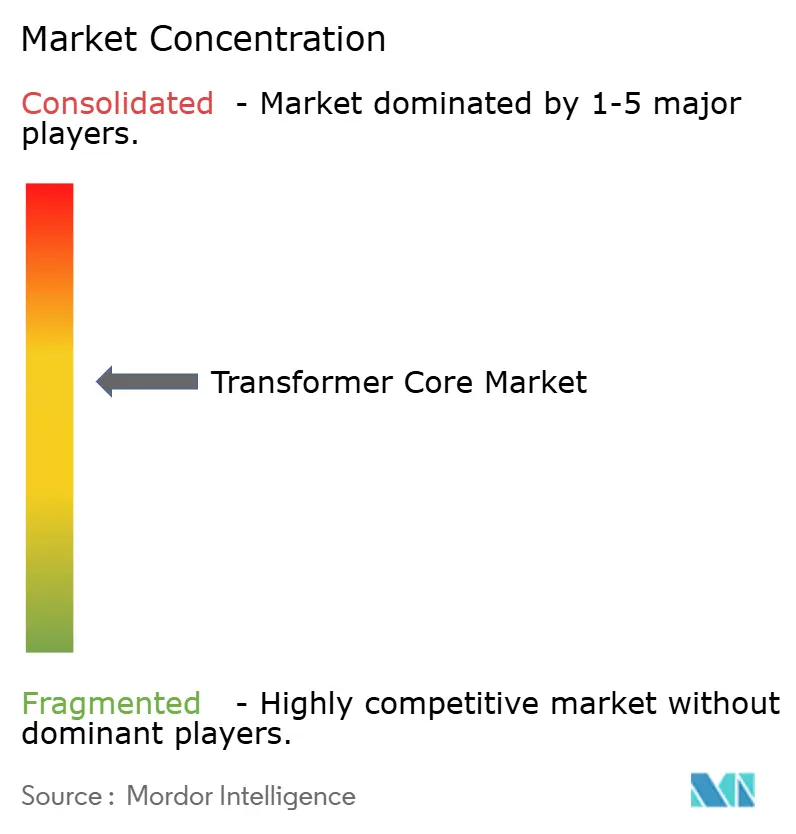
| Market Concentration | Medium |
Major Players *Disclaimer: Major Players sorted in no particular order Image © Mordor Intelligence. Reuse requires attribution under CC BY 4.0. | |
Transformer Core Market Analysis by Mordor Intelligence
The Transformer Core Market size is estimated at USD 9.98 billion in 2025, and is expected to reach USD 13.32 billion by 2030, at a CAGR of greater than 5.94% during the forecast period (2025-2030).
Robust grid-scale renewable additions, accelerating electrification of transport, and heavy data-center construction translate into structural demand for new high-efficiency cores. Asia-Pacific remains the largest consuming region, underpinned by China’s and India’s record capital spending on transmission, distribution, and manufacturing capacity expansions. North America and Europe are catching up through multi-year grid-modernization programs, while regulatory pressure for lower no-load losses is steering procurement toward amorphous metal and nanocrystalline designs. Global supply remains tight: average transformer lead times have stretched beyond two years, and electrical-steel price volatility is squeezing manufacturing margins.
Key Report Takeaways
- By core material, grain-oriented laminated steel held 79.6% of the transformer core market share in 2024, whereas nanocrystalline alloys are projected to expand at a 12.2% CAGR through 2030.
- By core geometry, EI/UI stacks dominated revenue with 72.5% in 2024, while C-core solutions are poised for a 7.1% CAGR to 2030.
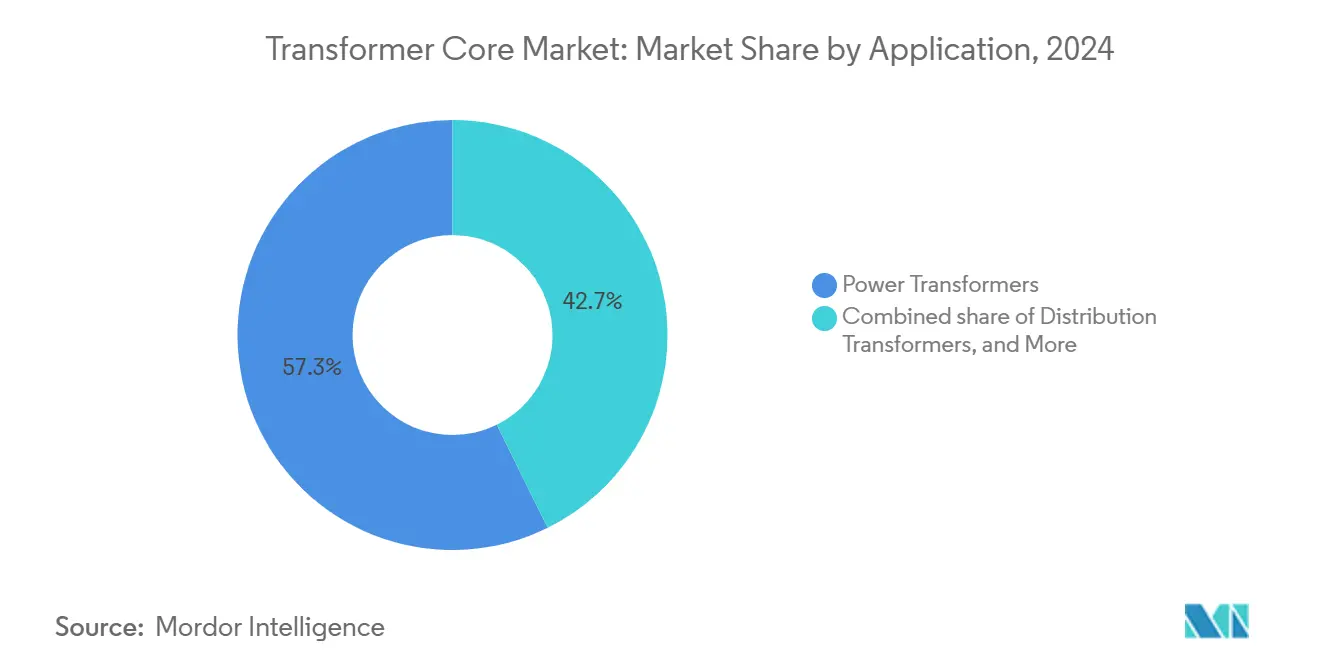
- By application, power transformers represented 57.3% of the transformer core market size in 2024; isolation and specialty units are advancing at a 7.4% CAGR on the back of data-center and medical-equipment upgrades.
- By end-user, utilities accounted for 64.2% of demand in 2024, but e-mobility infrastructure providers are forecast to register a 14.3% CAGR through 2030.
- By geography, Asia-Pacific commanded 42.8% transformer core market share in 2024 and is set to grow at 6.7% CAGR thanks to record renewable deployments and public-sector grid spending.
Market Trends and Insights
Drivers Impact Analysis of Transformer Core Market*
| Driver | (~) % Impact on CAGR Forecast | Geographic Relevance | Impact Timeline |
|---|---|---|---|
| Surging grid-scale renewable additions | 1.80% | Global, with APAC and Europe leading | Medium term (2-4 years) |
| Accelerated T&D digital-upgrade programs | 1.20% | North America & EU, expanding to APAC | Long term (≥ 4 years) |
| Electrification of mobility & charging networks | 1.50% | Global, concentrated in developed markets | Medium term (2-4 years) |
| Demand for low-loss amorphous & nano-crystalline cores | 0.90% | Europe and North America regulatory-driven | Long term (≥ 4 years) |
| Small modular reactor (SMR) micro-grid roll-outs | 0.30% | North America, with pilot projects globally | Long term (≥ 4 years) |
| PFAS-free dielectric oils mandating core retrofits | 0.40% | Europe and North America | Medium term (2-4 years) |
| Source: Mordor Intelligence | |||
Surging Grid-Scale Renewable Additions Drive Core Material Innovation
Global renewable capacity build-outs have lifted transformer shipments by 23% since 2019, and distribution networks in the United States alone may need 160–260% more transformer capacity by 2050.[1]NREL Analysts, “Distribution-transformer capacity outlook,” National Renewable Energy Laboratory, nrel.gov Variable power flows from solar and wind assets require cores with superior permeability and reduced stray-loss profiles, accelerating the shift toward nanocrystalline and amorphous alloys. Europe’s 45% renewable-energy target for 2030 further amplifies retrofit demand for bidirectional, smart-capable transformers, reinforcing the growth trajectory of the transformer core market.
Accelerated T&D Digital-Upgrade Programs Transform Core Design Requirements
Utilities committed USD 331 billion to grid-modernization projects in 2023, embedding digital monitoring hardware that alters core-loss specifications.[2]CWIEME Research Group, “Global grid-modernization CapEx 2023,” CWIEME Berlin, cwieme.com IEC 61850-based substations now call for mixed-grade stacked laminations that cut no-load losses by up to 28.2% compared with single-grade designs. As National Grid rolls out 40 fully digital substations, demand for thermally optimized cores with embedded sensors broadens the supplier base, deepens competition, and enlarges the transformer core market.
Electrification of Mobility Networks Creates Specialized Core Demand
The proliferation of EV chargers introduces high harmonic distortion, prompting specification of k-factor-rated isolation transformers. Studies show uncontrolled charging can double thermal stress on legacy units. Hammond Power Solutions and others advocate k9-rated and harmonic-mitigating transformers that incorporate distributed-gap C-cores, strengthening consumption of premium magnetic materials. U.S. Department of Energy FITT grants totaling USD 20 million support solid-state transformer prototypes tailored to EV charging, ensuring sustained demand growth inside the transformer core market.
Demand for Low-Loss Amorphous and Nanocrystalline Cores Accelerates
Mandatory efficiency rules in the United States, EU Eco-design standards, and Japan’s Top-Runner program are catalyzing the adoption of nanocrystalline alloys, which are growing at a 12.2% CAGR through 2030. ThyssenKrupp’s bluemint® powercore® offers a 50% cut in CO₂ intensity while matching GOES magnetic performance. Research at the University of Texas demonstrates nanoparticle-enhanced cellulose insulation reducing hotspot temperatures by up to 10 °C, doubling asset life, and expanding the transformer core market opportunity.
Restraints Impact Analysis of Transformer Core Market*
| Restraint | (~) % Impact on CAGR Forecast | Geographic Relevance | Impact Timeline |
|---|---|---|---|
| Volatile electrical-steel pricing & supply | -1.10% | Global, particularly impacting Asia-Pacific | Short term (≤ 2 years) |
| Lengthy transformer order lead-times (12-24 mths) | -0.80% | Global, most severe in North America | Short term (≤ 2 years) |
| Russia-origin GOES export constraints | -0.60% | Europe and North America | Medium term (2-4 years) |
| Skilled-lamination workforce shortages | -0.50% | Global manufacturing hubs | Long term (≥ 4 years) |
| Source: Mordor Intelligence | |||
Volatile Electrical-Steel Pricing Creates Supply-Chain Vulnerabilities
Global GOES capacity of 2.7 million t barely covers the current demand of 2.2 million t. With Cleveland-Cliffs the lone U.S. producer, price spikes have lifted lamination costs by nearly 60% since 2020. Imports face duties and shipping bottlenecks, pressuring margins and risking delivery slippages that temper transformer core market expansion.
Lengthy Transformer Lead Times Constrain Market Growth
Average procurement cycles now span 115–130 weeks, up from 12–14 weeks pre-pandemic.[3]Power Magazine Editorial Board, “Transformer lead-time crisis deepens,” Power Magazine, powermag.com The National Infrastructure Advisory Council advocates a strategic reserve of critical transformers to mitigate outage risk. Prolonged wait times defer grid-upgrade schedules and constrain renewable-project interconnections, slowing near-term progress for the transformer core market.
*Our forecasts treat driver/restraint impacts as directional, not additive. The impact forecasts reflect baseline growth, mix effects, and variable interactions.
Transformer Core Market Segment Analysis
By Core Material Type:
Nanocrystalline Alloys Gain Traction Despite Steel DominanceGrain-oriented laminated steel commanded 79.6% of revenue in 2024 owing to cost advantages and a well-established supply chain. Nevertheless, nanocrystalline alloys are set to deliver the fastest 12.2% CAGR through 2030 as utilities and OEMs seek sub-0.9 W/kg core-loss performance, particularly in solid-state and high-frequency transformers. Manufacturers ramp up vacuum-annealing lines to shorten cycle times and secure raw ribbon feedstock, keeping the transformer core market well supplied despite material diversification.
Substitution momentum is clear when comparing historical adoption: nanocrystalline alloys rose 8.7% CAGR between 2019 and 2024, accelerating into the next cycle as regulatory bodies tighten loss targets. Bluemint® powercore® launch indicates incumbents are greening steel production to defend share, while 3D-printed ferrite and spark-plasma-sintered composites penetrate aerospace and EV-charger modules, broadening the overall transformer core market.


By Core Geometry:
C-Cores Challenge Conventional EI/UI StacksEI/UI stacks held 72.5% revenue in 2024 because of tooling standardization and low scrap ratios, yet C-core shipments are forecast to climb at a 7.1% CAGR on superior flux distribution and simplified assembly. Prototype octagonal-wound cores recorded 12% lower excitation current than traditional stacks, signaling improved system efficiency.
Cost-down studies reveal mixed-grade C-cores can shrink material outlay by 28.2% without breaching efficiency classes. Toroidal variants continue serving medical and audio applications where low leakage and compact form factor trump cost, collectively supporting steady diversification inside the transformer core market.
By Application:
Isolation and Specialty Transformers Outpace Power UnitsPower transformers represented 57.3% of the transformer core market size in 2024, reflecting their grid-critical status. Isolation and specialty units, however, are advancing at a 7.4% CAGR as hyperscale data-center operators and hospital networks prioritize clean, low-harmonic power. Solid-state architectures for DC fast-charging and modular UPS systems further spur specialty-core demand, widening addressable volumes for high-permeability C-cores and amorphous ribbons.
Instrument transformers capitalize on digital-substation rollouts, while medium-voltage distribution units benefit from building-electrification codes. Therefore, the application mix tilts toward premium cores that cut standby losses, reinforcing value growth trajectories across the transformer core market.
By End-User:
E-Mobility Infrastructure Leads Growth CurveUtilities still absorbed 64.2% of shipments in 2024 thanks to universal grid-reinforcement projects, yet EV-charging-network operators are projected to expand at a 14.3% CAGR through 2030. Peak-demand clustering at charging hubs raises thermal stress, encouraging uptake of k-factor-rated laminations and harmonic-filtering designs that command higher ASPs.
Industrial buyers in oil and gas and metals are modernizing with PFAS-free dielectric upgrades, while data-center developers increasingly specify nanocrystalline rectangular stacks to handle high-frequency UPS loads. This growing diversity of buyer profiles deepens resilience and widens revenue streams within the transformer core market.
Geography Analysis
APAC Transformer Core Market
Asia-Pacific occupied 42.8% of global revenue in 2024 and is forecast to grow at a 6.7% CAGR as China’s and India’s record-breaking renewables and grid outlays persist. Hitachi Energy’s multi-site expansion and GE Vernova’s USD 16 million HVDC parts plant in Chennai demonstrate the region’s pull on multinational capital. Japan and South Korea are lifting clean-energy budgets by double-digit percentages, reinforcing domestic steel and core demand.
North America Transformer Core Market
North America is the second-largest market and will likely accelerate from a 4.2% historical CAGR to 5.8% through 2030, driven by the Inflation Reduction Act, aged-asset replacement, and corporate electrification pledges. Material bottlenecks remain acute, prompting investments such as Cleveland-Cliffs’ USD 150 million Weirton transformer facility and Hyosung’s plan to double U.S. output to 250 units per year. Government Defense Production Act support underlines the strategic weight of transformer availability.
EMEA and South America Transformer Core Market
Europe’s mature grid requires extensive retrofits to meet Fit-for-55 legislation. Although installed power-transformer capacity currently exceeds indigenous demand, raw-material shortages and skilled-labor gaps restrict utilization to below 80%. E.ON’s USD 700 million order with Hitachi Energy for German network upgrades and the EUR 500 billion German infrastructure fund exemplify the scale of the pipeline. South America and the Middle East & Africa, while smaller in absolute terms, are slated for mid-single-digit growth as industrialization, mining, electrification, and renewable targets unfold, extending the global footprint of the transformer core market.

Competitive Landscape
Industry concentration is moderate. The top five manufacturers control near 55% of global shipments, while the next tier is expanding capacity aggressively. Hitachi Energy tops investment tables, committing over USD 6.25 billion through 2027 to add lamination, vacuum-annealing, and digital-component lines across Asia, Europe, and North America. ABB’s acquisition of Gamesa Electric’s power-electronics unit bolsters renewable-converter capability, and Siemens Energy continues focusing on digitalized high-voltage products.
Consolidation is reshaping supply. Nippon Steel’s acquisition of US Steel for USD 14.1 billion produces a GOES powerhouse with a broad US footprint, while Central Moloney’s takeover of Cam Tran forms a leading North American distribution-transformer player. TECO’s NT$550 million purchase of Shenchang Electric marks Taiwanese entry into North American markets. Vertical integration trends are clear: Cleveland-Cliffs is moving downstream into finished transformers to secure outlets for its electrical steel, an approach mirrored by Hoa Phat in Vietnam.
Technological differentiation revolves around low-loss materials, digital monitoring, and PFAS-free dielectric compatibility. Asian suppliers such as HD Hyundai Electric and Hyosung leverage cost advantages and state support to enlarge export share, challenging European incumbents. Specialized niches—SMR micro-grid cores, medical isolation units, and 15 kHz solid-state transformers—offer white-space growth for innovative newcomers, keeping competitive intensity elevated inside the transformer core market.
Transformer Core Industry Leaders
Hitachi Energy
Siemens Energy AG
ABB Ltd.
Mitsubishi Electric Corp.
Schneider Electric SE
- *Disclaimer: Major Players sorted in no particular order
Transformer Core Market Companies Covered in this Report
- ABB Ltd.
- Siemens Energy AG
- Hitachi Energy
- Mitsubishi Electric Corporation
- Toshiba Energy Systems & Solutions
- Eaton Corporation
- Schneider Electric SE
- CG Power & Industrial Solutions Ltd.
- Fuji Electric Co., Ltd.
- Hyundai Electric & Energy Systems Co., Ltd.
- Baowu Steel Group (CRGO)
- Nippon Steel Corporation
- POSCO
- JFE Steel Corporation
- NLMK Group
- Tempel Steel (Worthington Industries)
- Nicore Electrical
- CTCI CoreTech
- Zaporozhtransformator PJSC (ZTR)
- Hyosung Heavy Industries

Recent Industry Developments in Transformer Core Market
- March 2025: Hitachi Energy earmarked an additional USD 250 million to lift component output under its USD 6 billion transformer-shortage mitigation roadmap.
- March 2025: Hyosung Heavy Industries outlined plans to double U.S. transformer output to 250 units annually by 2027.
- July 2024: CG Power completed a INR 662 crore expansion, elevating instrument-transformer capacity to 2,494 units per year.


Global Transformer Core Market Report Scope
Segmentation Overview
| Grain-Oriented Laminated Steel |
| Amorphous Metal |
| Nanocrystalline Alloy |
| Others |
| EI and UI Stack |
| C-core |
| Toroidal |
| Others (Cut, Distributed-gap, etc.) |
| Power Transformers |
| Distribution Transformers |
| Instrument and Sensor Transformers |
| Isolation and Specialty Transformers |
| Utilities (T&D, IPPs) |
| Industrial (Oil and Gas, Mining, Process) |
| Commercial and Institutional |
| Residential |
| Renewable and Micro-grid Operators |
| E-Mobility Infrastructure Providers |
| North America | United States |
| Canada | |
| Mexico | |
| Europe | Germany |
| United Kingdom | |
| France | |
| Italy | |
| NORDIC Countries | |
| Russia | |
| Rest of Europe | |
| Asia-Pacific | China |
| India | |
| Japan | |
| South Korea | |
| ASEAN Countries | |
| Rest of Asia-Pacific | |
| South America | Brazil |
| Argentina | |
| Rest of South America | |
| Middle East and Africa | Saudi Arabia |
| United Arab Emirates | |
| South Africa | |
| Egypt | |
| Rest of Middle East and Africa |
| By Core Material Type | Grain-Oriented Laminated Steel | |
| Amorphous Metal | ||
| Nanocrystalline Alloy | ||
| Others | ||
| By Core Geometry | EI and UI Stack | |
| C-core | ||
| Toroidal | ||
| Others (Cut, Distributed-gap, etc.) | ||
| By Application | Power Transformers | |
| Distribution Transformers | ||
| Instrument and Sensor Transformers | ||
| Isolation and Specialty Transformers | ||
| By End-user | Utilities (T&D, IPPs) | |
| Industrial (Oil and Gas, Mining, Process) | ||
| Commercial and Institutional | ||
| Residential | ||
| Renewable and Micro-grid Operators | ||
| E-Mobility Infrastructure Providers | ||
| By Geography | North America | United States |
| Canada | ||
| Mexico | ||
| Europe | Germany | |
| United Kingdom | ||
| France | ||
| Italy | ||
| NORDIC Countries | ||
| Russia | ||
| Rest of Europe | ||
| Asia-Pacific | China | |
| India | ||
| Japan | ||
| South Korea | ||
| ASEAN Countries | ||
| Rest of Asia-Pacific | ||
| South America | Brazil | |
| Argentina | ||
| Rest of South America | ||
| Middle East and Africa | Saudi Arabia | |
| United Arab Emirates | ||
| South Africa | ||
| Egypt | ||
| Rest of Middle East and Africa | ||


Key Questions Answered in the Report
What is the current global value of transformer cores?
The transformer core market size stood at USD 9.98 billion in 2025 and is forecast to reach USD 13.32 billion by 2030.
Which region leads demand for transformer cores?
Asia-Pacific commanded 42.8% of global revenue in 2024 and is projected to grow at 6.7% CAGR through 2030.
Why are nanocrystalline cores gaining popularity?
Efficiency regulations and renewable inverters favor nanocrystalline alloys, which are registering a 12.2% CAGR owing to their lower core losses.
How long are current transformer delivery lead times?
Average global lead times have stretched to 115–130 weeks, up from roughly three months before 2020.
What end-user segment is growing the fastest?
E-mobility infrastructure providers are forecast to record a 14.3% CAGR as EV chargers proliferate worldwide.
Which companies are investing most aggressively in new capacity?
Hitachi Energy, Hyosung Heavy Industries, and HD Hyundai Electric have collectively announced more than USD 6.7 billion of expansions aimed at alleviating shortages.
Page last updated on:


