Market Overview
| Study Period | 2021 - 2031 |
|---|---|
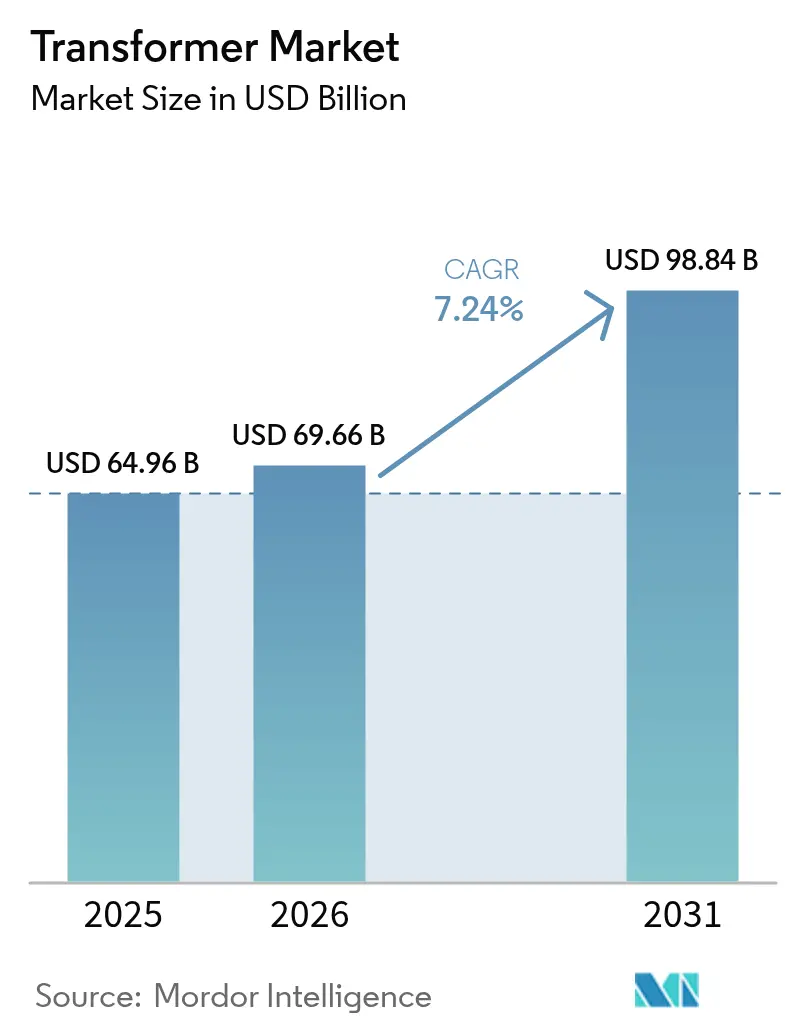
| Market Size (2026) | USD 69.66 Billion |
| Market Size (2031) | USD 98.84 Billion |
| Growth Rate (2026 - 2031) | 7.24% CAGR |
| Fastest Growing Market | Asia-Pacific |
| Largest Market | Asia Pacific |
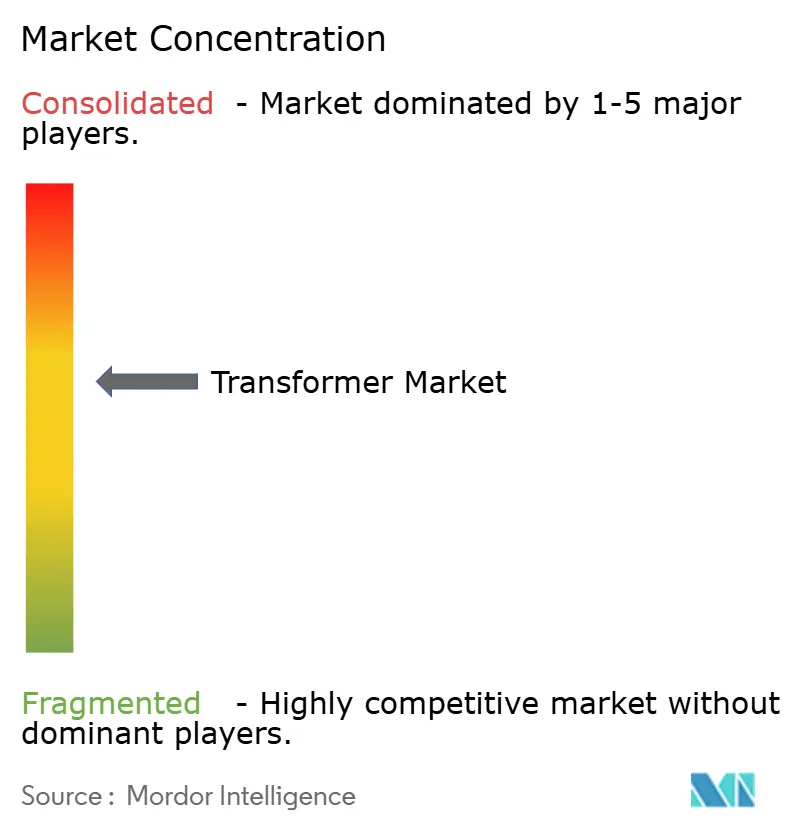
| Market Concentration | Medium |
Major Players *Disclaimer: Major Players sorted in no particular order Image © Mordor Intelligence. Reuse requires attribution under CC BY 4.0. | |
Transformer Market Analysis by Mordor Intelligence
The Transformer market size is expected to grow from USD 64.96 billion in 2025 to USD 69.66 billion in 2026 and is forecast to reach USD 98.84 billion by 2031 at 7.24% CAGR over 2026-2031.
Demand escalation stems from global grid modernization programs, surging renewable energy interconnections, and the electrification of transportation that together stretch existing infrastructure. Asia-Pacific leads with strong public-sector spending on transmission and distribution networks, while North America and Europe prioritize replacing equipment that entered service before 2000. Supply-chain constraints, particularly in grain-oriented electrical steel and copper, lengthen delivery cycles and compel utilities to place orders well in advance of project start dates. Competitive pressure centers on capacity expansions, digitalization, and sustainable materials as manufacturers strive to shorten lead times and integrate smart functionality into standard models in the transformer market.
Key Report Takeaways
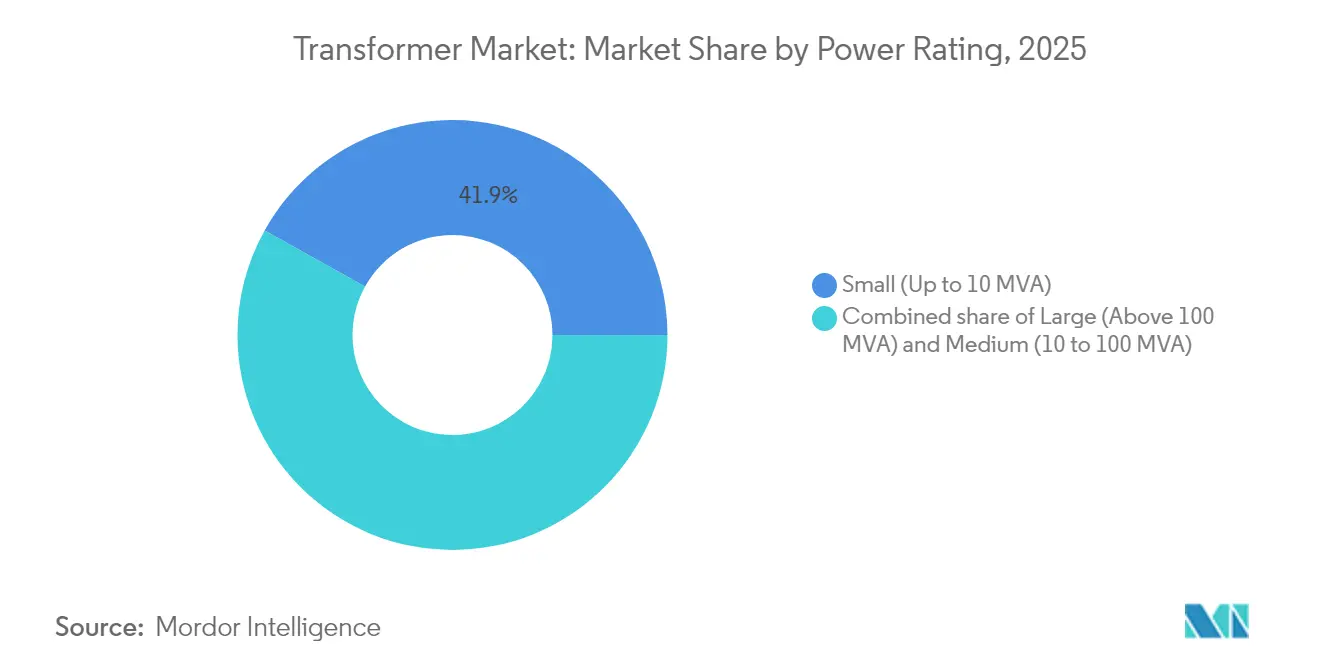
- By power rating, small transformers captured a 41.92% share of the transformer market size in 2025 and are projected to grow at an 8.06% CAGR through 2031.
- By cooling type, oil-cooled units accounted for 72.05% of 2025 revenue in the transformer market and are forecasted to expand at a 7.64% CAGR through 2031.
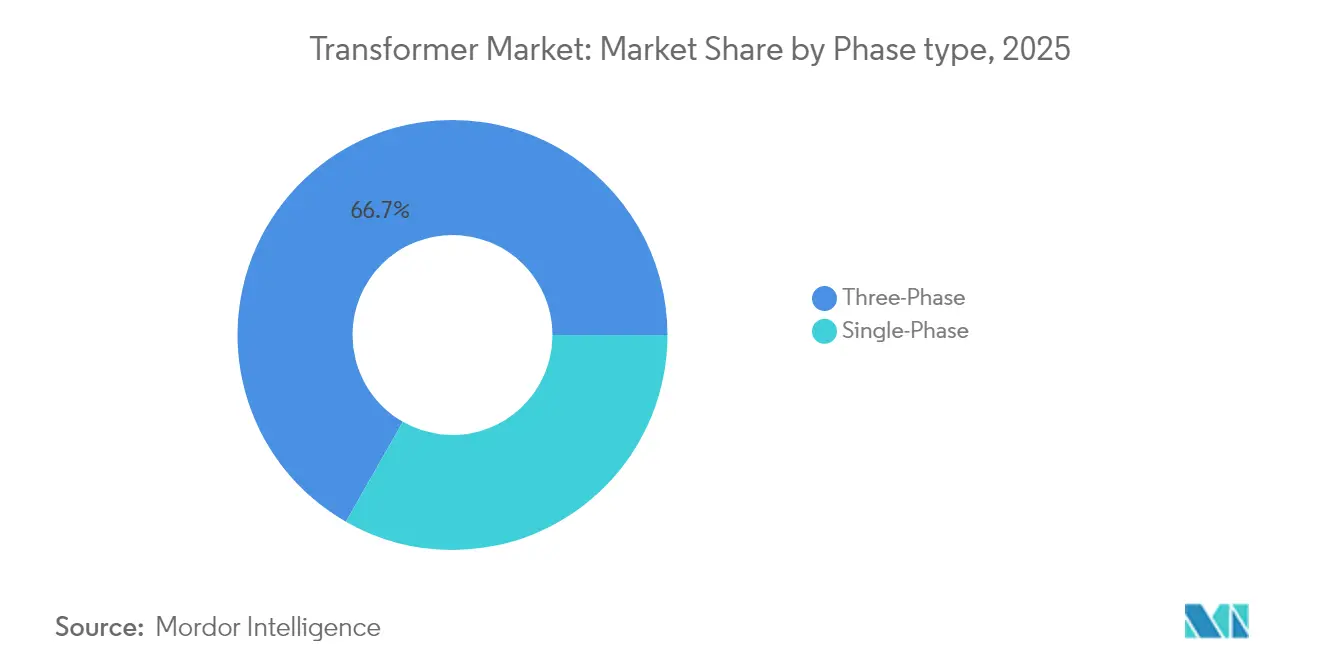
- By phase, three-phase configurations held 66.74% of the transformer market share in 2025 and are expected to exhibit a 7.39% CAGR outlook.
- By transformer type, distribution units accounted for a 60.98% share of the transformer market in 2025 and are projected to grow at a 7.62% CAGR.
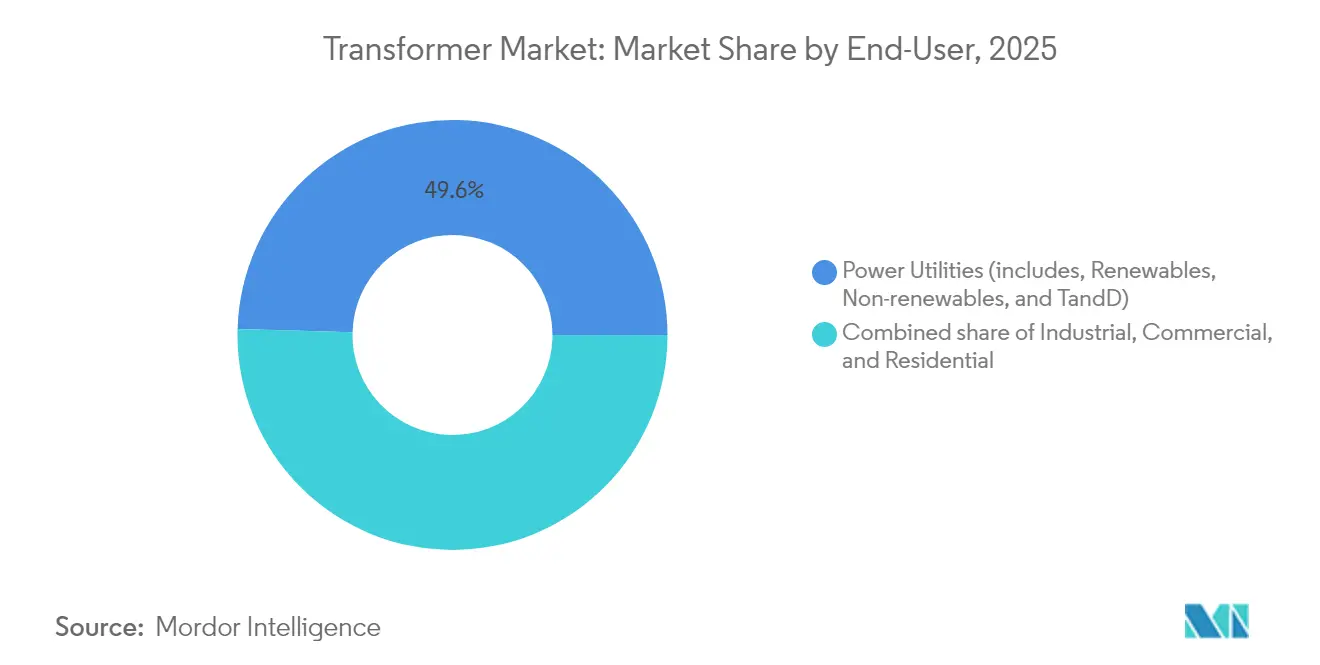
- By end-user, power utilities generated 49.55% of the 2025 revenue in the transformer market and are expected to record the fastest 8.09% CAGR during the forecast period.
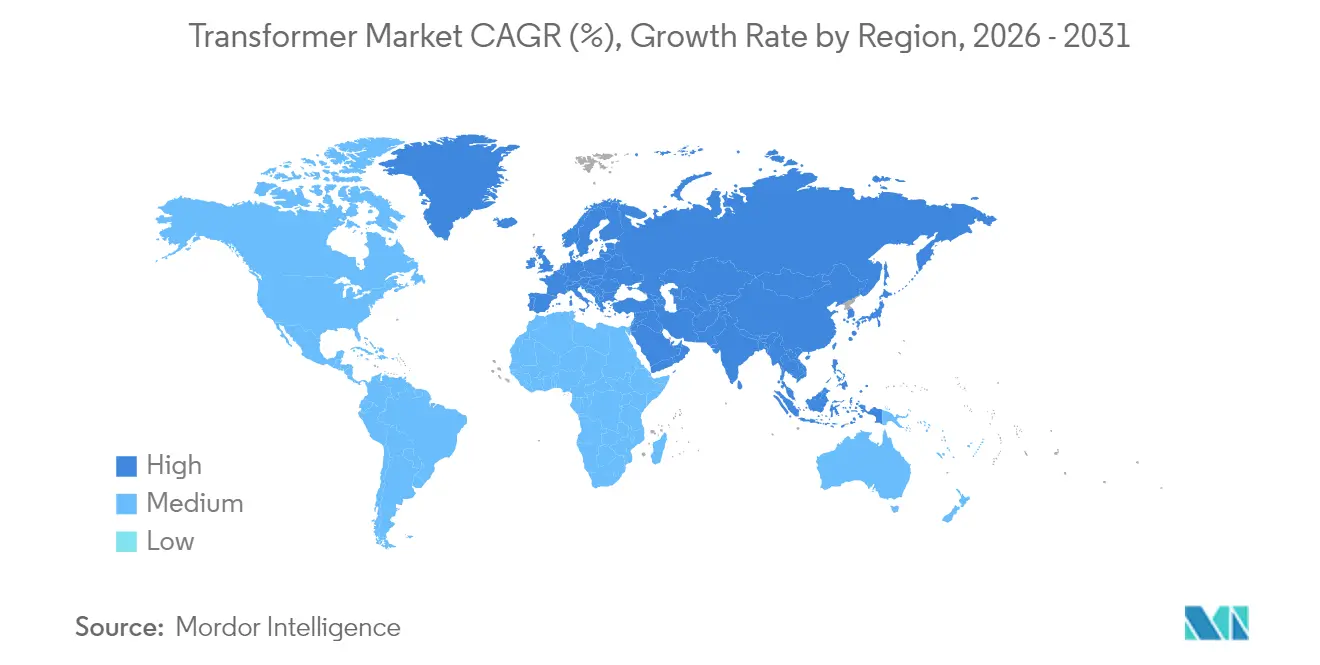
- By geography, the Asia-Pacific region dominated the transformer market with a 52.88% share in 2025, driven by aggressive grid build-outs and renewable energy deployment targets.
Note: Market size and forecast figures in this report are generated using Mordor Intelligence’s proprietary estimation framework, updated with the latest available data and insights as of 2026.
Global Transformer Market Trends and Insights
Drivers Impact Analysis*
| Driver | (~) % Impact on CAGR Forecast | Geographic Relevance | Impact Timeline |
|---|---|---|---|
| Grid-modernization programs in US & EU | +1.60% | North America & Europe | Medium term (2-4 years) |
| Accelerated renewable-energy interconnections | +1.90% | Global, strongest in APAC & Europe | Long term (≥ 4 years) |
| Electrification of transport & fast-charging corridors | +1.10% | Global, led by China, US, Europe | Medium term (2-4 years) |
| Surge in hyperscale data-center additions | +1.20% | Global, concentrated in US, APAC | Short term (≤ 2 years) |
| Digital-native smart transformers | +0.80% | Developed markets initially | Long term (≥ 4 years) |
| Hydrogen-ready high-voltage networks | +0.50% | Europe, Middle East, Australia | Long term (≥ 4 years) |
| Source: Mordor Intelligence | |||
Grid Modernization Programs Drive Infrastructure Renewal
Investment packages such as the USD 13 billion U.S. Grid Resilience and Innovation Partnerships program and the European Union’s REPowerEU initiative accelerate the replacement of transformers that entered service before 2000 in the transformer market. Utilities prioritize units with higher temperature classes, low-loss cores, and embedded sensors that transmit real-time loading and thermal data to control centers. Specifications are increasingly requiring interoperability with advanced distribution-management systems that can accommodate high levels of renewable penetration. Ordering patterns favor framework agreements that guarantee minimum production slots, insulating utilities from two-year standard lead times now common in North America. The premium placed on reliability and extreme-weather resilience pushes demand toward higher-rated oil-cooled models with forced-air cooling enhancements.
Renewable Energy Integration Accelerates Transmission Upgrades
Global photovoltaic additions expanded to 239 GW in 2022 and continue climbing, generating a need for step-up transformers equipped with on-load tap changers capable of rapid voltage adjustments. Wind developers specify high-impedance designs that mitigate fault currents while maintaining voltage stability across widely dispersed turbines. Middle East markets typify the trend; Saudi Arabia’s 130 GW renewable goal and the UAE’s USD 54 billion investment plan propel orders for desert-rated transformers that withstand 55 °C ambient temperatures and airborne dust shaping the transformer market.(1)Utilities Middle East, “Saudi Arabia’s 130 GW Renewable Target Spurs Grid Investments,” utilities-me.com Global procurement teams increasingly bundle transformers with STATCOMs and synchronous condensers to deliver turnkey interconnection packages that satisfy stringent grid-code requirements.
Transport Electrification Creates Distributed Infrastructure Demand
Electric-vehicle adoption raises electricity consumption and introduces high-current, short-duration peaks at charging depots. In the transformer market, Utilities install medium-voltage transformers with reinforced bushings and dual-stage cooling systems near highway corridors to serve 350 kW fast chargers. Residential uptake requires thousands of pole-mounted distribution units capable of handling bidirectional flows from vehicle-to-grid programs. Urban utilities are adopting advanced load-forecasting algorithms that integrate transformer sensor data to optimize feeder balancing, thereby deferring costly substation reinforcements.
Hyperscale Data-Center Expansion Drives High-Density Power Requirements
Artificial-intelligence workloads push data-center power densities beyond 100 MW per campus, necessitating banks of high-efficiency, low-loss transformers with redundant cooling circuits. Developers in Virginia, Texas, Singapore, and Hyderabad sign multi-year purchase agreements to secure supply, often reserving capacity two years prior to breaking ground. Combined with corporate renewable power-purchase agreements, these facilities create compound demand in transformer market for step-up transformers that tie dedicated solar or wind farms to the grid while meeting strict uptime Service Level Agreements.
Restraints Impact Analysis*
| Restraint | (~) % Impact on CAGR Forecast | Geographic Relevance | Impact Timeline |
|---|---|---|---|
| Acute global shortage of CRGO steel & long lead times | -1.30% | Global, most severe in North America | Short term (≤ 2 years) |
| Escalating transformer oil & copper price volatility | -0.90% | Global, emerging markets most affected | Medium term (2-4 years) |
| Cyber-security vulnerabilities in digital transformers | -0.60% | Developed markets with smart-grid deployment | Medium term (2-4 years) |
| Inertia in permitting sub-station upgrades | -0.80% | North America & Europe | Long term (≥ 4 years) |
| Source: Mordor Intelligence | |||
CRGO Steel Shortage Creates Manufacturing Bottlenecks
A limited global supply of grain-oriented electrical steel constrains core production, forcing manufacturers to quote delivery schedules of up to four years for large power transformers. U.S. utilities face a single domestic producer and are subject to tariffs on imported grades, which compounds cost and schedule risk. Factory throughput remains hard-capped because complex winding and core stacking for extra-high-voltage units cannot be fully automated. Firms announce multi-billion-dollar capacity additions, yet equipment lead times for new rolling mills and annealing lines exceed 30 months, delaying relief.
Copper Price Volatility Pressures Manufacturing Economics
Copper reached USD 5.20 per pound in May 2024 and is forecasted to average USD 6.81 per pound in 2025. Large transformers incorporate up to five tons of copper, exposing suppliers to severe margin swings. Tier-one manufacturers employ hedging strategies and escalation clauses, while smaller regional firms absorb price shocks that erode working capital.(2)Goldman Sachs, “Copper Outlook 2025: Scarcity Premium to Persist,” goldmansachs.comUtilities respond by favoring framework contracts that lock base-metal pricing at order placement to stabilize project budgets.
*Our forecasts treat driver/restraint impacts as directional, not additive. The impact forecasts reflect baseline growth, mix effects, and variable interactions.
Segment Analysis
By Power Rating: Distributed Generation Favors Smaller Capacities
Small units, up to 10 MVA, dominated revenue with 41.92% in 2025, and they are expected to outpace all other classes at an 8.06% CAGR through 2031. Rooftop solar, community battery systems, and neighborhood-scale microgrids proliferate in both emerging and developed economies. These applications reward compact footprints, low acoustic emissions, and high overload tolerance for fluctuating renewable inputs. Modular designs enable utilities to stock standardized spares that service multiple feeder voltages, thereby reducing warehouse inventory and decreasing mean-time-to-repair.
Medium transformers, ranging from 10 MVA to 100 MVA, retain strong traction in industrial estates and utility-scale renewable plants, where developers combine multiple 5 MW wind turbines into a single collector circuit. Although large power transformers above 100 MVA account for fewer shipments, each unit commands multi-million-dollar contract values that sustain specialized workshops and proprietary insulation technologies. Supply constraints for these custom giants remain the tightest, motivating utilities to maintain strategic spares even as energy-transition policies refocus budgets on distributed assets.


By Cooling Type: Liquid Insulation Sustains Technical Pre-eminence
Oil-cooled technology accounted for 72.05% of global revenue in 2025 and is expected to maintain a 7.64% CAGR through 2031, driven by its superior thermal conductivity and dielectric strength. Mineral oil remains the mainstream medium; however, utilities in Europe, Japan, and select U.S. states are increasingly specifying natural ester or synthetic fluids to meet environmental regulations and fire-safety codes. Ester fluids support higher temperature classes, enabling compact core-coil stacks that cut weight and shipping cost.
Air-cooled units retain a niche appeal in commercial buildings, underground substations, and renewable energy inverters, where leakage risks outweigh power density requirements. Continuous improvement in fin design, forced-air circulation, and aluminum-wound coils expands their feasible rating range; however, they still sacrifice efficiency headroom compared to oil-filled counterparts in high-load duty cycles.
By Phase: Three-Phase Efficiency Underpins Industrial Adoption
Three-phase models captured 66.74% of 2025 revenue and are expected to track a 7.39% CAGR through 2031, as industrial automation, variable-frequency drives, and large-horsepower motors continue to increase their share of the load mix. Balanced phase currents reduce copper losses and enhance voltage regulation on long feeders serving manufacturing hubs. End users request low-loss amorphous cores and stacked-step lap joints to push efficiency gains past regulatory minimums.
Single-phase units remain prevalent on North American residential networks and rural electrification projects, yet rising household power draws from heat pumps and EV chargers increasingly justify split-phase or compact three-phase service drops. Manufacturers respond with novel k-factor ratings that accommodate nonlinear household loads, such as solar inverters and Level 2 car chargers.
By Transformer Type: Distribution Fleet Anchors Growth
Distribution transformers held a 60.98% share in 2025 and are forecast to grow at a 7.62% CAGR to 2031 as utilities reinforce low-voltage networks for electrification. Pole- and pad-mounted units now integrate low-voltage ride-through, reverse-power flow safeguards, and asset-health monitors that stream data to cloud dashboards. The U.S. National Renewable Energy Laboratory projects distribution capacity may need a 260% uplift by 2050, presaging a sustained replacement and expansion cycle.
Power transformers occupy critical nodes at generation switchyards and bulk-transmission substations, but their replacement rhythm remains slower due to 40-year design lives. Nevertheless, renewable developers ordering gigawatt-scale onshore wind parks drive the installation of multi-unit blocks of 400 kV step-up transformers, underpinning a healthy baseline for the high-voltage segment.
By End-User: Utilities Command Investment Momentum
Power utilities generated 49.55% of market revenue in 2025 and are expected to advance at an 8.09% CAGR, driven by decarbonization mandates, reliability standards, and stimulus funding. Transmission operators procure high-impedance autotransformers that segment regional interconnects, while distribution companies favor low-loss, hermetically sealed units that curb network losses and ease maintenance. Industrial buyers in metals, chemicals, and LNG integrate dedicated step-down transformers with arc-flash mitigation features and oversized neutral conductors to serve variable-speed drives.
Commercial building owners equip indoor cast-resin units that meet fire codes and accept high harmonic distortion from data center power supplies. Residential growth drives electrification and suburban expansion, prompting utilities to deploy both single-phase replacements and split-phase upgrades simultaneously.
Geography Analysis
Asia-Pacific led revenue with 52.88% share in 2025 and exhibits the highest 8.23% CAGR outlook. China continues to expand ultra-high-voltage corridors that ferry renewable power from western provinces to coastal load centers, while India channels federal incentives into interstate transmission lines and city distribution upgrades. Southeast Asian nations allocate multibillion-dollar budgets to electrification, prompting joint ventures between local fabricators and global specialists for medium-voltage units. Technology contributions from Japan and South Korea introduce advanced amorphous-core geometries and digital monitoring packages that spread across regional supply chains, raising baseline efficiency expectations.
North America represents a replacement-driven environment where two-decade-old assets are near the end of their life. Lead times ballooned to 60-70 weeks for standard distribution units, prompting federal initiatives to bolster domestic manufacturing. Utilities direct capital toward hardened substation transformers capable of withstanding wildfire and hurricane exposures, incorporating forced-oil/air cooling and higher short-circuit withstand ratings. Canada emphasizes low-loss standards aligned with CSA C802, pushing suppliers to adopt amorphous cores as the default on new bids.
Europe maintains steady demand through the integration of renewable energy and cross-border interconnector projects under the REPowerEU banner. Utilities retrofit high-voltage nodes with online dissolved-gas monitors and bushings rated for higher current densities, preparing networks for 1,236 GW of targeted renewable capacity by 2030. Stringent eco-design rules elevate minimum efficiency and favor ester-filled medium-voltage units in densely populated zones. Eastern European markets attract foreign direct investment in automotive and data-center developments, further boosting orders for medium KVA classes.
The Middle East and Africa are combining utility-scale solar, green-hydrogen pilots, and grid-hardening programs to open new procurement channels. Saudi Arabia’s renewable roadmap and the UAE’s USD 54 billion commitment generate bulk orders for desert-rated, natural-ester-filled transformers with aluminum windings to manage weight on remote-site roads. South American demand centers on Brazil, where industrial expansion in mining and metals sparks upgrades to 230 kV substations and drives domestic manufacturing expansions, such as WEG’s R$2.6 billion investment to expand transformer output.

Competitive Landscape
The transformer market exhibits moderate fragmentation, with the top five players collectively holding just over half of the global revenue, leaving ample room for regional specialists. ABB, Siemens Energy, and Hitachi Energy are executing multi-regional capacity expansions exceeding USD 6 billion through 2027, targeting shorter lead times and broader digital feature sets. Hitachi Energy alone has earmarked USD 250 million for 2025 to reduce delivery cycles by up to 30% for standard ratings.(4)Hitachi Energy, “Capacity Expansion Press Release,” hitachienergy.com These firms integrate vertically across core lamination, coil winding, and sensor assembly, capturing margin and tightening quality control.
Digital capability differentiates offerings as utilities demand predictive maintenance and cybersecurity compliance. Within the broader transformers market, Siemens Energy markets transformers that embed IEC 62443-certified gateways, streamlining data to cloud-native asset-performance platforms and generating service revenue, thereby strengthening customer relationships. Eaton and Schneider Electric emphasize modular, factory-assembled substations that incorporate ester-filled transformers, compact switchgear, and SCADA interfaces, streamlining installation on constrained urban sites.
Cost-competitive challengers in China and India scale production using government incentives and local workforce advantages. They penetrate Africa, Southeast Asia, and Latin America with price-led bids backed by concessional financing. Western utilities weigh these options cautiously, balancing cost savings against stricter qualification protocols and cybersecurity requirements. In the transformers market, niche innovators target solid-state transformers for rail and fast-charging applications; however, wide-scale adoption remains constrained by the cost of silicon-carbide devices and EMC considerations.
Transformer Industry Leaders
Siemens AG
ABB Ltd
General Electric Company
Mitsubishi Electric Corporation
Schneider Electric
- *Disclaimer: Major Players sorted in no particular order

Recent Industry Developments
- April 2025: Hitachi Energy announced a USD 22.5 million expansion of its Virginia plant, adding 150 jobs and boosting capacity by 25% to meet North American renewable-project demand.
- March 2025: Hitachi Energy announced an additional USD 250 million investment by 2027 to expand global production of critical transformer components.
- March 2025: Hitachi Energy invested USD 69 million in Ludvika, Sweden, to enlarge high-voltage manufacturing and expand R&D for next-generation grid technologies.
- February 2025: Eaton Corporation has invested USD 340 million to build a new three-phase transformer manufacturing facility in Jonesville, South Carolina.


Global Transformer Market Report Scope
By Power Rating
| Large (Above 100 MVA) |
| Medium (10 to 100 MVA) |
| Small (Up to 10 MVA) |
By Cooling Type
| Air-cooled |
| Oil-cooled |
By Phase
| Single-Phase |
| Three-Phase |
By Transformer Type
| Power |
| Distribution |
By End-User
| Power Utilities (includes, Renewables, Non-renewables, and T&D) |
| Industrial |
| Commercial |
| Residential |
By Geography
| North America | United States |
| Canada | |
| Mexico | |
| Europe | Germany |
| United Kingdom | |
| France | |
| Italy | |
| Spain | |
| Russia | |
| Rest of Europe | |
| Asia-Pacific | China |
| India | |
| Japan | |
| South Korea | |
| ASEAN Countries | |
| Australia and New Zealand | |
| Rest of Asia-Pacific | |
| South America | Brazil |
| Argentina | |
| Chile | |
| Rest of South America | |
| Middle East and Africa | Saudi Arabia |
| United Arab Emirates | |
| South Africa | |
| Egypt | |
| Rest of Middle East and Africa |
| By Power Rating | Large (Above 100 MVA) | |
| Medium (10 to 100 MVA) | ||
| Small (Up to 10 MVA) | ||
| By Cooling Type | Air-cooled | |
| Oil-cooled | ||
| By Phase | Single-Phase | |
| Three-Phase | ||
| By Transformer Type | Power | |
| Distribution | ||
| By End-User | Power Utilities (includes, Renewables, Non-renewables, and T&D) | |
| Industrial | ||
| Commercial | ||
| Residential | ||
| By Geography | North America | United States |
| Canada | ||
| Mexico | ||
| Europe | Germany | |
| United Kingdom | ||
| France | ||
| Italy | ||
| Spain | ||
| Russia | ||
| Rest of Europe | ||
| Asia-Pacific | China | |
| India | ||
| Japan | ||
| South Korea | ||
| ASEAN Countries | ||
| Australia and New Zealand | ||
| Rest of Asia-Pacific | ||
| South America | Brazil | |
| Argentina | ||
| Chile | ||
| Rest of South America | ||
| Middle East and Africa | Saudi Arabia | |
| United Arab Emirates | ||
| South Africa | ||
| Egypt | ||
| Rest of Middle East and Africa | ||


Key Questions Answered in the Report
How large was the transformer market in 2026?
The transformer market size stood at USD 69.66 billion in 2026.
What is the forecast CAGR for transformers market between 2026 and 2031?
Market revenue is projected to grow at a 7.24% CAGR through 2031.
Which region leads global demand for transformers market?
Asia-Pacific held 52.88% transformer market share in 2025, driven by grid build-outs and renewable projects.
Why are lead times for large power transformers so long?
Limited CRGO steel capacity, custom engineering requirements, and constrained factory throughput now push delivery schedules up to four years.
What technology trends are influencing transformer specifications?
Utilities increasingly request smart transformers with IoT sensors, cybersecurity safeguards, and ester-based cooling fluids for sustainability and reliability gains.
Page last updated on:


