
China Copper Market Size and Share
Market Overview
| Study Period | 2020 - 2031 |
|---|---|
| Forecast Data Period | 2026 - 2031 |
| Base Year Market Size (2025) | 12.88 Million tons |
| Market Volume (2026) | 13.56 Million tons |
| Market Volume (2031) | 17.54 Million tons |
| Growth Rate (2026 - 2031) | 5.28 % |
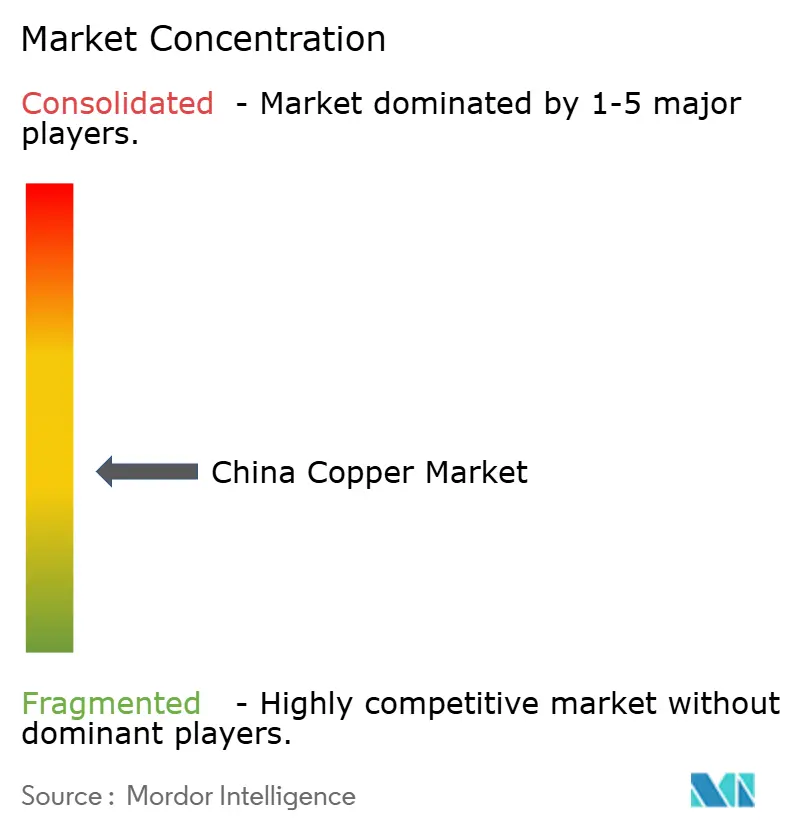
| Market Concentration | Medium |
Major Players *Disclaimer: Major Players sorted in no particular order Image © Mordor Intelligence. Reuse requires attribution under CC BY 4.0. | |
China Copper Market Analysis by Mordor Intelligence
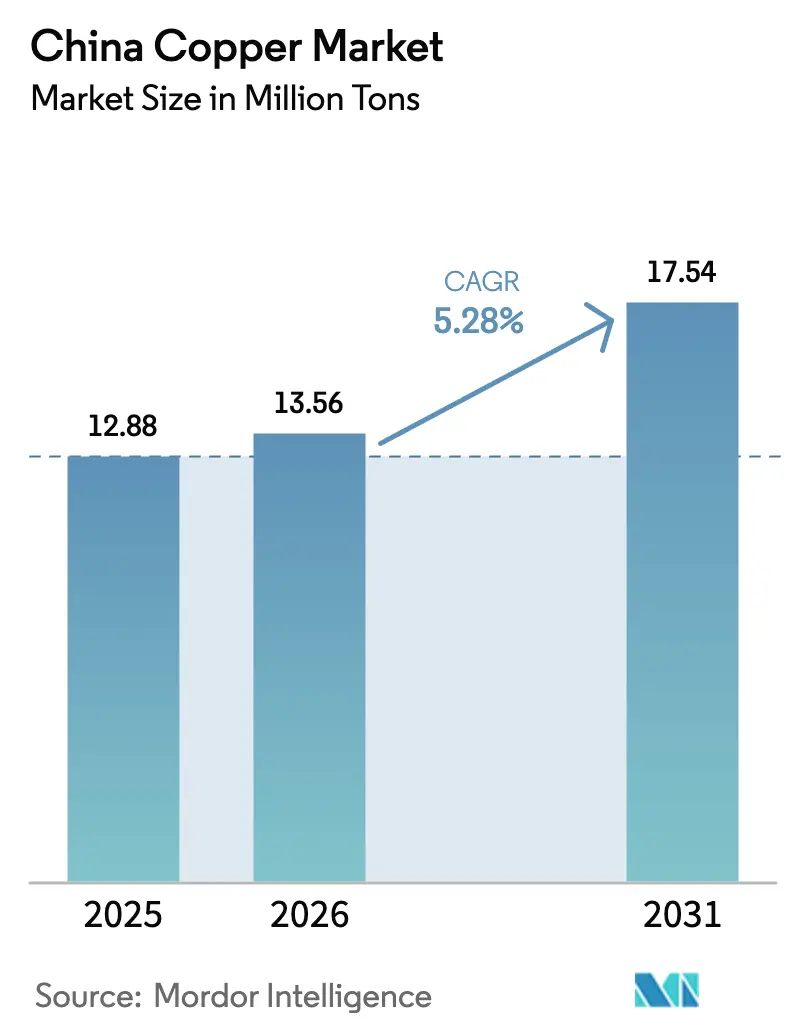
China Copper Market size in 2026 is estimated at 13.56 Million tons, growing from 2025 value of 12.88 Million tons with 2031 projections showing 17.54 Million tons, growing at 5.28% CAGR over 2026-2031. Robust renewable-energy build-outs, grid modernization, and vehicle electrification anchor this expansion. State-backed investments in ultra-high-voltage (UHV) transmission lines, worth USD 89 Billion for 2025, channel copper into long-distance infrastructure while cushioning the market from cyclical swings. Demand also gathers pace from electric-vehicle (EV) manufacturing hubs, where battery, traction-motor, and charging-station build-outs intensify copper use. Industrial automation in coastal factories and the mushrooming of artificial intelligence (AI)-ready data centers reinforce a consumption pattern far less sensitive to traditional construction cycles. On the supply side, capacity additions by state-owned smelters reshuffle market power even as tighter emission caps squeeze operating margins.
Key Report Takeaways
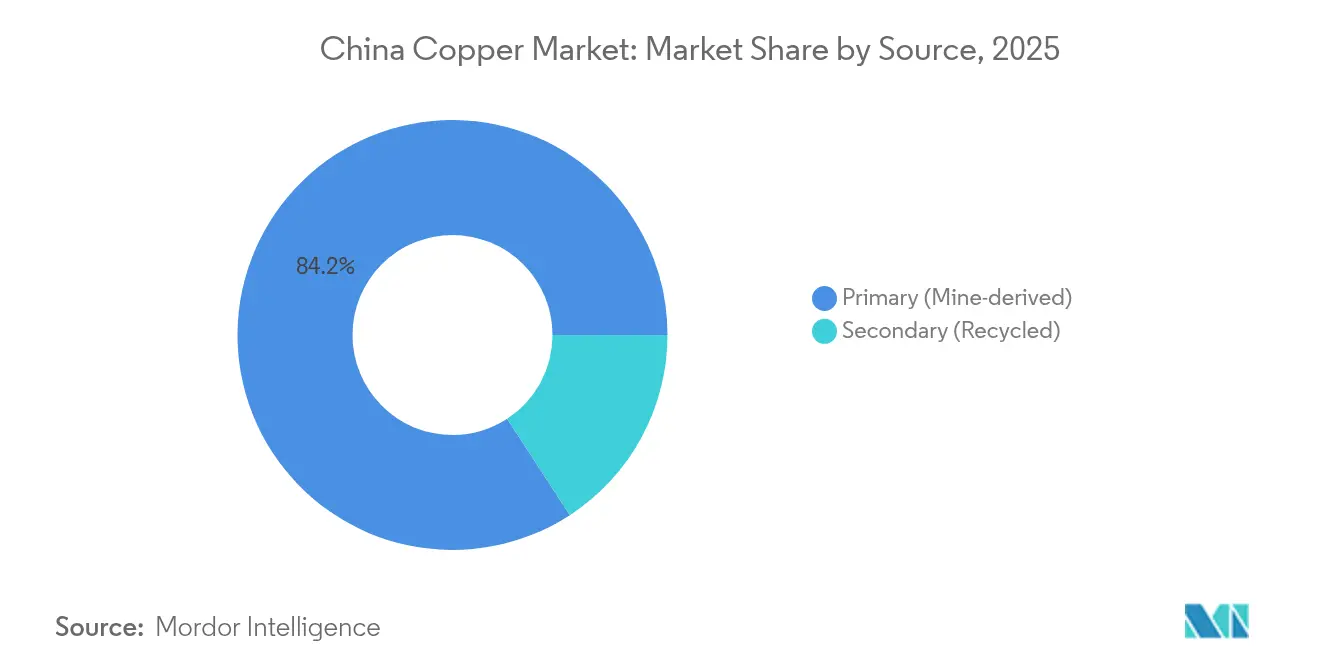
- By source, primary copper retained an 84.19% share of the China Copper market in 2025. However, secondary copper is forecasted to expand at the fastest CAGR of 6.35% through 2031.
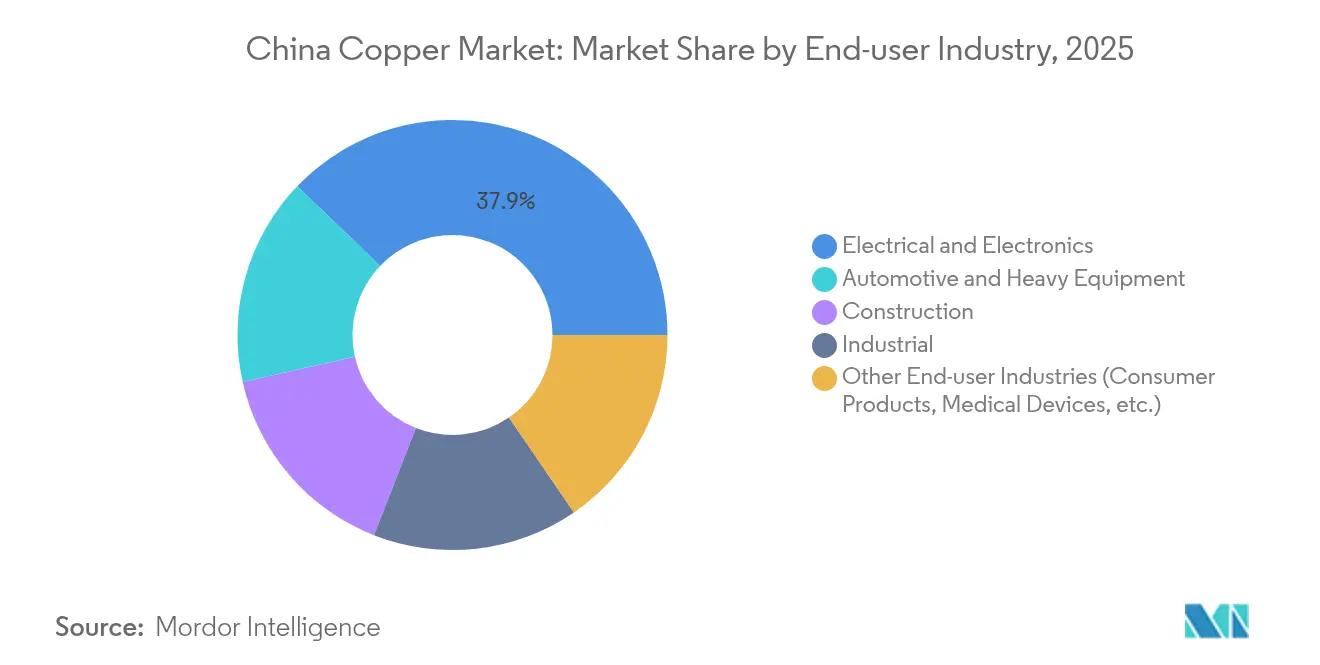
- By end-user industry, electrical and electronics captured 37.85% of the China Copper market share in 2025. Whereas, automotive and heavy equipment is projected to register the highest growth at 6.59% CAGR between 2026 and 2031.
Note: Market size and forecast figures in this report are generated using Mordor Intelligence’s proprietary estimation framework, updated with the latest available data and insights as of 2026.
Worldwide, activity is shaped by contributions from multiple countries and regions, with China representing one among them. The global report on copper market by Mordor Intelligence reflects how these countries and regional layers combine into a single system.
Market Trends and Insights
Drivers Impact Analysis of China Copper Market*
| Driver | (~) % Impact on CAGR Forecast | Geographic Relevance | Impact Timeline |
|---|---|---|---|
| Surging Demand From Renewable Energy and Grid Expansion | +1.8% | National focus, Western renewable bases | Long term (≥ 4 years) |
| Rapid Build-out of Domestic EV and Battery Manufacturing | +1.5% | Coastal production hubs, nationwide adoption | Medium term (2-4 years) |
| Accelerating Deployment of AI-ready Data-centres | +0.9% | Eastern economic corridors, Tier-2 city clusters | Medium term (2-4 years) |
| Government-backed Western Region Infrastructure Push | +0.7% | Western provinces, Belt and Road corridors | Long term (≥ 4 years) |
| Upscaling of Smart Factory Automation in Coastal Provinces | +0.6% | Guangdong, Jiangsu, Zhejiang manufacturing zones | Short term (≤ 2 years) |
| Source: Mordor Intelligence | |||
Surging Demand From Renewable Energy and Grid Expansion
A nationwide pivot toward clean-energy generation is placing copper at the heart of China’s electrical-infrastructure rollout. Each kilometer of a new ultra high voltage (UHV) line embeds about 6 tons of refined copper, and 38 such lines were already in service by April 2024, linking renewable-rich western deserts to coastal load centers. The ongoing Gansu–Zhejiang ±800 kV link alone consumes over 14,000 tons of copper and transmits 36 Billion kWh annually, more than half stemming from wind and solar plants. Solar and onshore wind capacity, which together target 1,200 GW by 2030, require copper-heavy cabling, inverters, transformers, and switchgear that extend well beyond classical demand models. Because grid investments are locked in through multi-year state plans, they shelter the China Copper market from short-term construction slumps while anchoring floor prices for refined metal.
Rapid Build-out of Domestic EV and Battery Manufacturing
Battery-electric vehicles average close to 70 kg of copper per unit, covering wiring harnesses, rotors, and battery-pack connectors. Even if industry roadmaps halve intensity to 38 kg by 2030 through design efficiencies, absolute tonnage will still rise on surging output. China manufactured 958.7 Million vehicles in 2023, up 35.8% yearly, and continues to scale dedicated assembly lines in Shanghai, Guangzhou, and Changzhou. Charging networks amplify demand: every additional megawatt of charging capacity deploys 20 to 40 tons of copper in conductors, switchgear, and thermal-management loops. Vertical integration inside automakers’ supply chains ensures that a large portion of copper sourcing and processing remains domestic, lending visibility to long-term offtake agreements for smelters.
Accelerating Deployment of AI-ready Data-centres
AI workloads raise power-density thresholds and cooling complexity, both of which intensify copper intensity per megawatt of IT load. Chinese data-center energy consumption reached 140 Billion kWh in 2024 and could triple by 2035, implying more than 2.6 Million tons of refined copper per year for server racks, busbars, and chilled-water loops. Large hyperscalers are adopting high-current copper interconnects in preference to fiber for short-reach, latency-sensitive switching, amplifying near-term orders for wire-rod producers. The resulting demand nodes emerge in Jiangsu, Zhejiang, and Hebei, where land, grid access, and cold-climate advantage converge, reshaping regional flows of refined metal.
Government-backed Western Region Infrastructure Push
The Western Development Strategy funnels capital into railways, highways, and industrial parks across Xinjiang, Tibet, and Inner Mongolia. Projects along the China–Pakistan Economic Corridor, valued at USD 60 Billion, incorporate copper-rich power plants and transmission assets. Recent geological surveys on the Qinghai-Xizang Plateau identified more than 20 Million tons of copper resources, prompting rapid mine-site electrification and haul-road construction that lift local refined-copper use. Because UHV lines bridge western generators with eastern consumers, copper moves through extended project pipelines that span exploration, beneficiation, smelting, and final fabrication.
Restraints Impact Analysis of China Copper Market*
| Restraint | (~) % Impact on CAGR Forecast | Geographic Relevance | Impact Timeline |
|---|---|---|---|
| Tightening Sulphur-dioxide and Carbon-emission Caps on Smelters | -1.2% | National, with severe impact on industrial provinces | Short term (≤ 2 years) |
| Persistent Copper-concentrate Deficit and Low TC/RCs | -0.8% | Global supply chains affecting domestic smelters | Medium term (2-4 years) |
| Rising Competition from Aluminum Substitution in 1 kV Cabling | -0.6% | National, with focus on construction and electrical sectors | Long term (≥ 4 years) |
| Source: Mordor Intelligence | |||
Tightening Sulphur-dioxide and Carbon-emission Caps on Smelters
Updated environmental standards restrict SO₂ to 6.3 lb/h and tighten particulate and lead limits for primary smelters, obliging operators to retrofit scrubbers and electrostatic precipitators at high capital cost [1]. Provincial regulators have also curbed petroleum-coke firing, eliminating 12 Million tons of annual fuel imports and forcing a switch to cleaner natural gas. Compliance timelines of two years risk near-term output cuts among mid-tier smelters, lowering domestic cathode supply just as consumption scales. Government quotas on new capacity now require applicants to hold equity stakes in upstream mines, slowing project approvals and concentrating market power among existing state-owned incumbents.
Persistent Copper-concentrate Deficit and Low TC/RCs
Global concentrate tightness collapsed spot treatment charges to single-digit USD per tonne in late-2024, a 90% contraction from prior-year averages. Chinese smelting additions of 1.25 Million tons per year outstrip new mine supply, binding domestic refiners to unfavorable benchmark negotiations with suppliers from Chile and Peru. Import tariffs of 34% on selected US-sourced scrap further constrain feedstock diversity, leaving refineries vulnerable to price spikes and relogistics costs. Prolonged margin pressure may shutter less efficient converters and contribute to structural refined-copper shortfalls, tempering the otherwise strong growth trajectory of the China copper market.
*Our forecasts treat driver/restraint impacts as directional, not additive. The impact forecasts reflect baseline growth, mix effects, and variable interactions.
China Copper Market Segment Analysis
By Source:
Primary Dominance Amid Secondary AccelerationPrimary copper commanded 84.19% of the China Copper market in 2025 as smelters leveraged consistent ore flows from Jiangxi Copper and Zijin Mining as well as long-term offtake agreements with Chilean and Peruvian producers. The China Copper market size for primary material is expected to track a 5.04% CAGR through 2031, supported by UHV grid projects and electric vehicle (EV) battery-foil expansions. Although smaller, secondary copper is set to gain share at a 6.35% CAGR, helped by a January 2025 tariff cut on recycled-copper imports to 0% and city-level scrap-collection pilots targeting 400,000 tons of annual recycled output by 2025 . Growing circular-economy mandates and rising treatment-charge stress encourage smelters to substitute concentrates with scrap, allowing secondary flows to dilute overall feedstock risk. Recyclers have invested in automated dismantling lines that lift recovery rates on wire harnesses and air-conditioner coils, narrowing the quality gap with virgin cathode.

By End-user Industry:
Electronics Leadership with Automotive MomentumElectrical and electronics held 37.85% of the China Copper market share in 2025 on the back of extensive consumer-electronics assembly, telecommunication-equipment production, and data-center build-outs. Segment sales are projected to grow at 4.05% CAGR, underpinned by rising server-grade cable demand and network-edge device upgrades. Automotive and heavy equipment, although smaller in base, is forecast to outpace peers at a 6.59% CAGR through 2031 as pure EVs keep more than 60% of national auto sales and each charging pile deploys up to 8 kg of copper in busbars and cooling coils. Construction contributes steady baseline demand through smart-grid meters and elevator modernization, while industrial automation adds episodic spikes that sync with factory-upgrade cycles. Collectively these consumption avenues reinforce the structural uptrend in the China Copper market size even when single sectors face cyclical pauses.
Geography Analysis
Eastern coastal provinces, Guangdong, Jiangsu, and Zhejiang, absorbed the largest slice of refined metal in 2025 owing to export-oriented electronics clusters and well-developed logistics. The China copper market size attached to these three provinces surpassed 5.24 Million tons in 2026, equal to nearly 40% of national demand. Beijing–Tianjin–Hebei registers the quickest advance, recording a forecast 6.84% CAGR as AI-ready data-center campuses mushroom around Zhangbei and Langfang, both linked to renewable energy corridors. Central provinces such as Hubei and Hunan serve as trans-shipment and fabrication hubs, supporting wire-rod, alloy-tube, and transformer makers that supply the coast. Western China brings emerging volume aided by resource-driven infrastructure spending and the commissioning of large solar-plus-storage parks. Ultra-high-voltage corridors like the 2,370 km Gansu–Zhejiang line knit western generation with eastern consumption, knitting regional price convergence and deepening copper flows across inland logistic routes
Value Chain Analysis
China copper supply starts with a constrained upstream base and a large downstream refining and fabrication system. Domestic mine output covers about 22% of smelter feed needs, so concentrate and some scrap imports remain critical to keep primary lines running, particularly for large operators such as Jiangxi Copper, Tongling Non-ferrous Metals, and Jinchuan. Primary smelting hubs tend to cluster around established non-ferrous centers, such as Guixi/Yingtan in Jiangxi, where concentrates are converted into cathode and then into wire rod, bars, tubes, and high-spec foil for grid, electronics, EV, and industrial customers.
On the downstream side, processors and fabricators feed electrical and electronics (the largest end-user by share in 2025) and fast-scaling auto electrification value chains. Recycling is also becoming a larger parallel feed channel as secondary copper gains share. Scrap collection and preprocessing, including sorting, dismantling, and upgrading, plus secondary smelting and refining, can reduce exposure to low TC/RC cycles and imported concentrate tightness. Even so, the chain remains sensitive at the import and logistics stage, and at the smelting stage, where policy constraints on new capacity and environmental compliance can shift utilization and bargaining power.
Competitive Landscape
The China Copper market possesses moderate concentration. Top state-owned groups benefit from policy support, home-based smelting capacity, and dedicated ore pipelines. For instance, Jiangxi Copper Corporation controls a domestic mining-to-refining chain exceeding 1.2 Million tons, while Zijin Mining produced 1.01 Million tons of copper in 2024 after ramping the Qulong mine and Serbian acquisitions. CMOC Group is expanding overseas exposure through a USD 420 Million buyout of Ecuador’s Cangarejos project, gaining an eventual 41 Million lb annual copper stream. Private entrants focus on scrap-based refining and high-value copper-foil lines, hedging against concentrate scarcity and regulatory hurdles. Recycling alliances between smelters and appliance manufacturers illustrate vertical integration aimed at securing steady scrap inflows. Cross-border joint ventures with Belt and Road partners continue as Chinese groups lock in off-shore ore sources to buffer domestic supply deficits.
China Copper Industry Leaders
-
Jiangxi Copper Corporation
-
Zijin Mining Group Co., Ltd.
-
CMOC
-
Tongling Non-ferrous Metals Group Holding Co., Ltd.
-
Jinchuan Group Co., Ltd.
- *Disclaimer: Major Players sorted in no particular order
China Copper Market Companies Covered in this Report
- Aluminum Corporation of China Limited (CHALCO)
- China Daye Non-Ferrous Metals Mining Limited
- CMOC
- Jiangxi Copper Corporation
- Jinchuan Group Co., Ltd.
- MMG Australia Limited
- Tongling Non-ferrous Metals Group Holding Co., Ltd.
- Zijin Mining Group Co., Ltd.
Market Opportunities and Future Outlook
Policy-driven resource security is creating whitespace across domestic upstream development and higher-efficiency conversion of lower-quality feeds. China set a target to raise domestic copper ore reserves by 5% to 10% by 2027, which supports opportunities for mine development services, beneficiation upgrades, and electrification of mine sites in western resource regions. At the company level, programs centered on capacity release at major deposits, including Zijin Mining's focus on Julong, Zhunuo, and Xietongmen copper-linked assets, also point to demand for mining equipment, processing reagents, and dependable power and logistics links into smelting corridors.
Demand-side momentum is concentrating in copper-intensive electrification applications where performance and reliability matter, creating room for higher-end products such as battery-foil, high-conductivity rod, and specialty alloys used in grid equipment, EV platforms, and data-center power distribution. The installed base of ultra-high-voltage transmission (38 lines in service by April 2024) and the stated USD 89 billion UHV investment program for 2025 underpin sustained pull-through into wire and transformer supply chains. Separately, the rising secondary copper share points to unmet need in standardized scrap grading, compliant collection networks, and processing capacity that can deliver more consistent feed for refineries and fabricators.
Recent Industry Developments in China Copper Market
- July 2026: CMOC Group issued an earnings outlook indicating a sharp year-on-year increase in first-half 2026 profit, citing stronger contributions from its copper and gold operations. The update highlighted how integrated miners with diversified metal exposure can fund resource and capacity programs, even as concentrate markets remain tight for many standalone smelters.
- April 2026: Zijin Mining released its first-quarter 2026 report, disclosing mine-produced copper output for the quarter. The filing showed continued scale-up at a major domestic producer, supporting feed availability into China-focused refining and downstream fabrication chains.
- February 2025: China tightened rules for new copper smelters under its 2025-2027 copper industry plan, requiring applicants to secure mine supply through ownership or equity stakes. The policy raises barriers to entry for greenfield smelting and constrains incremental expansion among incumbents without upstream access, affecting the pace at which new refining capacity can be added.
China Copper Market Report Scope and Research Methodology
Market Definition and Coverage
This market is defined as the copper supplied and consumed within China across primary (mine derived) and secondary (recycled) sources, measured in volume terms for refined copper and key semi finished forms used by downstream industries.
Scope exclusions: We exclude copper ore and concentrate mining value, pure trading margins, and finished goods where copper is only an embedded input (for example, end products like appliances or vehicles).
Segments Covered in This Report
- By Source
- Primary (Mine-derived)
- Secondary (Recycled)
- By End-user Industry
- Automotive and Heavy Equipment
- Construction
- Electrical and Electronics
- Industrial
- Other End-user Industries (Consumer Products, Medical Devices, etc.)
Data Sources, Market Sizing, and Validation
Desk Research
Desk work started with public production, usage, and trade series, so the demand pool for China could be framed before assumptions were applied. We relied on sources such as the International Copper Study Group for refined usage and supply balance context, China industry releases from major nonferrous associations, and National Bureau of Statistics level output indicators for metals processing.
To capture real world price direction and policy markers, we reviewed official customs publications and open trade statistics, plus technical papers and standards references that clarify typical copper forms and conversion factors. Company filings, annual reports, and investor presentations were used to sanity check capacity additions and operating rate narratives. We also used paid subscriptions for company financials and intelligence, patents, and shipment level import export checks where it helped validate timing and scale. These sources are illustrative, and many other public references were also used for data collection, validation, and clarification.
Primary Interviews and Surveys
Primary work focused on talking with stakeholders across smelting, recycling, distribution, and large end use buying roles, so assumptions on product mix, utilization, and pricing could be adjusted to what is actually happening in China. We also checked views from industry consultants and domain experts on how demand is shifting across power grid, construction, and manufacturing, then used these inputs to close gaps left by public datasets and align the final model.
Distribution of primary research fieldwork respondents
| Company type | Respondent position |
|---|---|
| Top tier: 30% | CXOs: 12% |
| Mid tier: 53% | Functional/Unit leaders: 40% |
| Smaller Players: 17% | Managers: 48% |
Market-Sizing & Forecasting
The core sizing was built from a top-down reconstruction of China's copper demand using refined copper usage, semi finished output signals, and trade flows, then translated into a consistent volume pool for the market boundary. Once that demand pool was built, we corroborated it with selective bottom-up approximations, such as sampled capacity by process step, channel checks on typical throughput, and price per ton cross checks, so outputs stayed realistic.
Key inputs used in the model included refined copper apparent usage levels, secondary supply availability trends (scrap collection and recycled feed), and net import patterns for refined copper, along with operating rate direction for smelters and fabricators. We also tracked copper price movements and conversion factors between copper forms, since these influence substitution and inventory behavior during sharp price swings. For forecasting, we ran scenario analysis around demand drivers like grid investment momentum, construction activity signals, and manufacturing output, and we aligned the final path to what interviewees described as the most likely base case. When bottom-up views were incomplete, we filled gaps with conservative ranges and then normalized them back to the top-down totals so no single assumption could over steer the outcome.
Data Validation & Update Cycle
Validation was done by triangulating model outputs against independent signals such as refined usage checkpoints, import dependence trends, and price direction, followed by a variance review when any year on year jump looked out of line. If a mismatch was found, the assumptions were reopened, and the relevant experts were re contacted to confirm whether the change was structural or primarily timing related.
Before sign off, the work goes through multi step analyst review so conversion factors, unit consistency, and growth drivers are checked in a repeatable way. Reports are refreshed annually, and interim updates are made when material events occur that can move supply, demand, or pricing assumptions. Right before delivery, we do a final scan to reflect the latest data releases, so clients receive an updated view.
Mordor Intelligence's China Copper Market Size Versus Other Published Estimates
Published market estimates for China copper do not always match because the underlying market boundary is not the same, and because some sources mix trade value with domestic consumption volume. Differences also come from how recycling is treated, which copper forms are counted, and whether the estimate is pegged to a fixed price deck or updated with recent price cycles.
By checking refined usage and net import patterns, Mordor Intelligence keeps the model anchored to a volume based demand pool, while some estimates drift when they proxy the market using only import value or a narrow HS code lens.
Benchmark comparison
| Source | Market Size | Gaps in Research Methodology |
|---|---|---|
| Mordor Intelligence | USD 13.56 M (2026) | |
| Trade Data Platform A | USD 40.25 B (2024) | Often represents import market value for refined copper and alloys over a rolling window, which can overstate domestic market size by excluding local production and by mixing price effects with demand. |
| Industry Commentary B | USD 37.70 B (2024) | Frequently aligns to refined copper import value for a single HS definition, which misses inland supply chains and can shift materially with currency timing and commodity price spikes. |
The spread is mainly explained by the unit and boundary choice, since a volume based market definition will not line up with an import value snapshot in a high price year. In our approach, supply, usage, and trade checks are kept consistent year to year, which makes the outcome easier to reproduce and stress test when assumptions change.
Key Questions Answered in the Report
What is the current size and projected CAGR of the China Copper market?
The market stands at 13.56 Million tons in 2026 and is forecast to reach 17.54 Million tons by 2031, reflecting a 5.28% CAGR.
Which end-user segment holds the largest share of China’s copper demand?
Electrical and electronics leads with 37.85% of national consumption in 2025.
Which copper source segment is growing the fastest?
Secondary (recycled) copper is projected to expand at a 6.35% CAGR between 2026 and 2031.
How does China’s renewable-energy build-out affect copper usage?
Each kilometer of UHV transmission line embeds 6 tons of copper, and grid projects tied to the 1,200 GW wind-plus-solar target underpin long-term demand.
What supply-side constraints could limit copper availability in China?
Tight sulphur-dioxide and carbon-emission caps on smelters and a global concentrate deficit that has pushed treatment charges to single-digit USD levels both weigh on domestic output.