Precious Metals Market Size and Share
Market Overview
| Study Period | 2019 - 2030 |
|---|---|
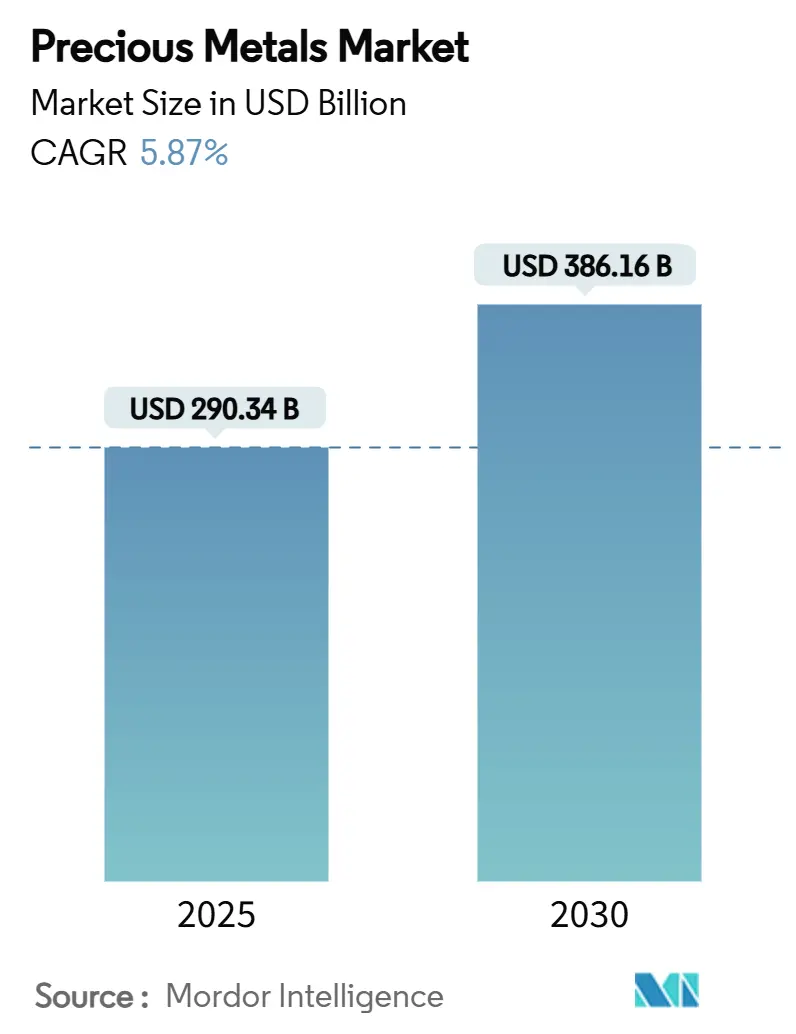
| Market Size (2025) | USD 290.34 Billion |
| Market Size (2030) | USD 386.16 Billion |
| Growth Rate (2025 - 2030) | 5.87% CAGR |
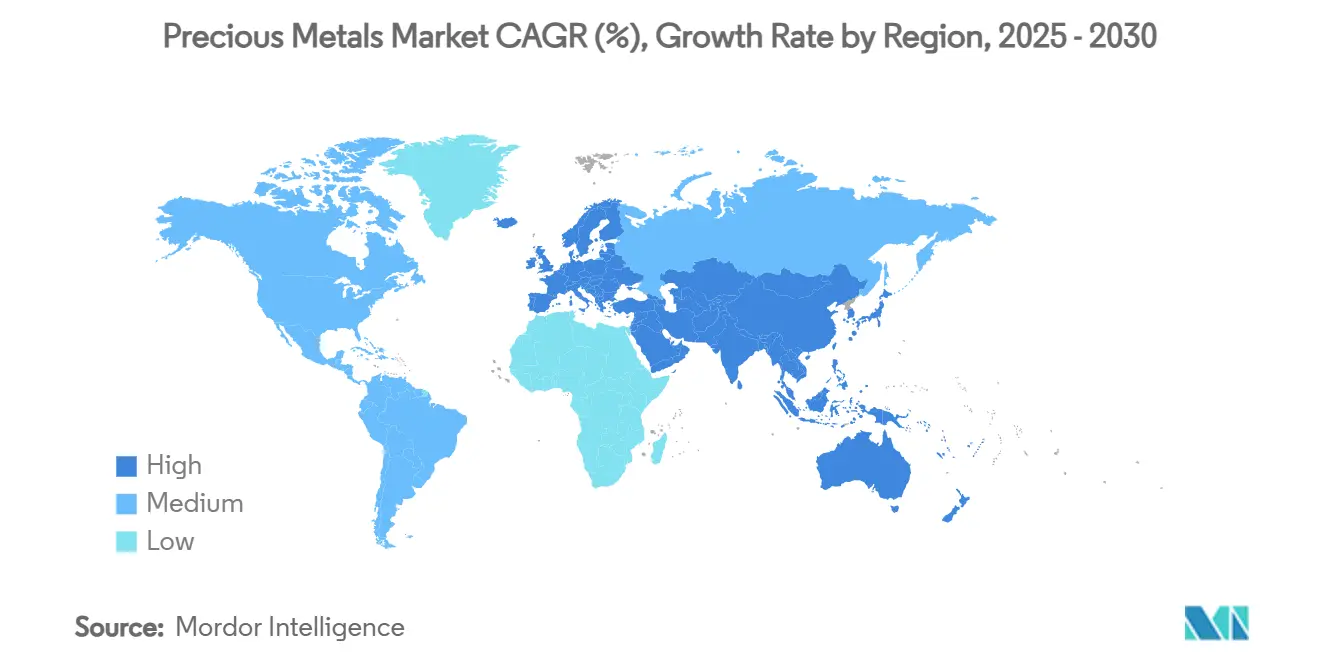
| Fastest Growing Market | Asia Pacific |
| Largest Market | Asia Pacific |
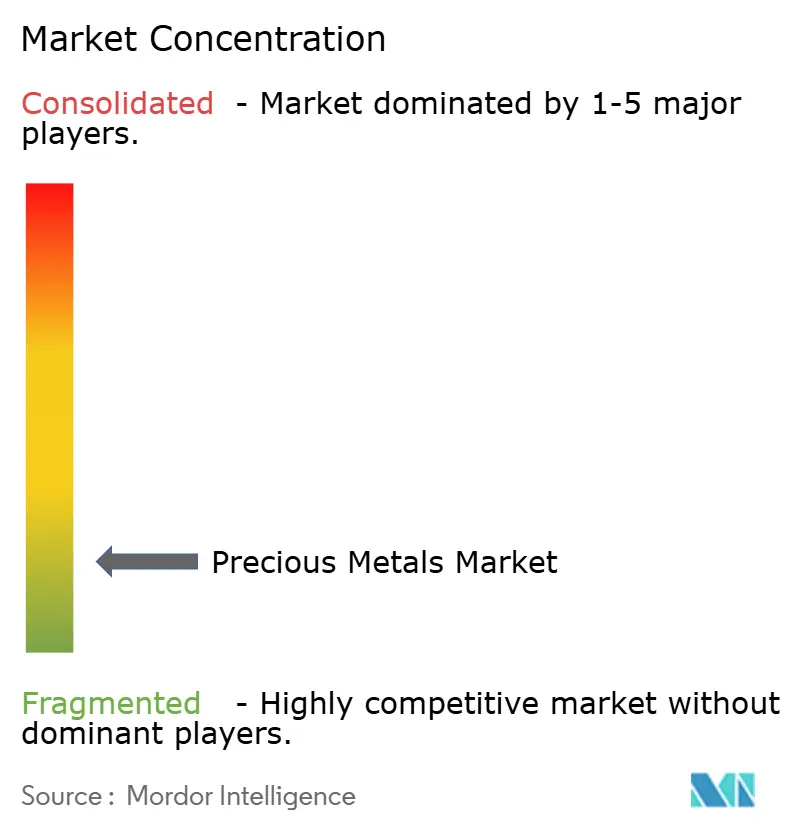
| Market Concentration | Low |
Major Players *Disclaimer: Major Players sorted in no particular order Image © Mordor Intelligence. Reuse requires attribution under CC BY 4.0. | |
Precious Metals Market Analysis by Mordor Intelligence
The Precious Metals Market size is estimated at USD 290.34 billion in 2025, and is expected to reach USD 386.16 billion by 2030, at a CAGR of 5.87% during the forecast period (2025-2030). The precious metals market size stands at USD 290.34 billion in 2025 and is projected to rise to USD 386.16 billion by 2030, reflecting a firm 5.87% CAGR. Renewed safe-haven buying, accelerating industrial usage in renewable energy and electronics, and steady central-bank accumulation form the backbone of growth. Central banks purchased 244 tonnes of gold in the first quarter of 2025, reinforcing the strategic role of bullion in reserve management. Diversification away from US-dollar assets, together with looser custody rules for exchange-traded funds, is drawing fresh institutional flows into the precious metals market. Parallel demand for silver, platinum, and palladium in electric vehicles, photovoltaics, and advanced catalysts is widening the sector’s revenue base. Producers, refiners, and recyclers alike are investing in automation and sustainable extraction to secure feedstock and reduce cost volatility, while investors are treating bullion as a long-term portfolio core rather than a tactical trade.
Key Report Takeaways
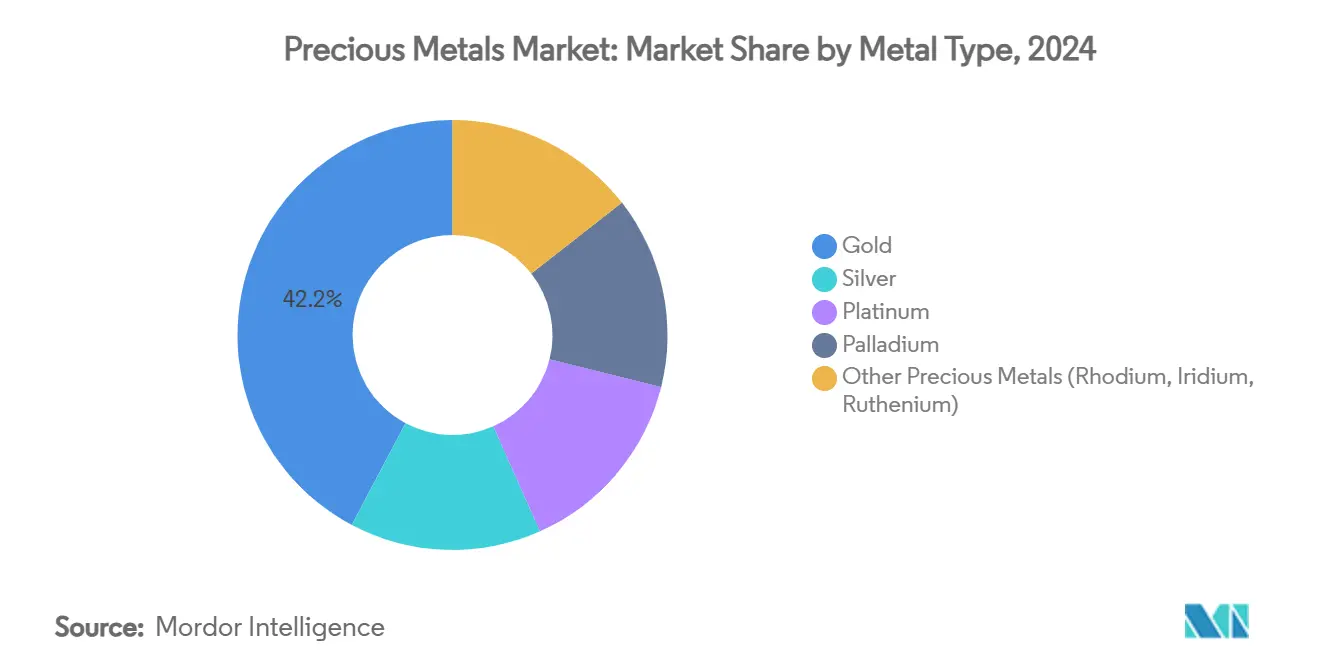
- By metal type, gold captured 42.23% precious metals market share in 2024; palladium shows the strongest 7.12% CAGR outlook through 2030.
- By application, jewellery contributed 46.67% of 2024 revenue, whereas industrial uses expand at a 6.46% CAGR to 2030.
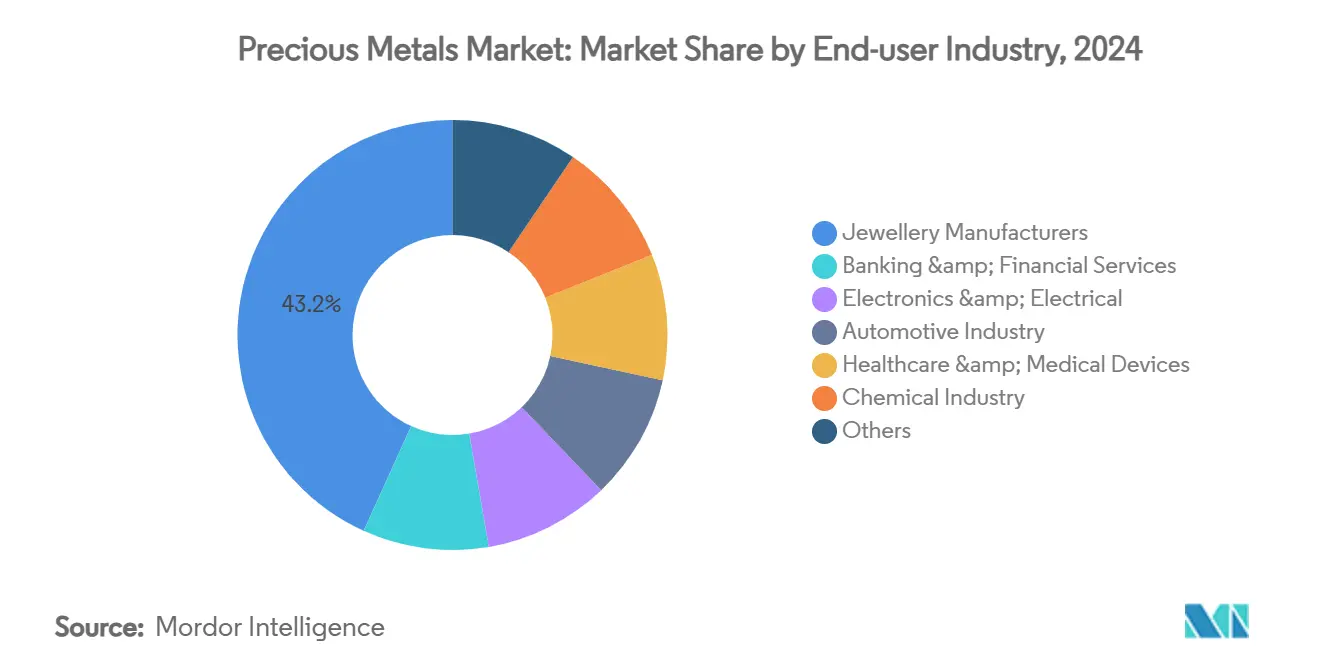
- By end-user industry, the automotive segment in the precious metals market is advancing at 6.67% CAGR as rising silver content outweighs shrinking catalyst demand.
- By geography, Asia-Pacific accounted for 46.23% precious metals market share in 2024 and is pacing growth at a 6.40% CAGR to 2030.
Global Precious Metals Market Trends and Insights
Drivers Impact Analysis*
| Driver | % Impact on CAGR Forecast | Geographic Relevance | Impact Timeline |
|---|---|---|---|
| Surging investment-grade bullion demand post-2024 ETF rule-changes | +1.2% | Global, with concentration in North America & EU | Medium term (2-4 years) |
| Jewellery restocking after pandemic-led inventory rundown | +0.8% | APAC core, spill-over to MEA | Short term (≤ 2 years) |
| Electrification-driven growth of silver and palladium in automotive electronics | +1.5% | Global, with early gains in China, EU, North America | Long term (≥ 4 years) |
| Flight-to-safety amid escalating geopolitical flashpoints | +0.9% | Global | Short term (≤ 2 years) |
| Central-bank diversification away from US-dollar reserves | +1.1% | Global, with emphasis on emerging markets | Long term (≥ 4 years) |
| Source: Mordor Intelligence | |||
Surging Investment-Grade Bullion Demand Post-2024 ETF Rule Changes
Regulation that took effect in 2024 simplified custody disclosure and reporting for physically backed exchange-traded products, sharply lowering barriers for both institutions and retail investors. The result was a surge in bullion inflows that lifted net central-bank gold buying to 244 tonnes in the first quarter of 2025. Monetary-policy uncertainty and inflation fears further enhance bullion’s appeal as a hedge, embedding a larger structural allocation to precious metals market inside multi-asset portfolios. The broadening investor base increases market depth, yet it also raises the importance of transparency on metal provenance and vault auditing. Long-only positioning favours price stability, encouraging miners and refiners to lock in long-term offtake agreements. With ETFs now viewed as core, rather than tactical, holdings, bullion demand is expected to remain elevated through the medium term.
Jewellery Restocking After Pandemic-Led Inventory Rundown
Pandemic-era disruptions drained retail and wholesale inventories, triggering a restocking cycle as mobility recovered. India’s gold jewellery demand grew 5% to 802.8 tonnes in 2024, surpassing China for the first time in several years. The precious metals market is witnessing manufacturers rebuilding their safety stocks while shifting designs toward recycled content and ethically sourced metals to meet consumer expectations. Although lab-grown diamonds are part of discretionary budgets, cultural affinity in Asia-Pacific and the Middle East continues to underpin precious-metal jewellery sales. Elevated bullion prices squeeze producer margins, yet they also incentivise recycling, creating a secondary supply that curbs price spikes. For retailers, omnichannel distribution strategies and lighter inventory cycles help manage volatility during the restocking phase.
Electrification-Driven Growth of Silver and Palladium in Automotive Electronics
Electric vehicles require 25–50 grams of silver per unit, noticeably above the 15–25 grams used in internal-combustion cars [1]Source: Metal Tech News Staff, “Silver Loads Rise in Electric Vehicles,” metaltechnews.com. Higher power-management complexity in EVs also supports demand for palladium and platinum group metals in connectors and sensors, even as catalyst demand declines. Automotive OEMs are therefore reshaping their procurement mix, purchasing more silver while simultaneously developing substitution strategies for palladium in after-treatment systems. Miners face diverging prospects: palladium producers are scouting new applications in hydrogen fuel cells, whereas silver refiners enjoy immediate volume growth. Regionally, China, the EU, and North America host the largest EV assembly hubs, creating geographically fragmented but robust industrial offtake for multiple metals through 2030.
Flight-to-Safety Amid Escalating Geopolitical Flashpoints
Heightened geopolitical risk, including currency sanctions and resource nationalism, channels capital toward liquid safe-haven assets. Gold prices touched successive highs during 2024–2025 as investors sought insulation from exchange-rate volatility and supply-chain fragmentation. Emerging-market central banks intensified their gold accumulation to guard against potential dollar weaponisation, reinforcing bullion’s role as a politically neutral reserve asset. Portfolio reallocations have broadened to include silver and platinum for diversification across the precious metals market, an approach facilitated by liquid futures and options on major exchanges. Sustained safe-haven demand hinges on the persistence of geopolitical tensions; however, even a partial easing is expected to leave a higher baseline allocation to bullion than pre-2022 norms.
Restraints Impact Analysis*
| Restraint | % Impact on CAGR Forecast | Geographic Relevance | Impact Timeline |
|---|---|---|---|
| High price volatility amplified by algorithmic trading | -0.7% | Global, with concentration in major trading centers | Short term (≤ 2 years) |
| Lab-grown diamond jewellery diluting discretionary gold spend | -0.4% | North America & EU, expanding to APAC | Medium term (2-4 years) |
| Substitution of PGMs by nano-ceramic catalysts in ICE vehicles | -0.6% | Global, with early adoption in EU and Japan | Long term (≥ 4 years) |
| Source: Mordor Intelligence | |||
High Price Volatility Amplified by Algorithmic Trading
High-frequency algorithms now dominate order flow on bullion exchanges, accelerating intraday swings that distort long-term price signals in the precious metals market. Flash moves complicate hedging for miners and feedstock planning for industrial users. Elevated margin requirements deter smaller market participants, while wider intraday ranges raise the cost of rolling forward hedges. Regulatory coordination remains patchy, allowing traders to exploit arbitrage between venues. Producers respond by diversifying revenue streams across metals and lengthening contract tenors to stabilise cash flows during volatile episodes. Over time, greater transparency and circuit breakers may moderate algorithm-driven swings, yet short-term volatility will likely persist.
Lab-Grown Diamond Jewellery Diluting Discretionary Gold Spend
Synthetic diamonds retail at 60–80% below the price of natural stones, freeing consumer budgets for travel and technology instead of precious-metal jewellery. Penetration is swift in engagement rings across North America and Europe, where sustainability messaging resonates with younger buyers. Gold jewellers counter with traceability platforms and lower-karat designs to manage affordability. In Asia-Pacific, cultural emphasis on gold’s intrinsic value limits substitution, yet the trend is expected to expand as synthetic production costs keep falling. Producers of gold alloys and design houses are innovating with mixed-metal collections to differentiate products and preserve share of wallet.
*Our forecasts treat driver/restraint impacts as directional, not additive. The impact forecasts reflect baseline growth, mix effects, and variable interactions.
Segment Analysis
By Metal Type: Gold Continues to Anchor While Palladium Surges
Gold held 42.23% revenue in 2024, the largest slice of the precious metals market, reflecting its entrenched role in reserves and jewellery. Palladium, while smaller, posts the fastest 7.12% CAGR through 2030 as hybrid-vehicle demand and emerging hydrogen applications gather pace. Silver volumes rose to 232 million ounces in 2024, underpinned by record photovoltaic installations. Platinum confronts shrinking catalyst demand yet gains niche strength in fuel cells and medical devices. Minor metals such as rhodium, iridium, and ruthenium service specialised chemical and electronics needs with relatively inelastic volumes.
Technological advances reshape supply dynamics. Protein-based extraction recovers up to 90% of gold from e-waste, adding meaningful secondary flows. Palladium recyclers refine spent auto-catalysts at higher yields through microwave-assisted leaching, lowering dependence on primary mines. Silver-bearing paste formulations for photovoltaic busbars reduce per-watt metal intensity but are outweighed by rapid solar capacity growth. The interplay of primary mining, recycling innovation, and demand diversification sustains a balanced outlook for each metal slice of the precious metals market.


By Application: Industrial Growth Challenges, Jewellery Dominance
Jewellery retained 46.67% of overall revenue in 2024, yet industrial users are growing at a 6.46% CAGR, signalling a tilt toward technology-linked consumption within the precious metals market. Printed circuit boards, 5G antennas, and advanced sensors draw continuous silver inflows, while chemical catalysts rely on platinum, palladium, and rhodium for selectivity. Investment bars, coins, and ETFs give liquidity and store-of-value characteristics that buttress market stability. Photovoltaic cell production alone absorbed record silver tonnage in 2024, with expansion tracks intact as national decarbonisation targets raise solar deployment.
Industrial consumption strengthens bargaining power of electronics and solar manufacturers, pushing refiners to adopt just-in-time deliveries at tighter purity tolerances. Jewellery designers experiment with lighter settings, alloy blends, and recycled scrap to contain rising input costs. Luxury brands also market provenance to offset competition from lower-karat and synthetic stone alternatives. The evolving mix of adornment, wealth storage, and industrial application offers diversified revenue hedges across end-use buckets inside the precious metals market.
By End-User Industry: Automotive Leads Growth Despite Electrification
Automotive demand expands at 6.67% CAGR as rising silver, copper, and sensor content in electric drivetrains more than balances falling catalyst metals per vehicle across the precious metals market. Jewellery manufacturers command 43.23% of 2024 revenue, anchored by cultural traditions and restocking. Banking and financial services administer vaulting, ETF creation, and metal accounts that foster investment liquidity. Electronics producers integrate conductive silver and gold bonding wire into ever-denser chips, locking in steady annual offtake. Healthcare applications grow as platinum and gold coatings enhance biocompatibility for implants and diagnostic gear.
Chemical makers adopt palladium-gallium liquid catalysts that accelerate laboratory reactions up to 100,000 times the rate of conventional solids, broadening process efficiency. Such breakthroughs can cut metal intensity per product, yet they expand total volumes via cost-driven capacity additions. For automakers, near-term hybrid sales sustain palladium demand even as battery-electric adoption climbs. Fuel-cell truck pilots in California and Europe are opening a niche for platinum that scales later in the decade, cushioning transition headwinds within the precious metals market.
Geography Analysis
Asia-Pacific’s 46.23% share in 2024 underscores its status as the precious metals epicenter, and its 6.40% CAGR outlook points to persistent leadership. India consumed 802.8 tonnes of gold jewellery in 2024, overtaking China for the first time in years . Chinese demand shifted toward investment-grade bullion, aided by relaxed import quotas and central-bank accumulation. Japan’s electronics sector absorbs high-purity gold and silver for semiconductors, while South Korea’s foundries rely on silver in advanced packaging. Regional manufacturers anchor robust industrial pull that balances ornamental appetite, shaping a diversified demand base for the precious metals market.
North America retains strong positioning in the precious metals industry through ETF administration, futures trading, and advanced industrial use. The United States spearheads physically backed product launches, reinforcing domestic bullion liquidity. Canada leverages stable regulation and hydroelectric power to attract mine development, while Mexico supplies silver concentrate to regional smelters. Sustainable-sourcing frameworks emerge as competitive differentiators, especially for automakers sourcing low-carbon palladium. European demand focuses on responsible sourcing and circularity. Germany’s auto sector still requires platinum group metals for premium diesel and hybrid models, whereas France and Italy underpin luxury jewellery craft. The United Kingdom hosts a vibrant bullion-dealing ecosystem serving global investors.
The Middle East and Africa blend supply and consumption dynamics. South Africa remains pivotal for platinum and gold, though operational disruptions from power shortages constrain output. Saudi Arabia’s Vision 2030 investments aim to process local ore, adding regional refining capacity. The United Arab Emirates cements its role as a transit and trading hub through free-zone incentives and industry-specific finance. African miners increase on-site smelting to capture more value, backed by infrastructure partnerships. Political stability and ESG adherence determine project viability, yet successful developments, such as Tanzania’s new gold refineries, illustrate pathways to inclusive growth. Supply diversification reduces concentration risk for Asia-focused refiners and supports balanced sourcing for the global precious metals market.

Competitive Landscape
Moderate concentration characterises the sector, with top miners in the precious metals market exploiting scale and ore-body quality to defend margins. Barrick Gold and Newmont operate tier-one assets in the Americas and Africa, combining autonomous haulage with predictive maintenance to lower unit costs. Mid-tier consolidators pursue bolt-on assets to enhance reserve life; Royal Gold agreed to purchase streaming peer Sandstorm and exploration firm Horizon for USD 3.7 billion, extending royalty coverage into copper-gold deposits. Coeur Mining completed a USD 1.7 billion deal for SilverCrest in late 2024, expanding high-grade Mexican silver production.
Downstream, Heraeus acquired Umicore’s platinum business to secure catalyst and medical-device supply lines. Johnson Matthey invests in closed-loop recycling, collecting scrap from chemical customers to recover rhodium and palladium with minimal virgin inputs. Technology start-up Orexplore commercialises X-ray scanning to pinpoint gold within core samples, shortening exploration timelines[2]. Recycling specialists scale hydrometallurgical plants that treat e-waste at lower temperatures than smelters, reducing carbon footprints.
ESG compliance and community relations are decisive. Firms adopting renewable energy for operations gain preferential finance rates and qualify for low-carbon product premiums from automakers and tech brands. Transparent supply chains appeal to luxury retailers and central banks requiring conflict-free certification. Competitive intensity therefore hinges on access to high-quality geology, integrated refining, and credible sustainability credentials inside the precious metals market.
Precious Metals Industry Leaders
Newmont Corporation
Barrick Mining Corporation
Anglo American Platinum Ltd
Sibanye Stillwater Limited
PJSC Polyus
- *Disclaimer: Major Players sorted in no particular order

Recent Industry Developments
- May 2025: Kinross Gold Corporation invested USD 3 million in Eminent Gold Corp., acquiring 7,574,237 units. The move aims to strengthen its exposure to exploration upside.
- November 2024: Coeur Mining finalized a USD 1.7 billion acquisition of SilverCrest. The deal boosts its silver production capacity across North America.


Global Precious Metals Market Report Scope
| Gold |
| Silver |
| Platinum |
| Palladium |
| Other Precious Metals (Rhodium, Iridium, Ruthenium) |
| Investment (Bars, Coins, ETFs) | |
| Jewellery | |
| Industrial Applications | Electronics |
| Automotive Catalysts | |
| Chemical Catalysts | |
| Photovoltaics | |
| Other Applications (Dentistry, Art, Glass) |
| Banking and Financial Services |
| Jewellery Manufacturers |
| Electronics and Electrical |
| Automotive Industry |
| Healthcare and Medical Devices |
| Chemical Industry |
| Others |
| North America | United States |
| Canada | |
| Mexico | |
| South America | Brazil |
| Argentina | |
| Rest of South America | |
| Europe | Germany |
| United Kingdom | |
| France | |
| Italy | |
| Rest of Europe | |
| Asia-Pacific | China |
| India | |
| Japan | |
| Australia | |
| South Korea | |
| Rest of Asia-Pacific | |
| Middle-East and Africa | Saudi Arabia |
| South Africa | |
| Rest of Middle-East and Africa |
| By Metal Type | Gold | |
| Silver | ||
| Platinum | ||
| Palladium | ||
| Other Precious Metals (Rhodium, Iridium, Ruthenium) | ||
| By Application | Investment (Bars, Coins, ETFs) | |
| Jewellery | ||
| Industrial Applications | Electronics | |
| Automotive Catalysts | ||
| Chemical Catalysts | ||
| Photovoltaics | ||
| Other Applications (Dentistry, Art, Glass) | ||
| By End-user Industry | Banking and Financial Services | |
| Jewellery Manufacturers | ||
| Electronics and Electrical | ||
| Automotive Industry | ||
| Healthcare and Medical Devices | ||
| Chemical Industry | ||
| Others | ||
| By Geography | North America | United States |
| Canada | ||
| Mexico | ||
| South America | Brazil | |
| Argentina | ||
| Rest of South America | ||
| Europe | Germany | |
| United Kingdom | ||
| France | ||
| Italy | ||
| Rest of Europe | ||
| Asia-Pacific | China | |
| India | ||
| Japan | ||
| Australia | ||
| South Korea | ||
| Rest of Asia-Pacific | ||
| Middle-East and Africa | Saudi Arabia | |
| South Africa | ||
| Rest of Middle-East and Africa | ||


Key Questions Answered in the Report
What is the current size of the precious metals market?
The precious metals market size is USD 290.34 billion in 2025 and is forecast to rise to USD 386.16 billion by 2030 at a 5.87% CAGR.
Which metal holds the largest share of revenue in precious metals industry?
Gold remains dominant, accounting for 42.23% of 2024 revenue.
Why is industrial demand growing faster than jewellery demand?
Expanding solar installations, electric vehicles, and electronics production pull more silver, platinum, and palladium into industrial circuits, lifting that segment at a 6.46% CAGR.
How does electrification affect palladium and platinum demand?
Hybrid vehicles sustain palladium use near term, yet battery-electric adoption and nano-ceramic catalysts shrink traditional auto-catalyst volumes, while hydrogen fuel cells open new niches for platinum post-2027.
Page last updated on:


