Recycled Concrete Aggregates Market Size and Share
Market Overview
| Study Period | 2019 - 2030 |
|---|---|
| Market Volume (2025) | 11.78 Million tons |
| Market Volume (2030) | 15.93 Million tons |
| Growth Rate (2025 - 2030) | 6.22% CAGR |
| Fastest Growing Market | Asia Pacific |
| Largest Market | Asia Pacific |
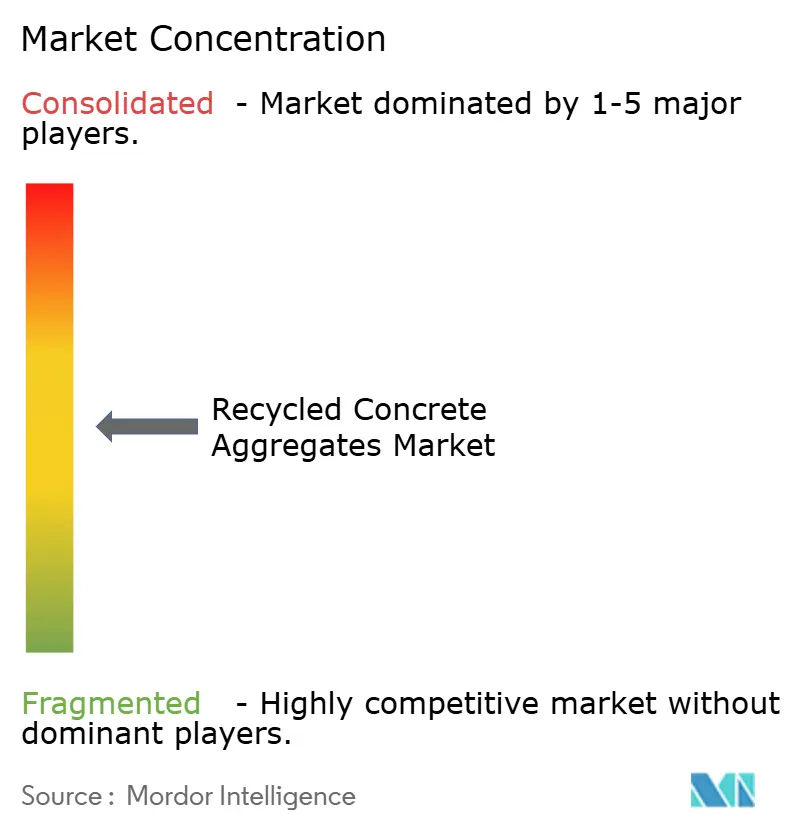
| Market Concentration | Medium |
Major Players *Disclaimer: Major Players sorted in no particular order Image © Mordor Intelligence. Reuse requires attribution under CC BY 4.0. | |

Recycled Concrete Aggregates Market Analysis by Mordor Intelligence
The Recycled Concrete Aggregates Market size is estimated at 11.78 Million tons in 2025, and is expected to reach 15.93 Million tons by 2030, at a CAGR of 6.22% during the forecast period (2025-2030). Demand growth mirrors the ongoing transition from linear to circular resource use, with governments tightening waste-diversion rules and builders responding to cost savings and carbon targets. Regulatory clarity now aligns with economic incentives, accelerating recycled-aggregate uptake across public infrastructure and private real-estate projects. Technology upgrades—particularly mobile crushers and advanced separation systems—are lifting product quality while lowering unit costs, easing long-standing performance concerns. Competitive intensity is rising as cement majors expand into recycling, often via acquisitions, to secure feedstock, lower Scope 3 emissions, and embed circularity into procurement contracts.
Key Report Takeaways
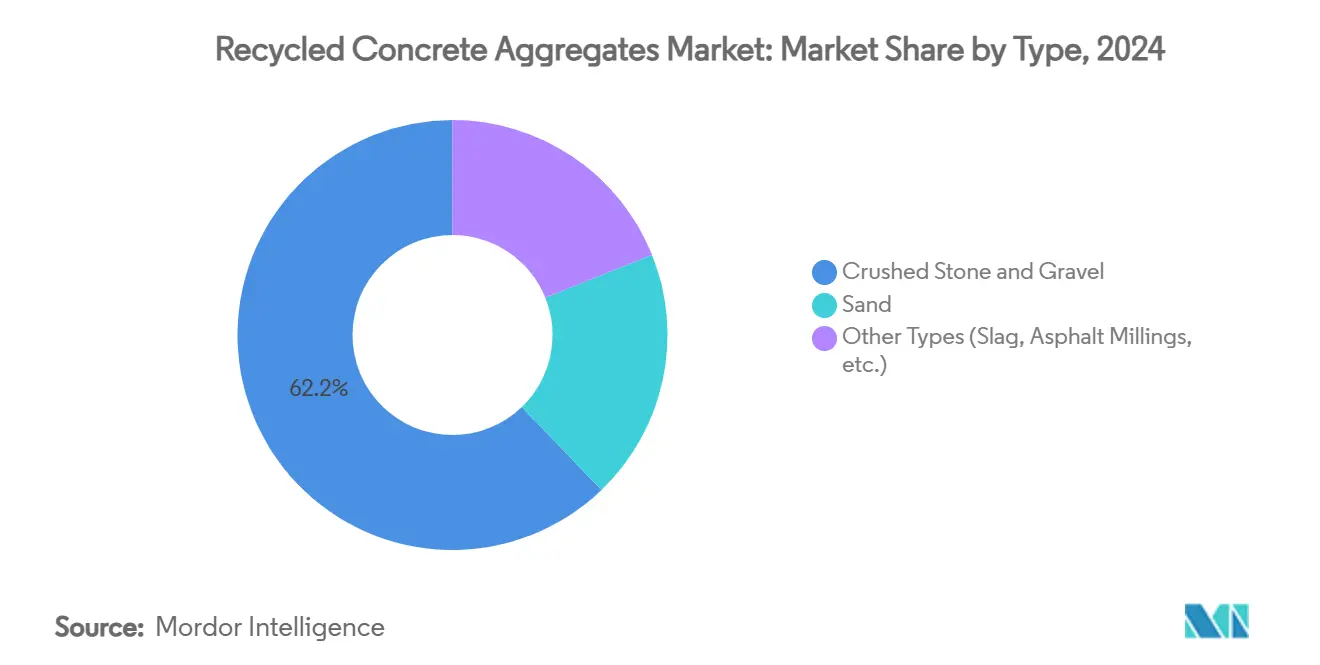
- By type, crushed stone and gravel held 62.18% of recycled concrete aggregates market share in 2024, while sand-based products are projected to grow at 6.91% CAGR to 2030.
- By application, road base and pavement commanded 41.65% of the recycled concrete aggregates market size in 2024 and are advancing at 7.18% CAGR through 2030.
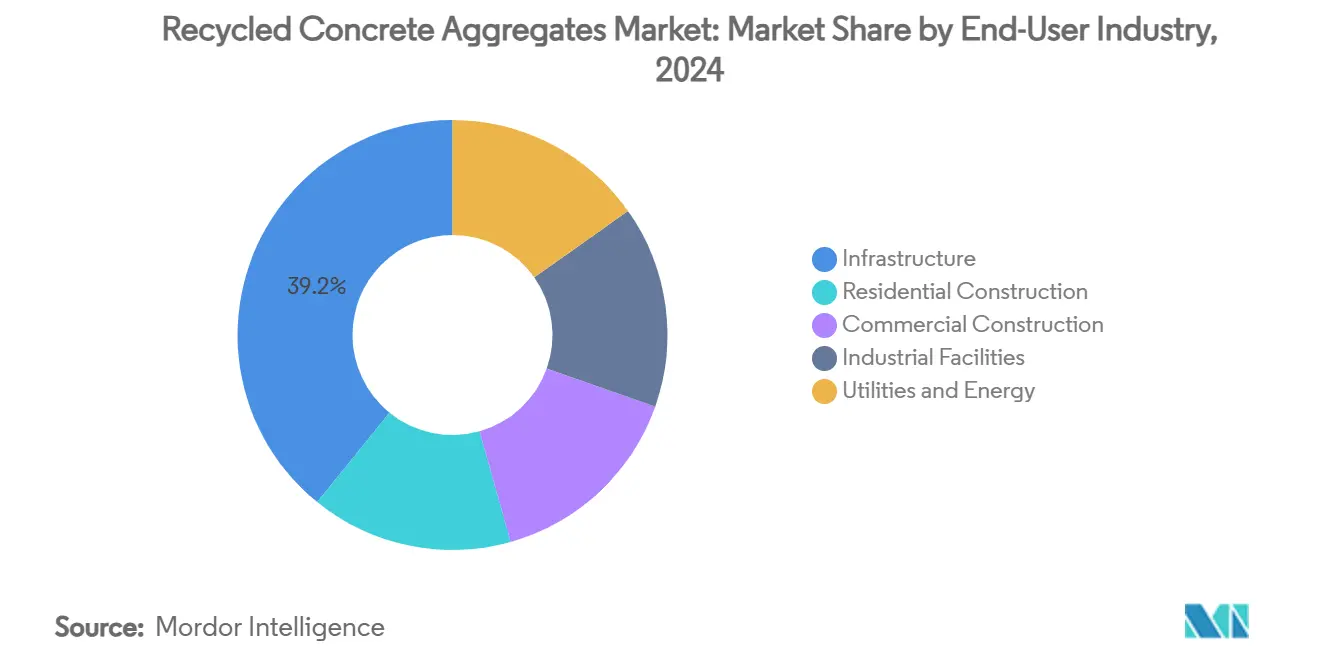
- By end-user industry, infrastructure accounted for 39.16% of demand in 2024, whereas residential construction is expanding the fastest at 7.06% CAGR to 2030.
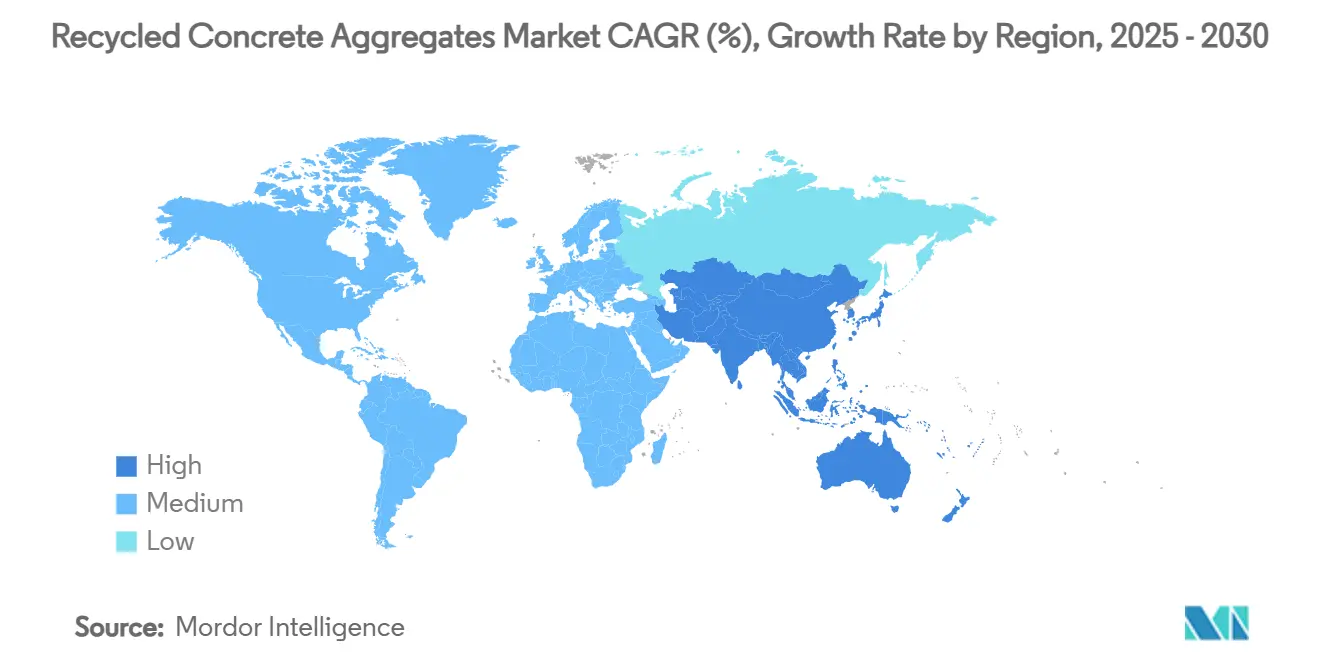
- By geography, Asia-Pacific led with 40.25% share in 2024; the same region is also forecast to post the highest 6.88% CAGR to 2030.
Global Recycled Concrete Aggregates Market Trends and Insights
Driver Impact Analysis*
| Driver | (~) % Impact on CAGR Forecast | Geographic Relevance | Impact Timeline |
|---|---|---|---|
| Rising focus on sustainability and circular economy | +1.8% | Global (EU and North America strongest) | Medium term (2-4 years) |
| Increasing government regulations on C&D waste | +1.5% | EU, North America, China, wider APAC | Short term (≤ 2 years) |
| Growing construction and demolition volumes | +1.2% | Global, led by Asia-Pacific and Middle East | Long term (≥ 4 years) |
| Cost-effectiveness versus virgin aggregates | +0.9% | Global, pronounced where haul costs are high | Medium term (2-4 years) |
| Carbon-credit monetisation for low-carbon concrete | +0.6% | EU, North America, early uptake in APAC | Long term (≥ 4 years) |
| Source: Mordor Intelligence | |||
Rising focus on sustainability and circular economy
Circular-economy mandates are redefining material sourcing in construction. The forthcoming EU Circular Economy Act will introduce binding recycling quotas and smooth cross-border recycled-aggregate trade. Corporate pledges reinforce regulation: Holcim UK aims to triple demolition-material use to 5 million tons by 2030. Life-cycle studies show recycled aggregates can cut embodied CO₂ by up to 20% relative to natural stone. Project financiers now embed ESG filters, making verified circular credentials a prerequisite for capital allocation.
Increasing government regulations on construction and demolition waste
Worldwide, rule-makers are locking in higher reuse thresholds. The EU Waste Framework Directive already requires 70% recovery rates, and member states such as the Netherlands exceed 90%[1]European Environment Agency, “Construction Waste Statistics 2024,” eea.europa.eu . Denver’s “Waste No More” ordinance obliges reuse plans on all new builds, while Texas DOT recycles 1 million tons of concrete pavement each year[2]Federal Highway Administration, “Recycled Materials Policy 2023,” fhwa.dot.gov . China targets a 60% recycling ratio by 2025, equating to at least 60 million tons of annual demand for recycled concrete aggregates market participants.
Growing construction and demolition volumes globally
Annual global C&D waste is estimated at 2–3 billion tons, with concrete comprising up to 40%. Asia-Pacific generates the bulk: China alone discards 100–200 million tons of concrete yearly, while ASEAN megacities add sizable volumes. Simultaneously, mature economies face a replacement wave as 1960s-era bridges and tunnels reach end-of-life, guaranteeing long-term feedstock availability.
Cost-effectiveness versus virgin aggregates
Field trials in South Africa demonstrate 40% cost savings and 97% higher environmental benefits when recycled aggregates substitute quarried stone. Savings widen with haul distance because demolition sites are typically urban, whereas quarries lie ever farther from city centers. Mobile crushers enable on-site valorization, eliminating tipping fees and reducing heavy-haul traffic. Productivity gains from optical sorters and automated crushers continue to narrow historical quality gaps.
Restraint Impact Analysis*
| Restraint | (~) % Impact on CAGR Forecast | Geographic Relevance | Impact Timeline |
|---|---|---|---|
| Quality and structural-performance concerns | -1.1% | Global, acute where codes are stringent | Medium term (2-4 years) |
| Inconsistent supply and reverse-logistics hurdles | -0.8% | Global, especially in developing markets | Short term (≤ 2 years) |
| Heavy-metal/contaminant compliance uncertainty | -0.5% | North America, EU | Long term (≥ 4 years) |
| Source: Mordor Intelligence | |||
Quality and structural-performance concerns
Recycled aggregates can register 10–20% lower compressive strength than natural stone, with challenges rising above 30% replacement ratios. Variations in adhered mortar lead to higher water absorption, pushing up cement dosage and costs. Diverse national codes—from Australia to Brazil—apply different limits, hindering cross-border trade. Thermal, mechanical, and chemical upgrades raise quality but add expense. Liability fears persist among engineers overseeing high-load bridges and tunnels.
Inconsistent supply and reverse-logistics hurdles
C&D waste arises in dispersed pockets, yet crushers are often centralized. When the haul distance for debris exceeds that for virgin stone, economic advantage erodes. Seasonality compounds volatility—winter demolition peaks can swamp processing yards, while summer lulls trigger shortages. Reverse-logistics networks remain fragmented, and material passports are still rare, complicating inventory forecasting for contractors.
*Our forecasts treat driver/restraint impacts as directional, not additive. The impact forecasts reflect baseline growth, mix effects, and variable interactions.
Segment Analysis
By Type: Crushed Stone and Gravel Dominate Processing Infrastructure
Crushed stone and gravel claimed 62.18% of recycled concrete aggregates market share in 2024, and this segment is projected to post a 6.91% CAGR to 2030. The recycled concrete aggregates market size expansion is underpinned by coarse aggregate’s 60–75% weight in typical demolition debris, ensuring ample supply for downstream crushing. Vertical-shaft impact (VSI) crushers and mobile units deliver improved shape, surface texture, and gradation, clearing prior performance barriers.
Sand aggregates remain niche but are moving mainstream as high-frequency screens and air classifiers strip contaminants and refine fines. Sika’s chemical recovery technology extracts both sand and cementitious paste, enabling full-depth recycling of concrete components. Specialized outputs—slag-blended aggregates or asphalt millings—service niche markets where specific thermal or skid-resistance properties justify extra processing costs.


By Application: Road Infrastructure Drives Market Expansion
Road base and pavement made up 41.65% of the recycled concrete aggregates market size in 2024 and lead the growth trajectory at 7.18% CAGR through 2030. Transportation departments validate strength, freeze-thaw resistance, and long-term durability, thereby derisking adoption for private contractors.
Foundations in low-rise housing and light-industrial pads form the second-largest bucket, absorbing material that falls just shy of stringent highway specs. Landscaping, drainage, and trench backfill offer outlets for lower-grade fractions, ensuring a home for nearly the entire crush output. Structural concrete adoption is slowly widening as standards evolve and third-party labs verify performance on mix designs pushing recycled content past 50%.
By End-User Industry: Infrastructure Leads While Residential Accelerates
Infrastructure consumed 39.16% of global demand in 2024 thanks to large highway, rail, and utility projects whose public sponsors often mandate recycled content. Government procurement policies de-risk volume offtake, making long-tenor supply contracts possible and anchoring bankable recycling-plant cash flows.
Residential construction is the fastest riser at 7.06% CAGR through 2030, driven by national green-building codes and consumer preference for low-carbon homes. Builders exploit recycled aggregates in driveways, foundations, and non-load-bearing walls where structural demands are moderate. Commercial high-rise projects advance more cautiously because of higher design loads and warranty obligations, yet pilot jobs in Europe demonstrate compressive-strength parity at 30% recycled content.
Geography Analysis
Asia-Pacific held 40.25% of global demand in 2024 and is on track for a 6.88% CAGR through 2030, reflecting vast urban build-outs and state-driven recycling quotas. China’s target of 60% C&D recycling by 2025 translates into double-digit volume gains for local crushers. India’s plants operate at 30.5% lower energy draw than natural-aggregate producers, reinforcing the cost edge. Singapore validates 10–20% recycled content in structural mixes, illustrated by the Samwoh Eco-Green Building’s full-scale application.
North America ranks second and benefits from mature state mandates and the FHWA’s recycled-materials policy that covers the National Highway System. Texas DOT alone processes 1 million tons yearly, removing 46,000 metric tons of CO₂ from the atmosphere per million tons reused. Denver’s city ordinance and Illinois DOT mix-design specs further cement baseline demand.
Europe’s trajectory is deeply shaped by the EU 70% recycling rule and the Pending Circular Economy Act slated for 2026. The Netherlands already recovers 99% of C&D waste, while other member states lag due to patchy processing capacity. Corporate moves—such as Holcim UK’s plan to triple demolition-material intake—signal industry alignment with policy.
Middle East and Africa remain nascent. Resource scarcity in Gulf states and landfill-levy hikes in South Africa are catalyzing pilot crushing plants, positioning the territories for future recycled concrete aggregates market participation once collection networks mature.

Competitive Landscape
The recycled concrete aggregates market is moderately fragmented but trending toward consolidation as incumbent cement firms buy specialist recyclers to lock in feedstock and decarbonize portfolios. Heidelberg Materials spent USD 380 million in 2024 on Highway Materials and Aaron Materials to add regional crushing yards across the United States. Cemex acquired RC-Baustoffe Berlin, a 400,000 ton-per-year outfit, expanding its European recycling footprint. Vulcan Materials opts for joint ventures with demolition contractors, trading minority equity stakes for long-term supply agreements.
Technology differentiation is emerging as a critical battleground. Sika’s reCO₂ver method disassembles concrete into sand, coarse aggregate, and cementitious fines while capturing carbon in mineral form. Metso’s Lokotrack mobile crushers offer onboard screening and IoT sensors, letting contractors process debris on site and verify spec compliance in real time.
Regional independents defend share through proximity advantages, rapid turnaround, and bespoke blends aligned to local codes. Nonetheless, rising capex requirements for advanced crushers and stricter quality audits tilt the field toward deep-pocketed players, suggesting market concentration will tighten steadily through the decade.
Recycled Concrete Aggregates Industry Leaders
Cemex S.A.B DE C.V.
CRH (Tarmac)
Heidelberg Materials
HOLCIM
Vulcan Materials Company
- *Disclaimer: Major Players sorted in no particular order

Recent Industry Developments
- June 2024: A recent study published in the Journal of Engineering and Applied Science examined the utilization of recycled aggregates derived from construction waste for the production of new concrete. The research focused on the application of coarse recycled aggregates as substitutes for natural aggregates in concrete mixes, with replacement rates ranging from 0% to 100%.
- June 2024: Heidelberg Materials North America has expanded its portfolio by introducing RevolveTM recycled concrete aggregates. Furthermore, the company is appointing specialists to work directly with transportation departments and other agencies to strengthen collective expertise and engineering capabilities. This initiative aligns with recent legislation enacted by the state of Washington, which encourages the use of recycled concrete aggregate (RCA) in state roadways.


Global Recycled Concrete Aggregates Market Report Scope
| Crushed Stone and Gravel |
| Sand |
| Other Types (Slag, Asphalt Millings, etc.) |
| Road Base and Pavement |
| Building Foundations |
| Landscaping |
| Structural Concrete |
| Drainage and Fill |
| Residential Construction |
| Commercial Construction |
| Infrastructure |
| Industrial Facilities |
| Utilities and Energy |
| Asia-Pacific | China |
| Japan | |
| India | |
| South Korea | |
| ASEAN Countries | |
| Rest of Asia-Pacific | |
| North America | United States |
| Canada | |
| Mexico | |
| Europe | Germany |
| United Kingdom | |
| France | |
| Italy | |
| Spain | |
| Russia | |
| NORDIC Countries | |
| Rest of Europe | |
| South America | Brazil |
| Argentina | |
| Rest of South America | |
| Middle East and Africa | Saudi Arabia |
| South Africa | |
| Rest of Middle East and Africa |
| By Type | Crushed Stone and Gravel | |
| Sand | ||
| Other Types (Slag, Asphalt Millings, etc.) | ||
| By Application | Road Base and Pavement | |
| Building Foundations | ||
| Landscaping | ||
| Structural Concrete | ||
| Drainage and Fill | ||
| By End-User Industry | Residential Construction | |
| Commercial Construction | ||
| Infrastructure | ||
| Industrial Facilities | ||
| Utilities and Energy | ||
| By Geography | Asia-Pacific | China |
| Japan | ||
| India | ||
| South Korea | ||
| ASEAN Countries | ||
| Rest of Asia-Pacific | ||
| North America | United States | |
| Canada | ||
| Mexico | ||
| Europe | Germany | |
| United Kingdom | ||
| France | ||
| Italy | ||
| Spain | ||
| Russia | ||
| NORDIC Countries | ||
| Rest of Europe | ||
| South America | Brazil | |
| Argentina | ||
| Rest of South America | ||
| Middle East and Africa | Saudi Arabia | |
| South Africa | ||
| Rest of Middle East and Africa | ||


Key Questions Answered in the Report
What are the key growth drivers behind recycled concrete aggregates?
Tightening waste-diversion laws, cost savings versus virgin stone, and the ability to monetize embedded carbon credits are pushing adoption across infrastructure and residential building.
How large will global recycled concrete volumes be by 2030?
The recycled concrete aggregates market size is projected to reach 15.93 million tons by 2030, expanding at a 6.22% CAGR.
Which region leads demand for recycled aggregates?
Asia-Pacific accounts for 40.25% of global demand and is also the fastest-growing at 6.88% CAGR through 2030.
Why do road projects prefer recycled concrete?
Decades of field trials prove adequate strength and freeze-thaw durability, while on-site crushing cuts haul costs and CO₂, aligning with state DoT sustainability goals.
Page last updated on:


