Market Overview
| Study Period | 2021 - 2031 |
|---|---|
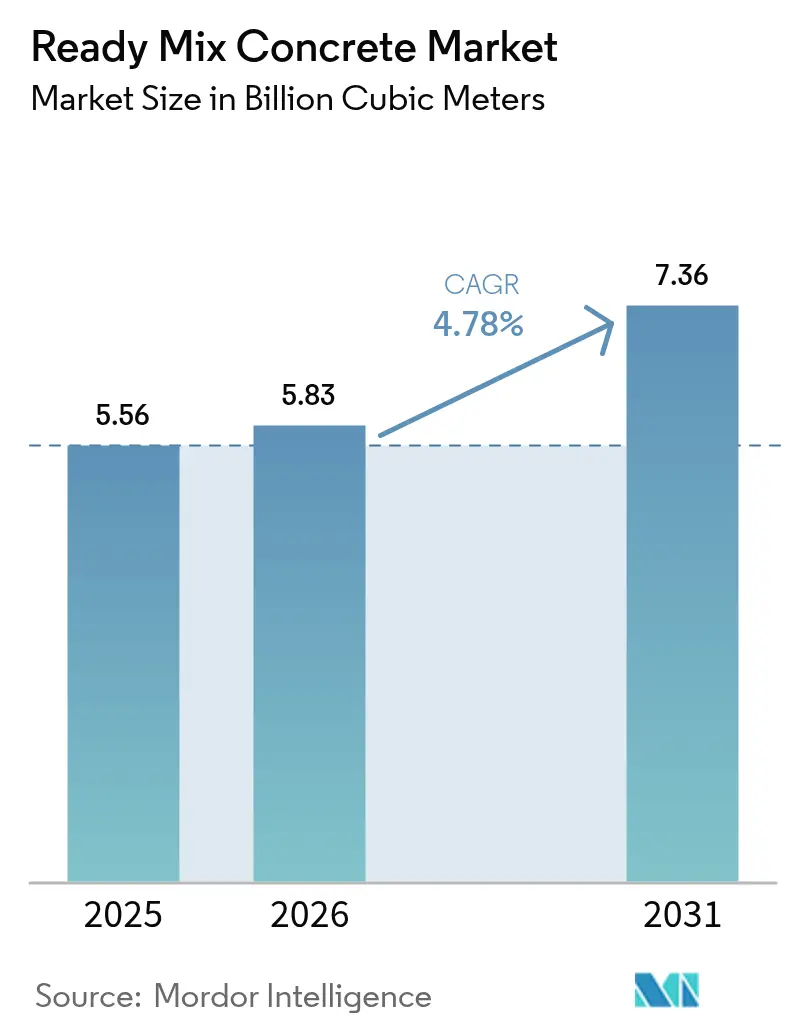
| Market Volume (2026) | 5.83 Billion cubic meters |
| Market Volume (2031) | 7.36 Billion cubic meters |
| Growth Rate (2026 - 2031) | 4.78% CAGR |
| Fastest Growing Market | Asia Pacific |
| Largest Market | Asia Pacific |
| Market Concentration | Low |
Major Players *Disclaimer: Major Players sorted in no particular order Image © Mordor Intelligence. Reuse requires attribution under CC BY 4.0. | |
Ready Mix Concrete Market Analysis by Mordor Intelligence
The Ready Mix Concrete Market size was valued at 5.56 billion cubic meters in 2025 and is estimated to grow from 5.83 billion cubic meters in 2026 to reach 7.36 billion cubic meters by 2031, at a CAGR of 4.78% during the forecast period (2026-2031). As the residential momentum plateaus in several developed economies, the demand remains robust, bolstered by a sustained build-out of mega-infrastructure corridors, stricter specifications rewarding factory-certified batching, and a growing adoption of low-carbon formulations. Asia-Pacific stands at the heart of this growth narrative. In India, fiscal stimuli are invigorating the market, while China shows early signs of a construction rebound. Meanwhile, in North America and Europe, public buyers are increasingly embedding liquidated-damages clauses and embodied-carbon caps. These measures favor producers who are able to validate mix quality and emissions footprints in real time. The competitive landscape is evolving, with a shift from merely expanding capacity to prioritizing proximity, leveraging sensor-enabled logistics, and the capability to produce environmental product declarations on demand.
Key Report Takeaways
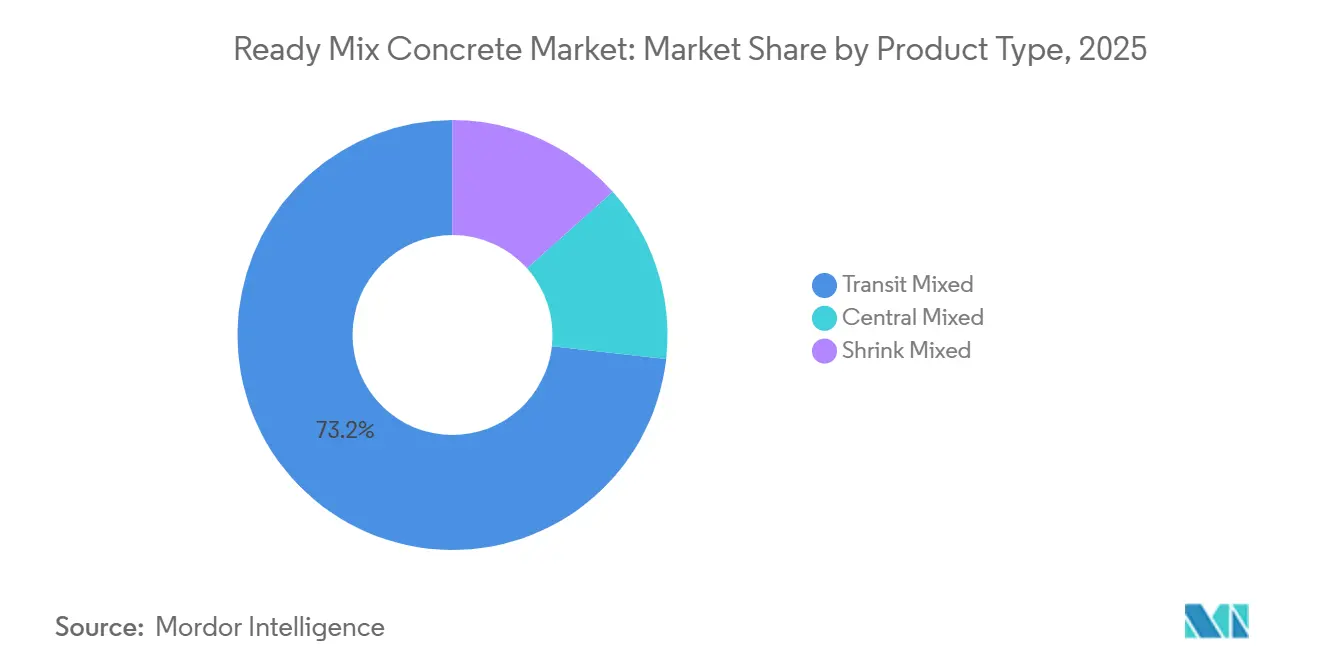
- By product type, transit mixed concrete led with 73.22% of the ready mix concrete market share in 2025. Shrink mixed concrete is projected to advance at a 5.71% CAGR in the forecast period (2026-2031).
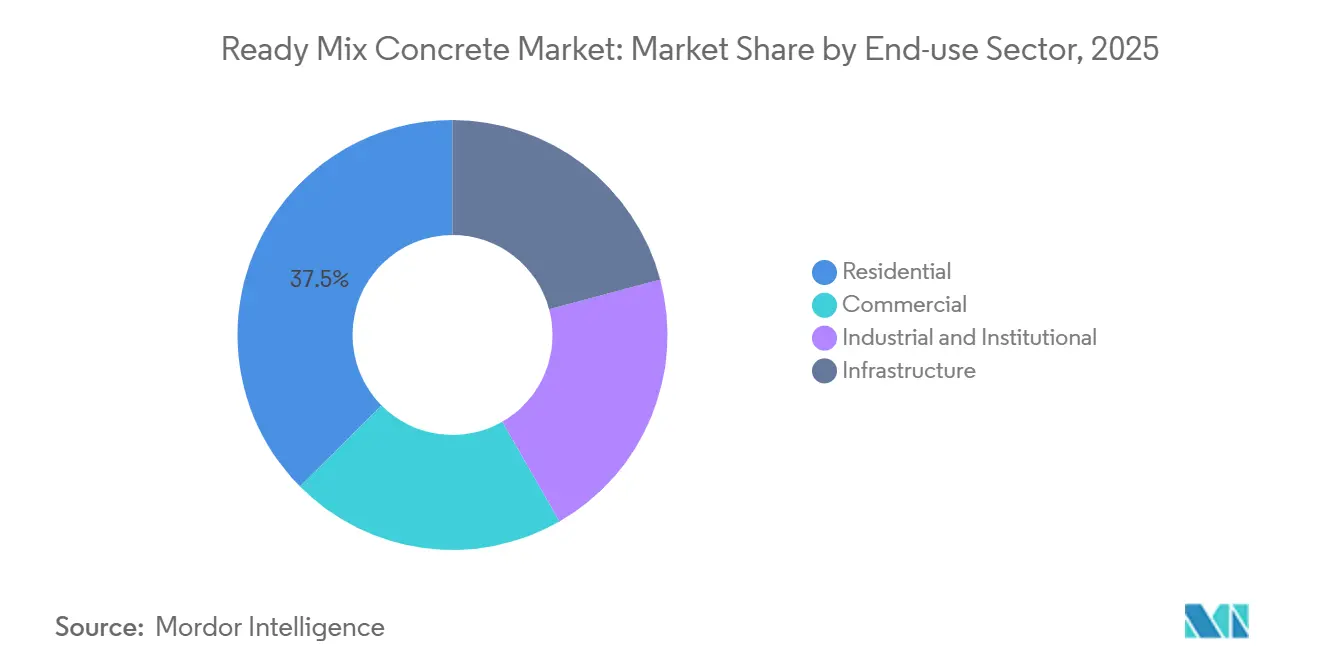
- By end-use sector, residential construction commanded a 37.45% share of the ready mix concrete market size in 2025. Infrastructure applications are forecast to expand at a 5.96% CAGR in the forecast period (2026-2031).
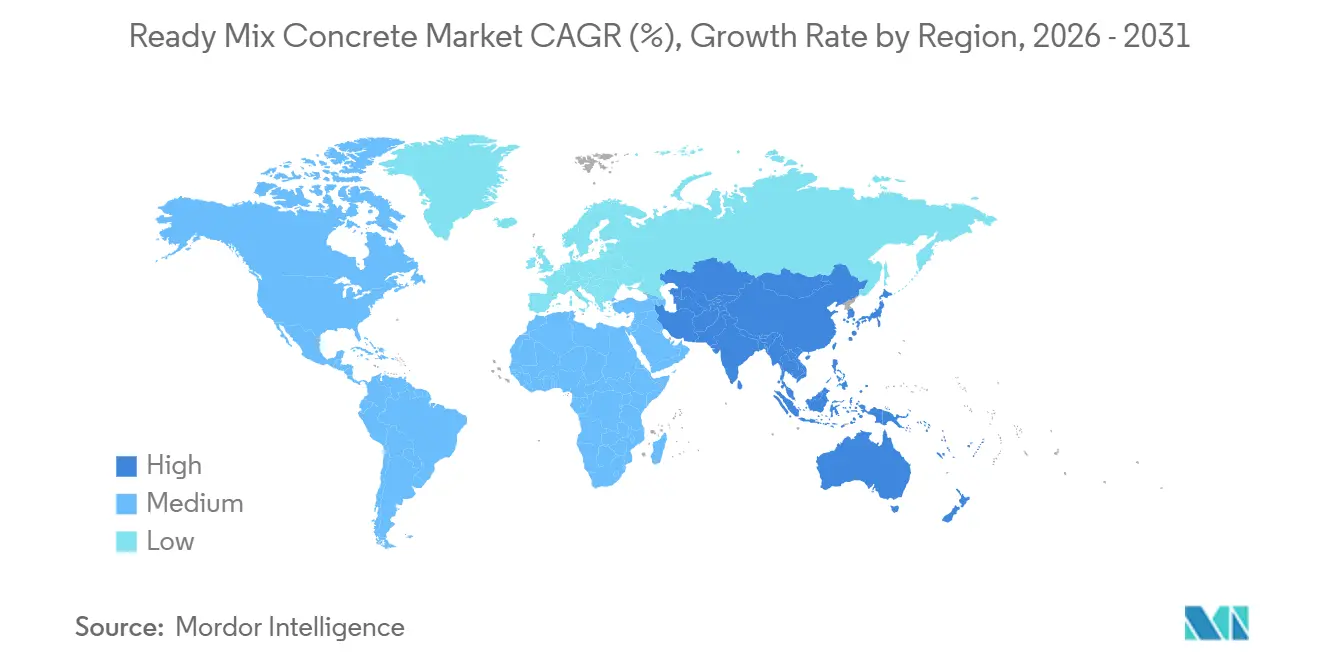
- By geography, Asia-Pacific captured a 77.12% share of the ready mix concrete market in 2025 and is set to grow at a 5.12% CAGR in the forecast period (2026-2031).
Note: Market size and forecast figures in this report are generated using Mordor Intelligence’s proprietary estimation framework, updated with the latest available data and insights as of 2026.
Global Ready Mix Concrete Market Trends and Insights
Drivers Impact Analysis*
| Drivers | (~) % Impact on CAGR Forecast | Geographic Relevance | Impact Timeline |
|---|---|---|---|
| Government mega-infrastructure pipelines | +1.4% | Global, concentrated in North America, Middle East, South America | Medium term (2-4 years) |
| Preference for quality-controlled off-site batching | +1.1% | North America, Europe, Asia-Pacific urban clusters | Short term (≤ 2 years) |
| Environmental push for low-carbon material efficiency | +0.9% | Europe, North America West Coast, early adopters in Asia-Pacific | Long term (≥ 4 years) |
| On-site 3D printing hubs boosting RMC admixture demand | +0.6% | North America, Europe, pilot projects in Middle East | Long term (≥ 4 years) |
| AI-based real-time slump-monitoring sensors | +0.5% | North America, Europe, Asia-Pacific Tier-1 cities | Medium term (2-4 years) |
| Source: Mordor Intelligence | |||
Government Mega-Infrastructure Pipelines
Dozens of sovereign programs are locking in multi-year volumes. However, the contract language now penalizes deliveries that exceed a 90-minute window[1]Kentucky Transportation Cabinet, “Six-Year Highway Plan 2025-2030,” KYTC, transportation.ky.gov. This requirement has compelled suppliers to utilize GPS-tracked fleets and predictive traffic models. States such as Massachusetts now mandate that self-consolidating mixes remain workable for only 60 minutes. This change reduces the time buffer that transit-mixed trucks previously depended on. In Argentina, bidders are required to demonstrate batch-plant capacity within 20 kilometers of each concession segment. This rule aims to prevent slump loss during mountainous hauls. In response, global giants are making strategic acquisitions. For example, CRH's acquisition of Eco Material represents a move to secure the concrete pipeline for the Osaka-Kansai Expo. The overarching lesson is clear: in bid evaluations, where penalty clauses can significantly impact project value, proximity and data-driven logistics have taken precedence over sheer volume.
Preference for Quality-Controlled Off-Site Batching
As litigation over compressive-strength failures intensifies, owners are shifting variability risk from job sites to certified factory plants. Astec's ISO 9001-certified RexCon facility now serves precast manufacturers, who previously rejected a substantial portion of on-site volumetric pours. Giatec's SmartMix platform, which streams slump and temperature data from multiple plants, has reduced the need for core sampling and lowered insurance premiums. In Denmark, every delivery from STARK Group is now equipped with Converge wireless sensors, significantly minimizing strength variability. Suppliers achieving coefficients of variation below a specific threshold are strengthening their competitive edge, a benchmark that smaller operators, lacking automated dosing, struggle to attain. The trend of consolidation is highlighted by Martin Marietta's acquisition of Quikrete assets, emphasizing the growing necessity of scale to invest in digital tools mandated by modern specifications.
Environmental Push for Low-Carbon Material Efficiency
Embodied-carbon ceilings are reshaping the ready-mix concrete market, creating a divide between compliant and non-compliant tiers. The U.S. General Services Administration has imposed limits on concrete mixes, moving away from traditional formulations. California has gone further, mandating a clinker substitution for highway pours and fostering a secondary import market for slag sourced from East Asia. Suppliers such as Holcim, taking advantage of these opportunities, have introduced net-zero blends. While these blends ensure compliance, they come with a price premium. This dynamic has resulted in a split market: in states lacking regulations, private projects still pay for standard mixes. Meanwhile, public buyers are opting for low-carbon alternatives, opening up arbitrage opportunities for cross-border suppliers who skillfully navigate the diverse regulations.
On-Site 3D Printing Hubs Boosting RMC Admixture Demand
In the realm of additive construction, the focus of concrete design is evolving from mere strength to the nuances of rheology. COBOD's BOD2 printers are setting the bar high, requiring thixotropic mixes that can recover from a slump in just 10 seconds[2]COBOD, “Deployment Statistics for BOD2 3D Printer,” COBOD, cobod.com. Meeting this standard demands precise dosing of admixtures, a task that must be executed right at the truck side. In Texas, ICON is ambitiously working on a project to construct 100 homes, and they are turning to Lavacrete for their needs. Here, the dosing is fine-tuned within a narrow accelerator range, ensuring that the printability remains intact within a vital 45-minute timeframe. Simultaneously, GE Additive and Mighty Buildings are at the forefront, experimenting with mineral-polymer hybrids that undergo curing under UV light. However, these advancements come with a stipulation: they require chilled storage to prevent any premature cross-linking. Ready-mix plants that team up with printer OEMs to jointly develop these innovative recipes stand to benefit significantly, potentially securing exclusive multi-year supply contracts. On the other hand, traditional commodity suppliers find their role diminished, relegated mainly to infill work. As more jurisdictions lend their support to printed affordable housing projects, the ready-mix concrete market is seizing a golden opportunity, fueled by these groundbreaking innovations in admixtures.
Restraints Impact Analysis*
| Restraints | (~) % Impact on CAGR Forecast | Geographic Relevance | Impact Timeline |
|---|---|---|---|
| Short workable life and traffic-congestion risk | -0.7% | Asia-Pacific megacities, North America urban corridors | Short term (≤ 2 years) |
| Proliferation of on-site volumetric mixers | -0.5% | North America, Australia, emerging in Middle East | Medium term (2-4 years) |
| Carbon taxes on transport kilometers | -0.4% | Europe, pilot programs in North America West Coast | Long term (≥ 4 years) |
| Source: Mordor Intelligence | |||
Short Workable Life and Traffic-Congestion Risk
In cities where a 50-kilometer haul can face traffic delays exceeding 20 minutes, the 90-minute window between batching and placement becomes precariously tight. By 2025, deliveries in Jakarta experienced significant extensions, leading suppliers to rely more on retarders and consequently pushing finishing times back by several hours. During the 2025 monsoon, producers in Mumbai suffered notable load losses, resulting in substantial batch wastage. Los Angeles addresses this issue using Giatec’s MixPilot system; however, it incurs additional costs, as each truck now bears extra sensor fees. In response to these challenges, the economic landscape is witnessing the emergence of localized satellite plants. These plants, strategically located within 15 kilometers of congested sites, are absorbing higher fixed costs to mitigate traffic unpredictability.
Proliferation of On-Site Volumetric Mixers
Contractors are increasingly turning to mobile batching units as haul costs surpass a certain threshold per cubic meter. Cemen Tech’s C-60, which can produce substantial daily volumes, operates directly on-site, avoiding the need for minimum-order surcharges. In recent years, Zimmerman Industries has reported a significant increase in North American sales, primarily serving rural builders who previously paid a premium for smaller ready-mix loads. Traditional suppliers are also adapting - Ozinga, after acquiring Elston’s fleet, now dispatches volumetric units for orders below 10 cubic meters. This shift is tightening margins at the lower end of the ready-mix concrete market and intensifying competition for larger infrastructure pours.
*Our forecasts treat driver/restraint impacts as directional, not additive. The impact forecasts reflect baseline growth, mix effects, and variable interactions.
Segment Analysis
By Product Type: Transit-Mixed Solutions Dominate Mid-Range Hauls
In 2025, transit-mixed concrete commanded a dominant 73.22% share of the market volume. Its popularity was largely due to its in-truck mixing feature, which ensured workability for projects situated 15 to 50 kilometers from the plant. Although shrink-mixed concrete captured a smaller slice of the market, it outpaced others with a projected CAGR of 5.71% during the forecast period of 2026–2031. This growth highlighted urban contractors' focus on controlled hydration, particularly when maneuvering through stop-and-go traffic. Central-mixed concrete, on the other hand, carved out a niche, serving precast yards and high-rise pumping projects that prioritized uniformity, even at a premium price.
In the bustling megacities of the Asia-Pacific region, the preference for shrink-mixed variants was clear. For instance, Guangzhou’s metro extension led to a notable capacity increase at Foshan Huijiang in 2025. Meanwhile, Texas highway contractors opted for transit-mixed solutions for hauls of 40 to 60 kilometers, capitalizing on the area's predictable traffic. In Canada, regions grappling with freeze-thaw cycles turned to central-mixed concrete. These locales demanded a precise air entrainment of 6% ± 1%, a benchmark that many transit mixers found challenging to consistently achieve. Consequently, while the central-mixed concrete market held steady, its elevated margins underscored the rigorous quality standards in play.


By End-Use Sector: Infrastructure Pipeline Fuels Outperformance
Infrastructure has claimed a notable slice of the global volume pie, and projections indicate a robust 5.96% CAGR growth rate extending through 2026–2031, outpacing all other sectors. Residential construction, buoyed by India's aggressive push for affordable housing, commanded the largest share at 37.45% in 2025, even as home starts in developed nations faced a slowdown. Meanwhile, the commercial and institutional sectors grappled with challenges, including remote work trends, zoning hurdles, and a growing inclination to repurpose existing properties rather than pursue new developments.
Backlog data underscores the escalating significance of infrastructure. The United States grapples with a funding shortfall through 2029, spotlighting urgent needs such as thicker concrete overlays and bridge deck replacements. Data centers, in a bid to protect servers from thermal fluctuations, are turning to specialized low-heat-of-hydration ready mixes for their foundations - a demand that is proving challenging for smaller plants to satisfy. In Indonesia, the construction boom of 2025 was fueled by the inauguration of a new capital city and a spike in flood-resilient housing initiatives. Given these trends, infrastructure's foothold in the ready-mix concrete market is set to strengthen, offering a cushion against the cyclical ups and downs of the residential and commercial sectors.
Geography Analysis
In 2025, Asia-Pacific commanded a dominant 77.12% of global demand and is set to maintain a robust 5.12% CAGR through the forecast period of 2026–2031. Cement producers in India, eyeing the National Infrastructure Pipeline's peak volumes by 2030, have poured substantial investments into kiln expansions. In early 2026, China greenlit expansive urban rail projects, signaling a rebound in demand for tunnel and station pours after three years of decline. By 2035, Indonesia's Nusantara capital project is anticipated to make hefty concrete demands. Meanwhile, in 2025, mature economies such as Japan and South Korea are channeling significant funds into seismic retrofit programs.
In 2025, North America, spearheaded by the United States, claimed a significant chunk of global consumption. The Federal Highway Administration's 2026 budget is fueling an ambitious resurfacing initiative. Benefiting from near-shoring, Mexico in 2025 is pouring considerable volumes into industrial-warehouse slabs, primarily catering to export-driven manufacturers. While consistent infrastructure spending in Canada moderated growth, Quebec's light-rail contracts were instrumental in sustaining baseline demand.
Europe made its mark in the global volume arena in 2025. Germany's autobahn rehabilitation project notably leaned on polymer-modified concrete to extend pavement longevity. While the Energy Performance of Buildings Directive's carbon mandates pose compliance hurdles, they simultaneously boost demand for certified low-carbon suppliers. The Middle-East and Africa, despite a smaller 2025 volume share, are gearing up for notable annual growth through the forecast period of 2026–2031. This surge is primarily fueled by Saudi Arabia's NEOM, which secured a pivotal concrete factory contract in 2026. In South America, Brazil is making waves, leveraging substantial investments from 2026 concession auctions to sustain its annual toll road demand.

Competitive Landscape
The ready-mix concrete market is fragmented. Major companies are now prioritizing geographic clustering as a strategic move. Instead of expanding their central hubs, these companies are establishing satellite plants near high-density employment areas. This shift comes with an increase in capital expenditures, a calculated decision to mitigate traffic challenges and meet the modern contract stipulation of a less-than-90-minute workability guarantee.
Ready Mix Concrete Industry Leaders
Holcim
Heidelberg Materials
CEMEX SAB de CV
CRH
China National Building Material Group Corporation
- *Disclaimer: Major Players sorted in no particular order

Recent Industry Developments
- May 2025: Boral Limited announced the acquisition of the Wallan Concrete plant in the North of Melbourne. The strategic acquisition of the concrete plant allows Boral to service customers in an identified growth corridor as part of Boral’s integrated operations.
- April 2025: Heidelberg Materials announced that it has entered into a conditional purchase agreement to acquire the ready-mixed concrete business of Midway Concrete. The company operates four concrete plants at Laverton, Craigieburn, Melton, and Lara. This acquisition complements the existing concrete and quarry operations within Melbourne, strengthening the company's integrated market position in the region.


Global Ready Mix Concrete Market Report Scope
Ready Mix Concrete (RMC) is defined as a factory-engineered blend of cement, water, and aggregates, delivered directly to construction sites. This method guarantees high quality, consistent results, and minimizes on-site labor. RMC is categorized by its mixing method - central, shrink, or transit - and is utilized in the commercial, industrial, infrastructure, and residential sectors.
The ready-mix concrete market is segmented by product type, end-use sector, and geography. By product type, the market is segmented into central mixed, shrink mixed, and transit mixed. By end-use sector, the market is segmented into commercial, industrial and institutional, infrastructure, and residential. The report also covers the market size and forecasts for the market in 20 countries across major regions. For each segment, the market sizing and forecasts are done based on volume (Cubic Meters).
By Product Type
| Central Mixed |
| Shrink Mixed |
| Transit Mixed |
By End-use Sector
| Commercial |
| Industrial and Institutional |
| Infrastructure |
| Residential |
By Geography
| Asia-Pacific | China |
| India | |
| Japan | |
| South Korea | |
| Australia | |
| Indonesia | |
| Vietnam | |
| Rest of Asia-Pacific | |
| North America | United States |
| Canada | |
| Mexico | |
| Europe | Germany |
| France | |
| United Kingdom | |
| Italy | |
| Spain | |
| Russia | |
| Rest of Europe | |
| South America | Brazil |
| Argentina | |
| Rest of South America | |
| Middle-East and Africa | Saudi Arabia |
| United Arab Emirates | |
| Rest of Middle-East and Africa |
| By Product Type | Central Mixed | |
| Shrink Mixed | ||
| Transit Mixed | ||
| By End-use Sector | Commercial | |
| Industrial and Institutional | ||
| Infrastructure | ||
| Residential | ||
| By Geography | Asia-Pacific | China |
| India | ||
| Japan | ||
| South Korea | ||
| Australia | ||
| Indonesia | ||
| Vietnam | ||
| Rest of Asia-Pacific | ||
| North America | United States | |
| Canada | ||
| Mexico | ||
| Europe | Germany | |
| France | ||
| United Kingdom | ||
| Italy | ||
| Spain | ||
| Russia | ||
| Rest of Europe | ||
| South America | Brazil | |
| Argentina | ||
| Rest of South America | ||
| Middle-East and Africa | Saudi Arabia | |
| United Arab Emirates | ||
| Rest of Middle-East and Africa | ||


Market Definition
- END-USE SECTOR - Ready-mix concrete consumed in the construction sectors such as commercial, residential, industrial, institutional, and infrastructure are considered under the scope of the study.
- PRODUCT/APPLICATION - Under the scope of the study, the consumption of transit-mixed, shrink-mixed, and central-mixed ready-mix concrete are considered.
| Keyword | Definition |
|---|---|
| Accelerator | Accelerators are admixtures used to fasten the setting time of concrete by increasing the initial rate and speeding up the chemical reaction between cement and the mixing water. These are used to harden and increase the strength of concrete quickly. |
| Acrylic | This synthetic resin is a derivative of acrylic acid. It forms a smooth surface and is mainly used for various indoor applications. The material can also be used for outdoor applications with a special formulation. |
| Adhesives | Adhesives are bonding agents used to join materials by gluing. Adhesives can be used in construction for many applications, such as carpet laying, ceramic tiles, countertop lamination, etc. |
| Air Entraining Admixture | Air-entraining admixtures are used to improve the performance and durability of concrete. Once added, they create uniformly distributed small air bubbles to impart enhanced properties to the fresh and hardened concrete. |
| Alkyd | Alkyds are used in solvent-based paints such as construction and automotive paints, traffic paints, flooring resins, protective coatings for concrete, etc. Alkyd resins are formed by the reaction of an oil (fatty acid), a polyunsaturated alcohol (Polyol), and a polyunsaturated acid or anhydride. |
| Anchors and Grouts | Anchors and grouts are construction chemicals that stabilize and improve the strength and durability of foundations and structures like buildings, bridges, dams, etc. |
| Cementitious Fixing | Cementitious fixing is a process in which a cement-based grout is pumped under pressure to fill forms, voids, and cracks. It can be used in several settings, including bridges, marine applications, dams, and rock anchors. |
| Commercial Construction | Commercial construction comprises new construction of warehouses, malls, shops, offices, hotels, restaurants, cinemas, theatres, etc. |
| Concrete Admixtures | Concrete admixtures comprise water reducers, air entrainers, retarders, accelerators, superplasticizers, etc., added to concrete before or during mixing to modify its properties. |
| Concrete Protective Coatings | To provide specific protection, such as anti-carbonation or chemical resistance, a film-forming protective coat can be applied on the surface. Depending on the applications, different resins like epoxy, polyurethane, and acrylic can be used for concrete protective coatings. |
| Curing Compounds | Curing compounds are used to cure the surface of concrete structures, including columns, beams, slabs, and others. These curing compounds keep the moisture inside the concrete to give maximum strength and durability. |
| Epoxy | Epoxy is known for its strong adhesive qualities, making it a versatile product in many industries. It resists heat and chemical applications, making it an ideal product for anyone needing a stronghold under pressure. It is widely used in adhesives, electrical and electronics, paints, etc. |
| Fiber Wrapping Systems | Fiber Wrapping Systems are a part of construction repair and rehabilitation chemicals. It involves the strengthening of existing structures by wrapping structural members like beams and columns with glass or carbon fiber sheets. |
| Flooring Resins | Flooring resins are synthetic materials applied to floors to enhance their appearance, increase their resistance to wear and tear or provide protection from chemicals, moisture, and stains. Depending on the desired properties and the specific application, flooring resins are available in distinct types, such as epoxy, polyurethane, and acrylic. |
| High-Range Water Reducer (Super Plasticizer) | High-range water reducers are a type of concrete admixture that provides enhanced and improved properties when added to concrete. These are also called superplasticizers and are used to decrease the water-to-cement ratio in concrete. |
| Hot Melt Adhesives | Hot-melt adhesives are thermoplastic bonding materials applied as melts that achieve a solid state and resultant strength on cooling. They are commonly used for packaging, coatings, sanitary products, and tapes. |
| Industrial and Institutional Construction | Industrial and institutional construction includes new construction of hospitals, schools, manufacturing units, energy and power plants, etc. |
| Infrastructure Construction | Infrastructure construction includes new construction of railways, roads, seaways, airports, bridges, highways, etc. |
| Injection Grouting | The process of injecting grout into open joints, cracks, voids, or honeycombs in concrete or masonry structural members is known as injection grouting. It offers several benefits, such as strengthening a structure and preventing water infiltration. |
| Liquid-Applied Waterproofing Membranes | Liquid-Applied membrane is a monolithic, fully bonded, liquid-based coating suitable for many waterproofing applications. The coating cures to form a rubber-like elastomeric waterproof membrane and may be applied over many substrates, including asphalt, bitumen, and concrete. |
| Micro-concrete Mortars | Micro-concrete mortar is made up of cement, water-based resin, additives, mineral pigments, and polymers and can be applied on both horizontal and vertical surfaces. It can be used to refurbish residential complexes, commercial spaces, etc. |
| Modified Mortars | Modified Mortars include Portland cement and sand along with latex/polymer additives. The additives increase adhesion, strength, and shock resistance while also reducing water absorption. |
| Mold Release Agents | Mold release agents are sprayed or coated on the surface of molds to prevent a substrate from bonding to a molding surface. Several types of mold release agents, including silicone, lubricant, wax, fluorocarbons, and others, are used based on the type of substrates, including metals, steel, wood, rubber, plastic, and others. |
| Polyaspartic | Polyaspartic is a subset of polyurea. Polyaspartic floor coatings are typically two-part systems that consist of a resin and a catalyst to ease the curing process. It offers high durability and can withstand harsh environments. |
| Polyurethane | Polyurethane is a plastic material that exists in various forms. It can be tailored to be either rigid or flexible and is the material of choice for a broad range of end-user applications, such as adhesives, coatings, building insulation, etc. |
| Reactive Adhesives | A reactive adhesive is made of monomers that react in the adhesive curing process and do not evaporate from the film during use. Instead, these volatile components become chemically incorporated into the adhesive. |
| Rebar Protectors | In concrete structures, rebar is one of the important components, and its deterioration due to corrosion is a major issue that affects the safety, durability, and life span of buildings and structures. For this reason, rebar protectors are used to protect against degrading effects, especially in infrastructure and industrial construction. |
| Repair and Rehabilitation Chemicals | Repair and Rehabilitation Chemicals include repair mortars, injection grouting materials, fiber wrapping systems, micro-concrete mortars, etc., used to repair and restore existing buildings and structures. |
| Residential Construction | Residential construction involves constructing new houses or spaces like condominiums, villas, and landed homes. |
| Resin Fixing | The process of using resins like epoxy and polyurethane for grouting applications is called resin fixing. Resin fixing offers several advantages, such as high compressive and tensile strength, negligible shrinkage, and greater chemical resistance compared to cementitious fixing. |
| Retarder | Retarders are admixtures used to slow down the setting time of concrete. These are usually added with a dosage rate of around 0.2% -0.6% by weight of cement. These admixtures slow down hydration or lower the rate at which water penetrates the cement particles by making concrete workable for a long time. |
| Sealants | A sealant is a viscous material that has little or no flow qualities, which causes it to remain on surfaces where they are applied. Sealants can also be thinner, enabling penetration to a certain substance through capillary action. |
| Sheet Waterproofing Membranes | Sheet membrane systems are reliable and durable thermoplastic waterproofing solutions that are used for waterproofing applications even in the most demanding below-ground structures, including those exposed to highly aggressive ground conditions and stress. |
| Shrinkage Reducing Admixture | Shrinkage-reducing admixtures are used to reduce concrete shrinkage, whether from drying or self-desiccation. |
| Silicone | Silicone is a polymer that contains silicon combined with carbon, hydrogen, oxygen, and, in some cases, other elements. It is an inert synthetic compound that comes in various forms, such as oil, rubber, and resin. Due to its heat-resistant properties, it finds applications in sealants, adhesives, lubricants, etc. |
| Solvent-borne Adhesives | Solvent-borne adhesives are mixtures of solvents and thermoplastic or slightly cross-linked polymers such as polychloroprene, polyurethane, acrylic, silicone, and natural and synthetic rubbers. |
| Surface Treatment Chemicals | Surface treatment chemicals are chemicals used to treat concrete surfaces, including roofs, vertical surfaces, and others. They act as curing compounds, demolding agents, rust removers, and others. They are cost-effective and can be used on roadways, pavements, parking lots, and others. |
| Viscosity Modifier | Viscosity Modifiers are concrete admixtures used to change various properties of admixtures, including viscosity, workability, cohesiveness, and others. These are usually added with a dosage of around 0.01% to 0.1% by weight of cement. |
| Water Reducer | Water reducers, also called plasticizers, are a type of admixture used to decrease the water-to-cement ratio in the concrete, thereby increasing the durability and strength of concrete. Various water reducers include refined lignosulfonates, gluconates, hydroxycarboxylic acids, sugar acids, and others. |
| Water-borne Adhesives | Water-borne adhesives use water as a carrier or diluting medium to disperse resin. They are set by allowing the water to evaporate or be absorbed by the substrate. These adhesives are compounded with water as a dilutant rather than a volatile organic solvent. |
| Waterproofing Chemicals | Waterproofing chemicals are designed to protect a surface from the perils of leakage. A waterproofing chemical is a protective coating or primer applied to a structure's roof, retaining walls, or basement. |
| Waterproofing Membranes | Waterproofing membranes are liquid-applied or self-adhering layers of water-tight materials that prevent water from penetrating or damaging a structure when applied to roofs, walls, foundations, basements, bathrooms, and other areas exposed to moisture or water. |


Research Methodology
Mordor Intelligence follows a four-step methodology in all our reports.
- Step-1: Identify Key Variables: The quantifiable key variables (industry and extraneous) pertaining to the specific product segment and country are selected from a group of relevant variables & factors based on desk research & literature review; along with primary expert inputs. These variables are further confirmed through regression modeling (wherever required).
- Step-2: Build a Market Model: In order to build a robust forecasting methodology, the variables and factors identified in Step-1 are tested against available historical market numbers. Through an iterative process, the variables required for market forecast are set and the model is built on the basis of these variables.
- Step-3: Validate and Finalize: In this important step, all market numbers, variables and analyst calls are validated through an extensive network of primary research experts from the market studied. The respondents are selected across levels and functions to generate a holistic picture of the market studied.
- Step-4: Research Outputs: Syndicated Reports, Custom Consulting Assignments, Databases & Subscription Platforms


