Pick To Light Market Size and Share
Market Overview
| Study Period | 2019 - 2030 |
|---|---|
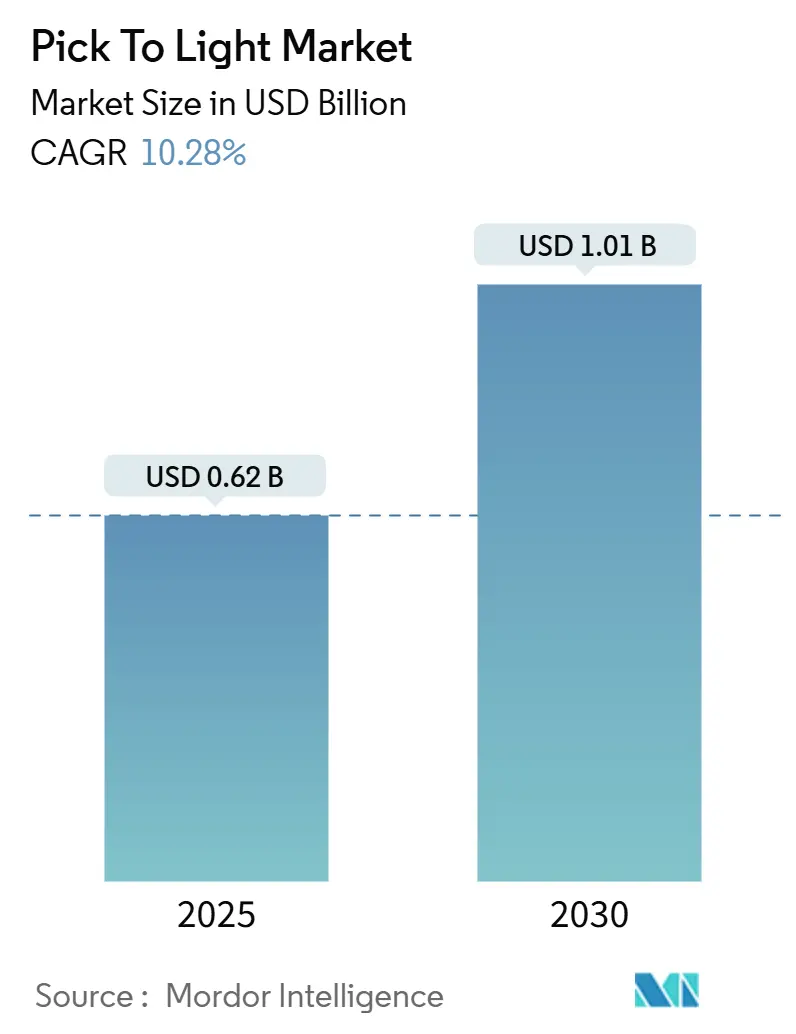
| Market Size (2025) | USD 0.62 Billion |
| Market Size (2030) | USD 1.01 Billion |
| Growth Rate (2025 - 2030) | 10.28% CAGR |
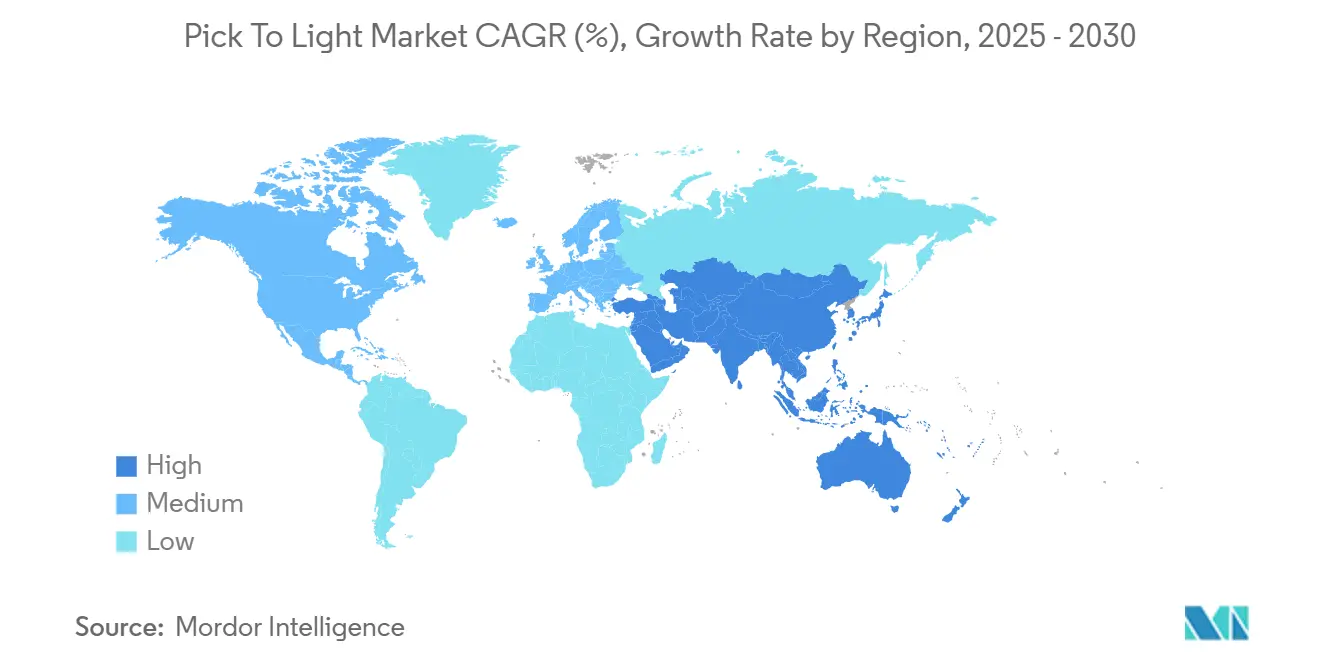
| Fastest Growing Market | Asia Pacific |
| Largest Market | North America |
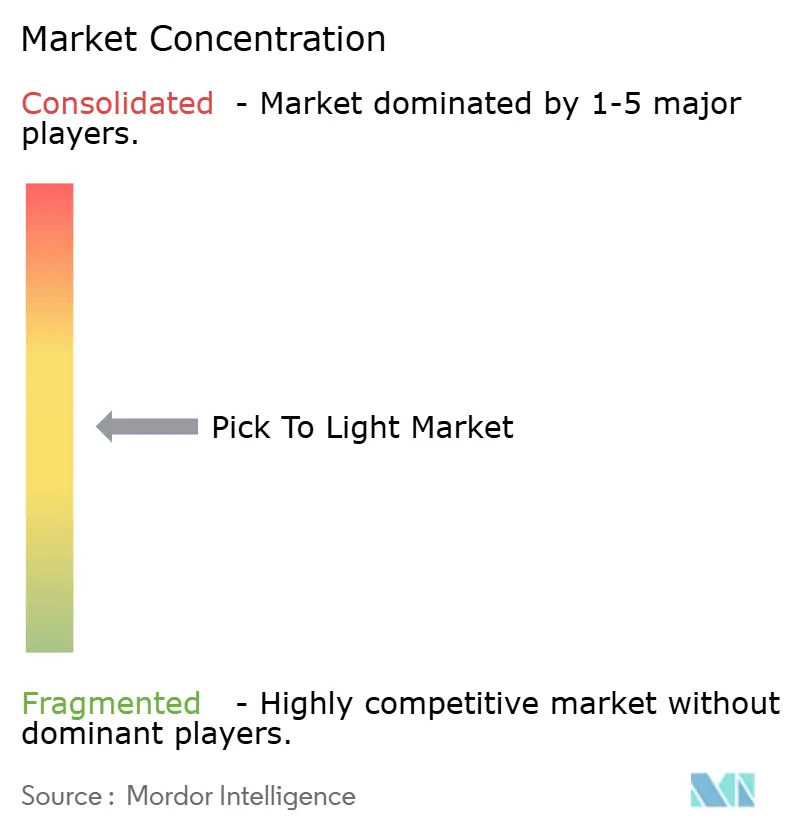
| Market Concentration | Medium |
Major Players *Disclaimer: Major Players sorted in no particular order Image © Mordor Intelligence. Reuse requires attribution under CC BY 4.0. | |
Pick To Light Market Analysis by Mordor Intelligence
The Pick to Light market size is valued at USD 0.62 billion in 2025 and is projected to reach USD 1.01 billion by 2030, advancing at a 10.28% CAGR over the forecast period, underscoring the strong momentum behind warehouse-level digitalization. Surging e-commerce order lines, escalating labor shortages, and the falling cost of wireless retrofit modules keep the Pick to Light market on an aggressive growth path while allowing operators to avoid disruptive facility overhauls. Hardware miniaturization, LED energy efficiency, and tighter software integration with warehouse execution platforms continue to reshape competitive differentiation. Intensifying consolidation—illustrated by Vanderlande’s 2024 purchase of Siemens Logistics—shows leading vendors racing to pair material-handling depth with advanced digital automation. North America retains system-upgrade leadership, whereas Asia-Pacific leapfrogs to new builds on the back of 14.32% regional CAGR, highlighting divergent automation maturity curves.
Key Report Takeaways
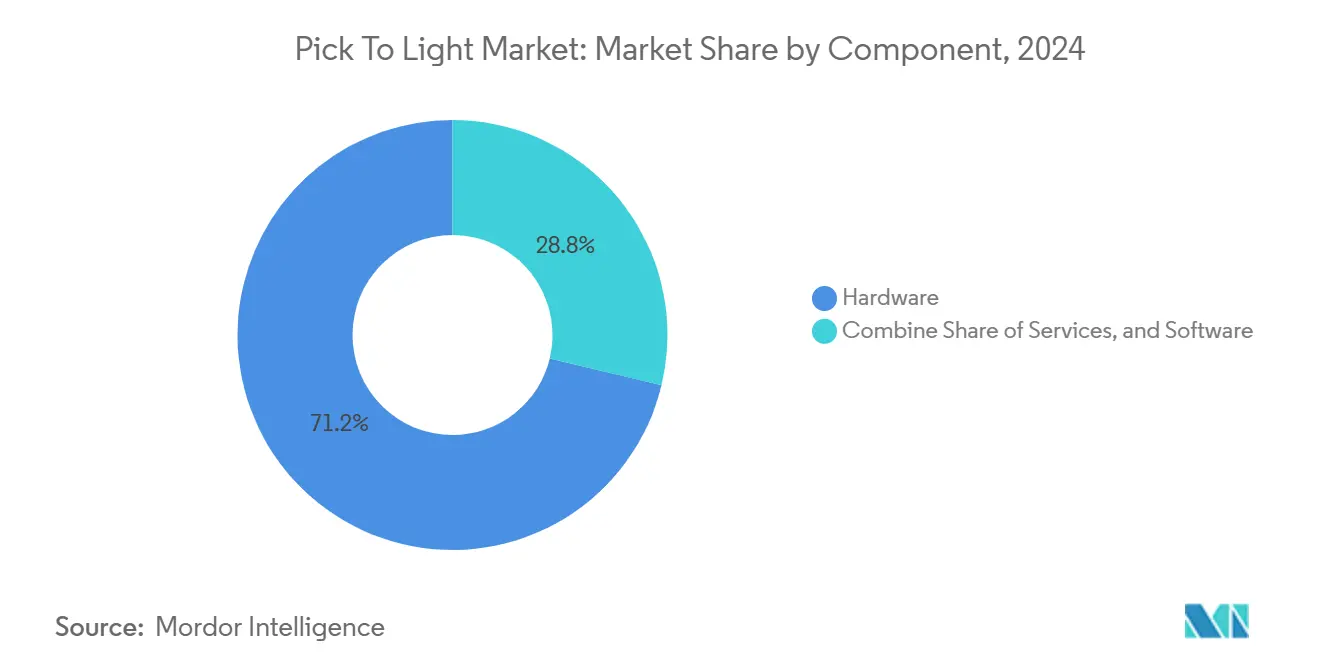
- By component, hardware captured 71.24% of Pick to Light market share in 2024, while the services segment is advancing at a 12.21% CAGR to 2030.
- By installation type, retrofit projects held 65.42% share of the Pick to Light market size in 2024 and greenfield builds are expanding at an 11.45% CAGR through 2030.
- By mounting type, shelf-mounted systems led with 46.42% revenue share in 2024 whereas mobile and cart-based solutions are projected to post a 13.53% CAGR to 2030.
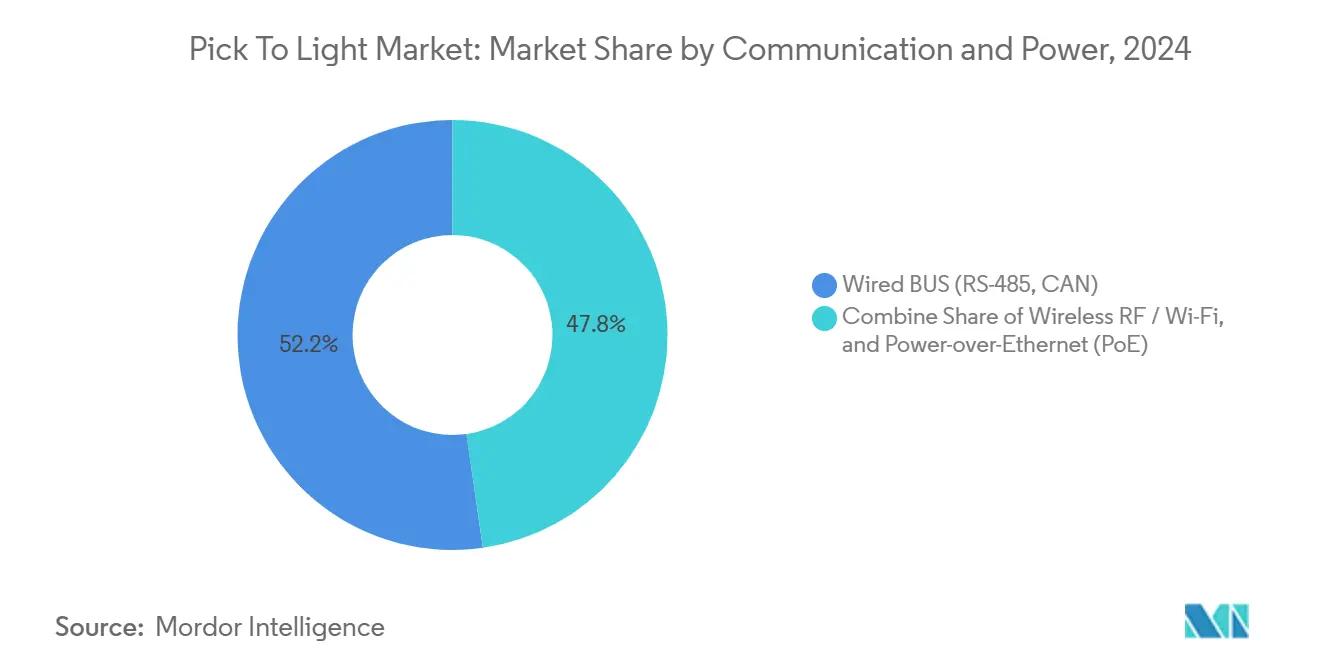
- By communication and power, wired BUS platforms commanded 52.24% share of the Pick to Light market in 2024, yet wireless deployments are rising at a 12.11% CAGR through 2030.
- By end-use industry, e-commerce and retail led with 28.33% share of the Pick to Light market size in 2024 while pharmaceuticals and healthcare exhibit the fastest 15.21% CAGR to 2030.
- By geography, North America accounted for 38.23% of the Pick to Light market in 2024; Asia-Pacific is on track to grow at a 14.32% CAGR to 2030.
Global Pick To Light Market Trends and Insights
Drivers Impact Analysis*
| Driver | (~) % Impact on CAGR Forecast | Geographic Relevance | Impact Timeline |
|---|---|---|---|
| Surge in global e-commerce order lines | +2.8% | Global, with concentration in North America and Asia-Pacific | Medium term (2-4 years) |
| Acceleration of warehouse automation to offset labor shortages | +2.1% | North America and Europe primarily, expanding to Asia-Pacific | Long term (≥ 4 years) |
| Rising accuracy and speed demands in micro-fulfillment | +1.9% | Urban centers globally, led by North America and Europe | Short term (≤ 2 years) |
| Proliferation of 3PL dark-store networks | +1.6% | Asia-Pacific core, spill-over to North America and Europe | Medium term (2-4 years) |
| Wireless retrofit light modules lowering CAPEX | +1.2% | Global, with early adoption in developed markets | Short term (≤ 2 years) |
| Convergence with AR-guided and vision-picking solutions | +0.7% | North America and Europe, gradual Asia-Pacific adoption | Long term (≥ 4 years) |
| Source: Mordor Intelligence | |||
Surge in Global E-commerce Order Lines
Single-item orders and next-day delivery commitments have collapsed the viability of paper-based batch picking, driving operators to invest in light-directed workflows that sustain accuracy above 99.9%. [1]AutoStore, “E-commerce Warehousing Guide | Key Strategies for Growth 2025,” autostoresystem.com Warehouse management software now pre-illuminates pick faces in anticipation of worker travel paths, compressing cycle times even as SKU assortments exceed 50,000. Omnichannel retailers rely on Pick to Light market deployments to synchronize store, online, and mobile inventories without inflating labor budgets. AI-enhanced algorithms continuously reprioritize picks, ensuring hot orders receive instant visual emphasis and minimizing route overlaps among associates. Because the training curve falls from weeks to hours, seasonal staff can contribute within the first shift, sustaining Black Friday throughput without proportional head-count spikes.
Acceleration of Warehouse Automation to Offset Labor Shortages
North American logistics faces a projected deficit of 1.2 million warehouse workers by 2028, making Pick to Light market systems a bridge that lets existing staff handle 30% more lines per hour without additional strain.[2]North Dakota Development Fund, “Awards USD 5 Million to Support Automation Projects,” commerce.nd.gov Multilingual displays remove language barriers in diverse workforces, while ergonomic button placement reduces repetitive-motion injuries. Rapid onboarding lowers employee turnover costs, a pressing issue where annual churn often exceeds 40%. Enterprises also embed predictive maintenance analytics that flag failing modules before peak season, locking in uptime and shielding scarce labor from unexpected downtime. In Europe, tightening regulations around worker safety further reinforce the value proposition of light-assisted processes that cut cognitive load and walking distance.
Rising Accuracy and Speed Demands in Micro-fulfillment
Urban micro-fulfillment centers process more than 1,000 orders per hour within footprints as small as 1,800 square feet, mandates only Pick to Light market architectures can satisfy. Color-coded LEDs guide staff seamlessly across ambient, chilled, and frozen zones, preserving cold-chain integrity on grocery orders. Space constraints push facilities vertical; rack heights of 30 feet remain navigable because light cues eliminate the need for aisle signage and paper pick lists. Real-time analytics feed heat maps to supervisors, showing congestion points that trigger dynamic slotting adjustments overnight. Integration with customer-facing apps lets shoppers alter baskets post-checkout, and updated picks are instantly signaled via new light cues.
Proliferation of 3PL Dark-store Networks
Asia-Pacific 3PLs deploy dedicated e-commerce hubs where Pick to Light market layouts flex hourly to accommodate client-specific promotions. Multi-tenant warehouse management software isolates inventory while sharing conveyor infrastructure, and modular light strips re-address themselves when zones are rebalanced overnight. Because dark stores have no shopper traffic, entire mezzanines operate lights-off except for illuminated pick faces, trimming energy spend by up to 60%. Cross-dock workflows see inbound cartons diverted directly to outbound put-walls, with light modules guiding placement to customer-specific totes in under three minutes. Commercial models increasingly bundle hardware, software, and labor in outcome-based SLAs that guarantee 99.95% order accuracy or trigger fee rebates.
Restraints Impact Analysis*
| Restraint | (~) % Impact on CAGR Forecast | Geographic Relevance | Impact Timeline |
|---|---|---|---|
| High upfront hardware and installation cost | -1.8% | Global, more pronounced in emerging markets | Short term (≤ 2 years) |
| Substitution by AMR goods-to-person and voice systems | -1.4% | North America and Europe, gradual Asia-Pacific impact | Medium term (2-4 years) |
| Cyber-vulnerabilities in networked light modules | -0.9% | Global, heightened in regulated industries | Long term (≥ 4 years) |
| Operator over-reliance causing situational awareness fatigue | -0.6% | Developed markets with mature automation adoption | Medium term (2-4 years) |
| Source: Mordor Intelligence | |||
High Upfront Hardware and Installation Cost
System rollouts can exceed USD 500,000 for a 400-bay facility, deterring mid-market operators that lack large purchase orders to absorb initial outlays. Retrofitting older buildings often demands electrical upgrades that inflate budgets another 25%, while temporary downtime erodes customer service metrics. Wireless modules lower conduit costs but carry premium price points that dilute savings. Robotics-as-a-Service offerings convert capex into opex, yet lifetime fees surpass owned assets after four to five years, a trade-off CFOs scrutinize closely. Government incentive programs, such as North America’s Section 179 deductions, partially ease the burden but remain intermittent and region-specific.
Substitution by AMR Goods-to-Person and Voice Systems
Autonomous mobile robots now transport totes to pick stations, reducing walking time by 70% and threatening fixed Pick to Light market infrastructure in high-SKU warehouses. [3]DC Velocity, “Picking Reimagined,” dcvelocity.com Voice solutions offer 97% accuracy without any visual hardware, appealing to operators prioritizing flexibility over capex. Hybrid AMR-plus-light carts bring discrete LEDs directly to operators, blending the benefits of both technologies yet undermining demand for traditional shelf-mounted arrays. As AMR unit costs fall below USD 20,000, payback periods rival those of light systems, especially where daily volume volatility favors modular redeployment. Vendors now hedge exposure by integrating their pick-modules onto mobile platforms, seeking relevance in a future dominated by goods-to-person workflows.
*Our forecasts treat driver/restraint impacts as directional, not additive. The impact forecasts reflect baseline growth, mix effects, and variable interactions.
Segment Analysis
By Component: Hardware Dominance Faces Service Disruption
Hardware owned 71.24% of Pick to Light market share in 2024, reflecting the capital-heavy nature of light modules, controllers, and cabling. LED miniaturization cut module power draw below 0.3 W, enabling denser bays while slashing heat output—vital for chilled environments. Software remains a smaller slice but drives differentiation through AI-based slotting algorithms and cloud dashboards. The Pick to Light market size attributable to services is projected to rise at a 12.21% CAGR, revealing buyer appetite for outcome-based contracts that shift operational risk to vendors.
Service packages now bundle remote health monitoring with 24/7 spare-part lockers staged at customer sites, guaranteeing two-hour module swap times. Predictive analytics flag button-press anomalies that correlate with impending LED failure, enabling replacements before downtime occurs. Managed-service models let vendors retain asset ownership, invoicing per successfully shipped order rather than component counts, realigning incentives around uptime and accuracy. Customers leverage these opex structures to avoid balance-sheet liabilities, smoothing earnings volatility tied to peak-season capex surges.


By Installation Type: Retrofit Strategies Drive Expansion
Retrofits accounted for 65.42% of Pick to Light market revenue in 2024, as most warehouses modernize incremental zones instead of funding new construction. Wireless deployments compress installation schedules from twelve weeks to fourteen days, allowing facilities to remain operational while bays are upgraded aisle-by-aisle. The Pick to Light market size for greenfield builds grows at an 11.45% CAGR, buoyed by pure-play e-commerce firms erecting mega-fulfillment centers with ceiling heights exceeding 40 feet and fully integrated goods-to-person robotics.
Design-phase integration in greenfields ensures bus rails, power, and data conduits are embedded in rack uprights, cutting future expansion costs by 30%. Developers increasingly add “sacrificial” mezzanine space pre-wired for light modules, ready to scale with order volume. Retrofit specialists market proprietary clip-on rails and battery-backup modules tailored to uneven shelving that dominates legacy DCs built before 2000. Payback periods remain competitive—often under 18 months—because operators avoid landlord approvals and permitting delays.
By Mounting Type: Mobile Solutions Challenge Fixed Infrastructure
Shelf-mounted arrays retained 46.42% Pick to Light market share in 2024 as the standard for high-velocity SKU lanes. Operators value their permanence and ultra-low failure rates, averaging mean-time-between-failure of 100,000 hours. Yet mobile and cart-based solutions are advancing at a 13.53% CAGR, disrupting fixed paradigms with AMR-driven pick walls that dock automatically at replenishment stations.
Mobile lights relocate with SKU slotting changes, cutting daily aisle rearrangement labor by 80%. Battery packs rated for 36-hour shifts recharge via contact pads during idle periods, ensuring continuous uptime. For pop-up fulfillment centers activated during holiday peaks, mobile systems ship inside two standard pallets and assemble tool-free within four hours, giving 3PLs a rapid-deployment edge. Traditional rack-mounted providers now retrofit caster-based frames to preserve market relevance.
By Communication and Power: Wireless Transition Accelerates
Wired BUS infrastructures still comprise 52.24% of Pick to Light market installations, favored for deterministic latency under 20 ms and immunity to RF interference. However, wireless nodes posting a 12.11% CAGR are eroding that lead by trimming installation costs 35% and enabling battery-powered modules on pallet-rack faces beyond reach of fixed conduits.
Wi-Fi 6E and private 5G backbones now guarantee sub-10 ms round-trip latency with deterministic quality of service via time-sensitive networking overlays. Energy-harvesting add-ons convert light-button presses into microjoule bursts that top off lithium-titanate cells, extending module life to five years without battery swaps. Vendors harden firmware against packet-injection attacks, meeting EU Machinery Regulation 2023/1230 cybersecurity clauses and assuaging pharmaceutical client concerns.
By End-Use Industry: Pharmaceutical Precision Drives Growth
E-commerce and retail logistics captured 28.33% Pick to Light market share in 2024 on the strength of omnichannel service-level agreements that punish mis-picks with immediate chargebacks. However, pharmaceuticals and healthcare will compound at 15.21% CAGR through 2030, propelled by serialization mandates that require unit-level traceability matched perfectly to outbound orders.
GMP-compliant facilities integrate LED modules with barcode scanners that auto-log lot, expiry, and temperature data, generating immutable audit trails. Hospitals adopt Pick to Light market carts for ward restocking, achieving 99.97% accuracy and halving clinician time spent on inventory tasks. Cold-chain drugs exploit LED low-heat output, avoiding condensation issues common with fluorescent shelf tags. Vaccination campaigns leverage mobile lights during rapid pop-up clinic deployments, ensuring dose traceability without months-long IT projects.
Geography Analysis
North America retained 38.23% of Pick to Light market revenue in 2024, benefiting from e-commerce penetration above 15% of total retail sales and well-established 3PL ecosystems. U.S. operators prioritize retrofit over rebuild, layering light strips onto 1990s-era conveyors alongside software-defined slotting upgrades. Canadian DCs focus on frozen food fulfillment where LED reliability in -25 °C freezers far outperforms LCD handhelds. Mexican maquiladoras integrate light modules at assembly stations, tying pick confirmation directly into MES platforms that feed Tier-1 automotive OEM dashboards.
Asia-Pacific will post a region-leading 14.32% CAGR to 2030 on the back of accelerated e-commerce uptake and government Industry 4.0 subsidies. China’s central Five-Year Plan earmarks tax incentives for smart logistics projects, spawning multi-story automated hubs in Shenzhen and Suzhou. Japan addresses demographic labor gaps by combining light systems with collaborative robots, keeping fulfillment centers productive as the workforce ages. India’s SAMARTH Udyog program reimburses up to 50% of automation equipment cost, catalyzing adoption among mid-tier 3PLs serving domestic grocery marketplaces. Southeast Asian exporters integrate Pick to Light market solutions within bonded warehouses to preserve duty-free status during high-mix order assembly.
Europe shows steady mid-single-digit growth, emphasizing energy efficiency and worker safety. Germany spearheads digital twin pilots that mirror light-assisted fulfillment flows to optimize slotting before physical changes occur. The United Kingdom’s chilled grocery chains replace paper picks with waterproof LED modules, sustaining 99.8% accuracy despite humidity extremes. EU cybersecurity directives push vendors toward encrypted MQTT traffic and signed firmware images, with early adopters winning pharmaceutical and aerospace contracts concerned about IP protection.

Competitive Landscape
The Pick to Light market displays moderate concentration, with the top five vendors controlling just over 45% of global revenue. Honeywell, Vanderlande, Swisslog, SSI Schaefer, and Kardex leverage long-standing WMS integrations and global service networks to defend share. Vanderlande’s October 2024 purchase of Siemens Logistics broadens its portfolio from conveyor mechanics into software-rich fulfillment suites, deepening cross-sell potential. Honeywell’s 2025 spin-off of its automation business sharpens strategic focus on AI-enhanced warehouse autonomy, illustrating an industry shift from hardware supply to data-driven orchestration.
Emerging challengers target wireless retrofits and AI optimization layers rather than trying to out-manufacture established LED hardware. U.S. startups deliver SaaS overlays that mine button-press telemetry for labor coaching insights, selling productivity gains rather than plastic modules. Patent filings concentrate on low-power radio stacks and energy-harvesting circuits, signaling where next-generation differentiation lies. Compliance expertise also becomes a wedge: vendors fluent in EU Machinery Regulation 2023/1230 cyber clauses win early among medical suppliers.
Partnership activity gains velocity. KION Group’s tie-up with NVIDIA and Accenture debuted at CES 2025, linking digital twins with AI inference at the edge to drive real-time pick sequence optimization, effectively turning light-based bays into self-learning cells. Kardex and Berkshire Grey integrate robotic picking arms with AutoStore micro-fulfillment cubes, boosting accuracy to 99.99% for cosmetics and electronics customers. With vendors racing to deliver holistic platforms, pricing leans toward subscription bundles that include hardware, software, and continuous improvement analytics.
Pick To Light Industry Leaders
Honeywell International Inc.
Dematic GmbH & Co. KG (KION Group)
Daifuku Co., Ltd.
Vanderlande Industries B.V.
SSI Schäfer IT Solutions GmbH
- *Disclaimer: Major Players sorted in no particular order

Recent Industry Developments
- February 2025: Honeywell announced intent to separate Automation and Aerospace divisions, creating Honeywell Automation to pursue AI-driven warehouse autonomy.
- January 2025: KION Group partnered with NVIDIA and Accenture to optimize supply chains via AI-powered robots and digital twins.
- October 2024: Vanderlande completed acquisition of Siemens Logistics, strengthening integrated automation portfolio.


Global Pick To Light Market Report Scope
| Hardware |
| Software |
| Services |
| Green-field |
| Retrofit / Brown-field |
| Shelf-mounted |
| Rack-mounted |
| Overhead / Hanging |
| Mobile / Cart-based |
| Wired BUS (RS-485, CAN) |
| Wireless RF / Wi-Fi |
| Power-over-Ethernet (PoE) |
| E-commerce and Retail Fulfillment Centers |
| Third-Party Logistics (3PL) and Parcel |
| Manufacturing |
| Automotive |
| Electronics |
| Food and Beverage |
| Pharmaceuticals and Healthcare |
| Apparel and Footwear |
| Other End-use Industry |
| North America | United States | |
| Canada | ||
| Mexico | ||
| Europe | Germany | |
| United Kingdom | ||
| France | ||
| Italy | ||
| Spain | ||
| Netherlands | ||
| Russia | ||
| Rest of Europe | ||
| Asia-Pacific | China | |
| Japan | ||
| India | ||
| South Korea | ||
| Australia and New Zealand | ||
| ASEAN | ||
| Rest of Asia-Pacific | ||
| Middle East and Africa | Middle East | Saudi Arabia |
| United Arab Emirates | ||
| Turkey | ||
| Rest of Middle East | ||
| Africa | South Africa | |
| Nigeria | ||
| Egypt | ||
| Rest of Africa | ||
| South America | Brazil | |
| Argentina | ||
| Rest of South America | ||
| By Component | Hardware | ||
| Software | |||
| Services | |||
| By Installation Type | Green-field | ||
| Retrofit / Brown-field | |||
| By Mounting Type | Shelf-mounted | ||
| Rack-mounted | |||
| Overhead / Hanging | |||
| Mobile / Cart-based | |||
| By Communication and Power | Wired BUS (RS-485, CAN) | ||
| Wireless RF / Wi-Fi | |||
| Power-over-Ethernet (PoE) | |||
| By End-Use Industry | E-commerce and Retail Fulfillment Centers | ||
| Third-Party Logistics (3PL) and Parcel | |||
| Manufacturing | |||
| Automotive | |||
| Electronics | |||
| Food and Beverage | |||
| Pharmaceuticals and Healthcare | |||
| Apparel and Footwear | |||
| Other End-use Industry | |||
| By Geography | North America | United States | |
| Canada | |||
| Mexico | |||
| Europe | Germany | ||
| United Kingdom | |||
| France | |||
| Italy | |||
| Spain | |||
| Netherlands | |||
| Russia | |||
| Rest of Europe | |||
| Asia-Pacific | China | ||
| Japan | |||
| India | |||
| South Korea | |||
| Australia and New Zealand | |||
| ASEAN | |||
| Rest of Asia-Pacific | |||
| Middle East and Africa | Middle East | Saudi Arabia | |
| United Arab Emirates | |||
| Turkey | |||
| Rest of Middle East | |||
| Africa | South Africa | ||
| Nigeria | |||
| Egypt | |||
| Rest of Africa | |||
| South America | Brazil | ||
| Argentina | |||
| Rest of South America | |||


Key Questions Answered in the Report
What is the projected value of the Pick to Light market by 2030?
The Pick to Light market is forecast to reach USD 1.01 billion by 2030, reflecting a 10.28% CAGR from 2025.
Which region is growing fastest in adopting Pick to Light systems?
Asia-Pacific is expected to post a 14.32% CAGR through 2030, outpacing all other regions.
Why are retrofit installations more common than greenfield projects?
Retrofit installations let operators upgrade existing facilities without costly rebuilds, accounting for 65.42% of 2024 revenue.
Which end-use sector shows the highest future growth?
Pharmaceuticals and healthcare will grow at a 15.21% CAGR as compliance and accuracy demands intensify.
How are wireless technologies changing Pick to Light deployments?
Wireless nodes lower installation costs by 35% and enable battery-powered modules, driving a 12.11% CAGR for the segment.
What impact does labor shortage have on Pick to Light adoption?
Labor scarcity pushes companies to deploy light-directed systems that let existing staff handle up to 30% more order lines per hour.
Page last updated on:


