Market Overview
| Study Period | 2021 - 2031 |
|---|---|
| Forecast Data Period | 2026 - 2031 |
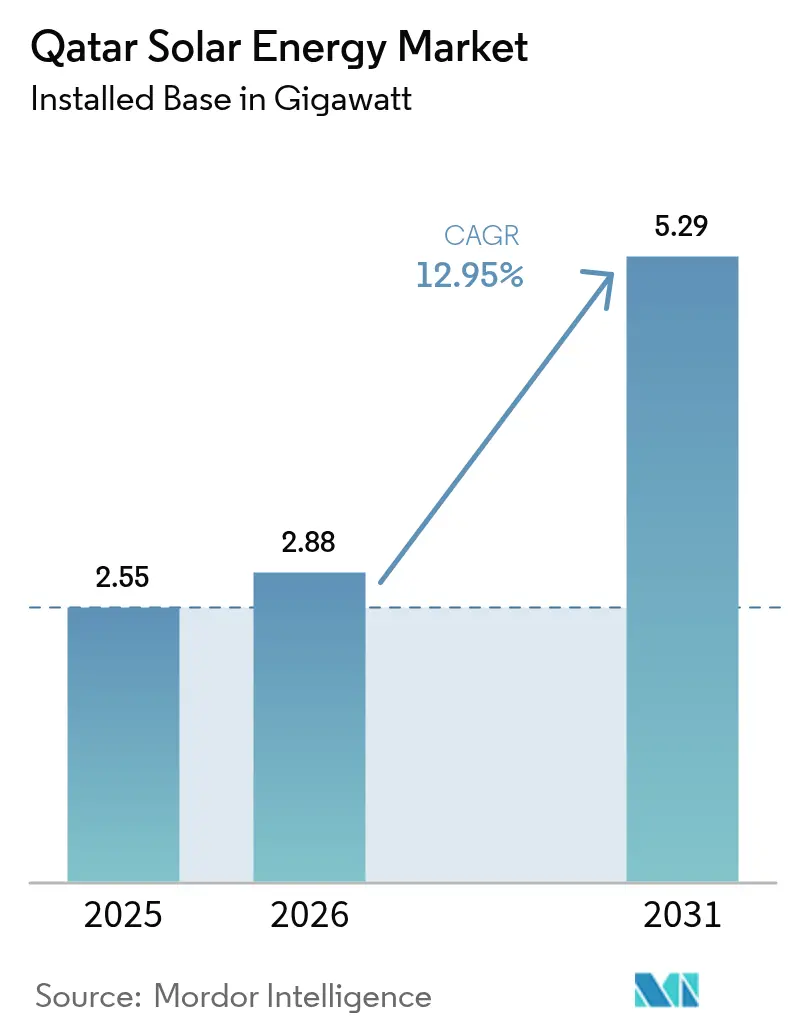
| Base Year Market Size (2025) | 2.55 gigawatt |
| Market Volume (2026) | 2.88 gigawatt |
| Market Volume (2031) | 5.29 gigawatt |
| Growth Rate (2026 - 2031) | 12.95% CAGR |
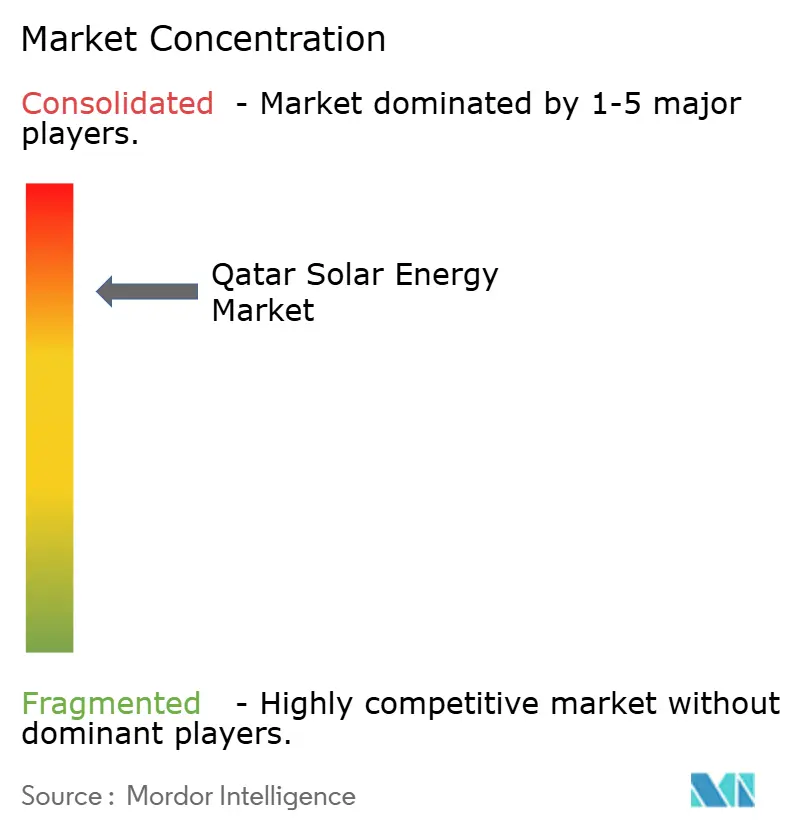
| Market Concentration | High |
Major Players *Disclaimer: Major Players sorted in no particular order Image © Mordor Intelligence. Reuse requires attribution under CC BY 4.0. | |
Qatar Solar Energy Market Analysis by Mordor Intelligence
The Qatar Solar Energy Market size was valued at 2.55 gigawatt in 2025 and estimated to grow from 2.88 gigawatt in 2026 to reach 5.29 gigawatt by 2031, at a CAGR of 12.95% during the forecast period (2026-2031).
Natural gas supplied 99.72% of Qatar’s electricity in 2024, yet the National Renewable Energy Strategy targets an 18% renewable-capacity share by decade-end.[1]KAHRAMAA, “Electricity Statistics 2024,” km.qa Rising solar irradiance utilization, state-backed procurement, and liquefied natural gas (LNG) decarbonization demand are propelling the Qatar Solar Energy market. Falling module prices, growing industrial offtake, and an expanding International Finance Corporation lending pipeline improve project economics. However, grid‐flexibility limits, elevated site-preparation costs, and soiling-related operating expenses temper growth prospects.
Key Report Takeaways
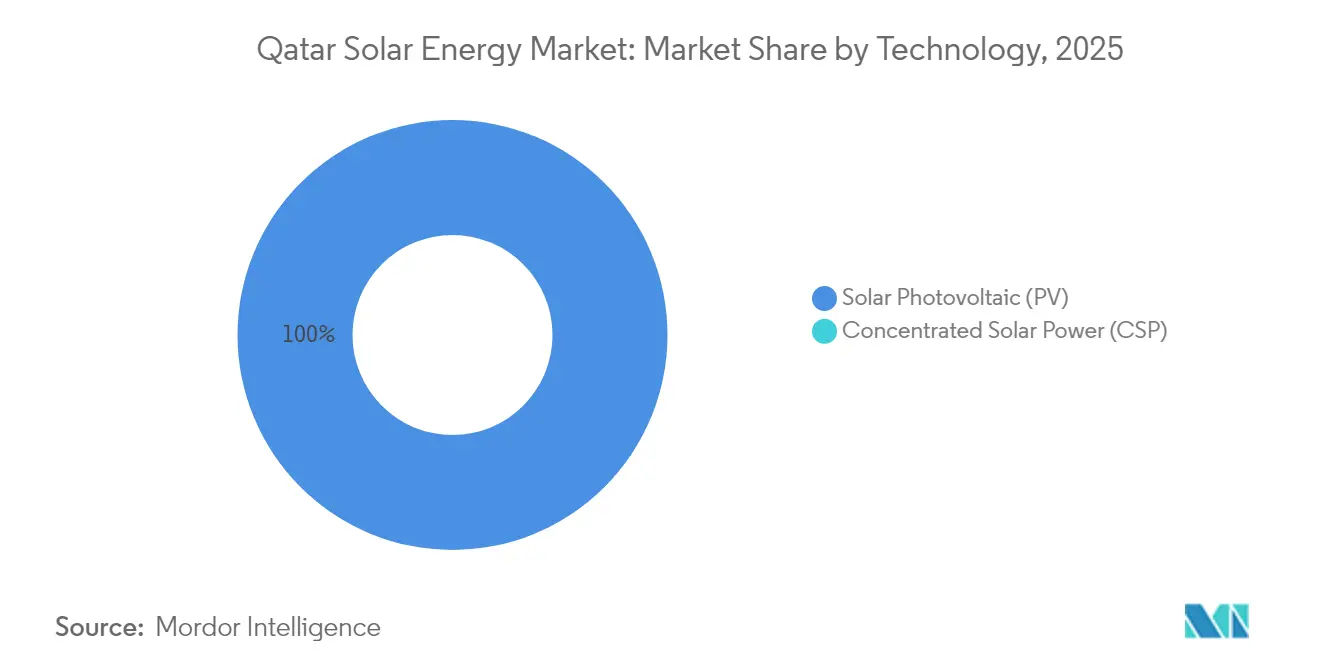
- By technology, solar photovoltaic held 100.00 of % Qatar Solar Energy market share in 2025.
- By grid type, on-grid installations captured 91.60% of the Qatar Solar Energy market size in 2025, while off-grid is forecast to register a 22.00% CAGR through 2031.
- By end-user, utility-scale plants commanded 88.80% of the Qatar Solar Energy market size in 2025, and the residential segment is advancing at a 26.10% CAGR to 2031.
- QatarEnergy, Siraj Energy, and Nebras Power together controlled more than 95% of installed utility-scale capacity in 2024.
Note: Market size and forecast figures in this report are generated using Mordor Intelligence’s proprietary estimation framework, updated with the latest available data and insights as of 2026.
Qatar Solar Energy Market Trends and Insights
Drivers Impact Analysis*
| Driver | (~) % Impact on CAGR Forecast | Geographic Relevance | Impact Timeline |
|---|---|---|---|
| National renewable-energy target (20% electricity from solar by 2030) | 3.0% | National, with spillover to GCC grid via 3 GW interconnection capacity | Long term (≥4 years) |
| High solar irradiance and desert climate enabling high capacity factors | 1.8% | National, with comparative advantage over lower-irradiance GCC markets | Long term (≥4 years) |
| Declining PV module and balance-of-system costs | 2.2% | Global cost trends applied nationally; Qatar benefits from international module price competition | Medium term (2-4 years) |
| Large-scale tender programme (Al Kharsaah and follow-on IPPs) | 2.8% | National, concentrated in Al Kharsaah, Ras Laffan, Mesaieed, Dukhan zones | Short term (≤2 years) |
| FIFA World Cup 2022 sustainability legacy boosting rooftop demand | 0.7% | National, with early uptake in Doha metro, industrial zones, and commercial districts | Medium term (2-4 years) |
| LNG and industrial decarbonisation demand for solar-powered process heat | 1.9% | National, focused on North Field East/South LNG facilities and Ras Laffan Industrial City | Long term (≥4 years) |
| Source: Mordor Intelligence | |||
National Renewable-Energy Target Catalyzes Utility Plants
Qatar’s 4 GW utility-scale mandate requires 460 MW of annual additions, more than double the 2019-2024 average.[2]QatarEnergy, “National Renewable Energy Strategy,” qatarenergy.qa The target codifies centralized procurement, letting Siraj Energy front-load capacity so the 2 GW Dukhan project aligns with the North Field LNG expansion. Direct linkage between solar build-out and industrial decarbonization secures internal offtake, reduces permitting risk, and shields LNG exports from carbon-border policies. The policy thus accelerates the Qatar Solar Energy market while mitigating demand risk.
High Solar Irradiance Unlocks Tracker Economics
Global Horizontal Irradiance averages 2,140 kWh/m², and tests show that bifacial modules on single-axis trackers lift annual yield by 14% versus fixed tilt.[3]ScienceDirect, “Solar Module Soiling Studies in Qatar,” sciencedirect.com The 875 MW Mesaieed-Ras Laffan complex uses TrinaTracker Vanguard 2P units to harvest diffuse albedo and sustain 24-26% capacity factors.[4]TrinaTracker, “Vanguard 2P Deployment in Qatar,” trinatracker.com Low cloud cover and light-colored terrain further improve output, reinforcing tracker adoption as a baseline specification in new tenders.
Module-Cost Deflation Improves Economics Despite EPC Premiums
Average module prices slid to USD 0.11/W in 2024, a 40% drop from 2022, enabling Qatar projects to source JA Solar DeepBlue 3.0 panels at USD 0.13-0.15/W. Countervailing forces, desert site preparation, a thin EPC field, and bespoke power-purchase agreements keep installed costs 20-25% above Saudi benchmarks. Even so, lower hardware prices narrow levelized-cost gaps and sustain investment in the Qatar Solar Energy market.
Large-Scale Tender Program Concentrates Capacity Near LNG Hubs
Al Kharsaah (800 MW), Mesaieed-Ras Laffan (875 MW), and Dukhan (2 GW) co-locate generation with liquefaction and petrochemical loads, minimizing transmission losses. Siraj Energy’s majority ownership streamlines land access and permits but caps private equity stakes. Multilateral lenders have nonetheless financed recent projects, signaling confidence in state credit strength.
Restraints Impact Analysis*
| Restraint | (~) % Impact on CAGR Forecast | Geographic Relevance | Impact Timeline |
|---|---|---|---|
| Grid-integration constraints and limited flexible generation | -1.3% | National, with GCC interconnection providing partial relief; System Control coordination required per KAHRAMAA Safety Rules | Short term (≤2 years) |
| Land-use conflicts and sand-condition site-preparation costs | -0.4% | National, affecting greenfield desert sites; permitting and foundation engineering for sand substrates | Medium term (2-4 years) |
| High soiling rates raising O&M and water-use expenses | -1.0% | National, with regional parallels across GCC arid zones; QEERI testing protocols inform mitigation strategies | Short term (≤2 years) |
| Import dependence for PV equipment amid supply-chain disruptions | -0.7% | Global supply chains (China, Southeast Asia) to Qatar; port logistics and container-cost volatility affect delivered module prices | Short term (≤2 years) |
| Source: Mordor Intelligence | |||
Grid-Integration Limits Slow Distributed Rollout
Kahramaa’s lone 1 MW/4 MWh battery pilot underscores a storage gap that must reach 2 GW/8 GWh to absorb 4 GW of solar by 2030.[5]KAHRAMAA, “Battery Pilot Project,” km.qa Combined-cycle gas plants ramp slowly, pushing curtailment higher during off-peak demand. Net-billing credits below retail tariffs suppress rooftop economics, while a lack of ancillary-service markets stifles battery returns, restraining the Qatar Solar Energy market’s distributed segment.
High Soiling Rates Elevate O&M Costs
Dust accumulation cuts output by up to 15% monthly without frequent cleaning. Robotic systems reduce labor but add USD 15,000-25,000 per MW of capex, and water for manual washing costs USD 0.50-0.70/m³. Small rooftop owners lack scale for automation, extending payback from 6-8 to 8-10 years, thereby slowing residential adoption.
*Our forecasts treat driver/restraint impacts as directional, not additive. The impact forecasts reflect baseline growth, mix effects, and variable interactions.
Segment Analysis
By Technology: PV Dominance Continues
PV held the full Qatar Solar Energy market share in 2025 and is forecast to expand at a 12.95% CAGR. CSP remains absent because its USD 3.5-4.5/W capex and high water intensity outweigh dispatchability advantages in a gas-rich system. Utility-scale bifacial projects using 1,500 V string inverters record 24-26% capacity factors, while rooftop arrays rely on simpler fixed-tilt designs. Qatar Solar Energy market size for utility PV is scheduled to double once the Dukhan plant commissions, whereas CSP has no announced pipeline.
Utility plants gain from near-zero land rents and long-term offtake by QatarEnergy, yet they face site-grading and fence costs unknown in rocky Gulf neighbors. Distributed PV must rise from 9 MW to 1.2 GW to meet policy targets, an acceleration that hinges on standardized permits and third-party ownership models. Qatar Solar Energy market share for PV thus holds steady as technology choices converge on high-efficiency heterojunction and TOPCon modules supplied via Qatar Solar Technologies’ local polysilicon output.


By Grid Type: Off-Grid Growth Outpaces On-Grid
On-grid assets claimed 91.60% of Qatar Solar Energy market share in 2025. Off-grid systems serving oil fields and telecom towers are forecast to grow at a 22.00% CAGR through 2031. Diesel displacement economics dominate: 500 kW PV-battery hybrids cut levelized energy costs to USD 0.18-0.22/kWh against USD 0.28-0.35/kWh for standalone diesel. The Qatar Solar Energy market size for on-grid projects will spike when the 2 GW Dukhan facility connects, yet substation upgrades and bidirectional metering remain prerequisites. Off-grid installations sidestep these constraints, explaining their faster relative growth.
The BeSolar net-billing rate of QAR 0.237/kWh underpins limited residential adoption, but remote industrial actors value lower fuel logistics and emissions reductions. Cumulative off-grid additions of 130-150 MW by 2030 are realistic given current tender pipelines and battery-price declines.
By End-User: Residential Segment Accelerates from a Low Base
Utility-scale plants supplied 88.80% of Qatar's Solar Energy market size in 2025. The residential segment, although starting at only 9 MW, is expected to climb at a 26.10% CAGR. Villa owners with unshaded roofs realize six-year paybacks under net-billing. Nevertheless, widespread renting, landlord-tenant split incentives, and bundled utility charges curb addressable demand. Commercial and industrial rooftops are positioned to shoulder most of the 1.2 GW distributed-solar target, provided Kahramaa finalizes streamlined interconnection rules in 2026.
Utility-scale momentum is anchored by Siraj Energy's pipeline, which adds capacity in large tranches. The Dukhan project alone will lift utility-scale Qatar Solar Energy market share past 90% again in 2029 before distributed growth narrows the gap in the early 2030s.

Geography Analysis
Installed capacity clusters along a 100 km corridor linking Ras Laffan, Mesaieed, and Dukhan. Ras Laffan’s 458 MW plant offsets LNG liquefaction demand, Mesaieed’s 417 MW array powers petrochemicals, and the upcoming 2 GW Dukhan site will integrate with enhanced-oil-recovery steam generation. Doha hosts little utility solar because of land scarcity, yet its rooftops offer 200-300 MW of technical potential under the distributed-solar target.
Per-capita solar capacity is on track to reach 1.5 kW by 2030, matching the UAE and surpassing Saudi Arabia. While Qatar’s absolute 4 GW goal is modest versus regional peers, its industrial-clustering model prioritizes direct decarbonization of LNG and petrochemical operations. Western desert lands remain untapped pending transmission expansion. QatarEnergy’s recent 50% stake in a 1.25 GW Basra solar project signals geographic diversification, mirroring its cross-border LNG investments.
Regulatory Landscape
Qatar’s solar market framework is anchored by the Qatar National Renewable Energy Strategy (QNRES), launched by KAHRAMAA in April 2024. The strategy sets a 4 GW utility-scale renewable capacity program by 2030 and targets an 18% share of renewables in the electricity mix. KAHRAMAA acts as the primary sector authority for renewable integration across the transmission and distribution network, with policy direction supported by the Qatar National Renewable Energy Policy, which calls for periodic review of power-mix targets.
For distributed PV, KAHRAMAA introduced the BeSolar service in August 2024, formalizing a net-billing pathway for customer-sited systems. Grid interconnection is governed through KAHRAMAA-issued technical documents and consumer connection guidelines, including the EP-EPP-P7-S1 technical specifications for PV connection to the network. These requirements shape equipment, protection, metering, and contractor compliance for on-grid rooftop and small commercial installations.
Competitive Landscape
The Qatar Solar Energy market is moderately concentrated. QatarEnergy, through Siraj Energy, holds direct or majority stakes in every utility-scale project, while Nebras Power manages overseas renewable assets. Samsung C&T and QEMC dominate engineering contracts; LONGi, JA Solar, and Trina supply ≥95% of modules. International developers lack full project-development rights, limiting tariff competition but providing secure volumes for EPC and equipment firms.
Distributed solar remains fragmented among 15-20 small installers, none exceeding 2 MW in annual deployments. Multilateral lenders fund large plants on the strength of sovereign backing. Robotic-cleaning vendors and microgrid integrators are emerging niches. As policy unlocks rooftop aggregation, global third-party ownership platforms could capture significant white space.
Qatar Solar Energy Industry Leaders
Qatar Solar Technologies
Total Energies SE
Marubeni Corp
Siraj Energy
Nebras Power QSC
- *Disclaimer: Major Players sorted in no particular order

Market Opportunities and Future Outlook
Implementation of QNRES concentrates near-term whitespace in grid-enabling works and integration services needed to absorb multi-gigawatt utility additions, especially around the 2 GW Dukhan buildout and the Ras Laffan and Mesaieed industrial corridor. KAHRAMAA’s June 2026 presentation of a 2030 roadmap to the Shura Council, focused on expanding renewables alongside transmission and distribution modernization, points to continued demand for substations, high-voltage cabling, protection and control upgrades, and utility-grade forecasting and dispatch tools designed to handle solar intermittency.
On the demand side, QNRES targets for distributed generation, together with BeSolar net-billing, support commercial and industrial rooftop portfolios and aggregation models that standardize permitting, engineering, and O&M. Experience from the 800 MW Al Kharsaah plant and the 875 MW Ras Laffan and Mesaieed plants also points to performance-linked O&M offerings in desert conditions, including soiling mitigation, robotic cleaning, and water-optimized maintenance. At the same time, opportunities extend to hybridization and grid services that address the flexibility constraints highlighted by KAHRAMAA’s early battery pilot activity.
Recent Industry Developments
- June 2026: KAHRAMAA awarded contracts exceeding QAR 2.2 billion to Voltage Engineering Ltd., Best & Betas Consortium, Larsen & Toubro, and LS Cable for electricity network expansion and grid-connection infrastructure tied to the 2 GW Dukhan Solar Power Project. The package strengthens the transmission and distribution backbone needed to evacuate large utility-scale solar output and reduces an execution bottleneck for the next capacity tranche.
- September 2025: QatarEnergy signed an engineering, procurement, and construction agreement with Samsung C&T for the 2 GW Dukhan solar power plant planned in two phases. The award formalized the delivery path for the largest upcoming solar build in the country and reinforces EPC and supply-chain alignment around centralized procurement.
- April 2024: KAHRAMAA launched the Qatar National Renewable Energy Strategy (QNRES), setting out the national program to raise renewables to 18% of the electricity mix by 2030 and to deploy multi-gigawatt utility-scale capacity. The strategy provides the policy umbrella for follow-on tenders and for scaling distributed solar through standardized rules and services.


Research Methodology Framework and Report Scope
Market Definition and Coverage
For this study, the Qatar solar energy market is defined as solar power capacity added and operating in the country across grid connected and off grid installations, captured as installed capacity in gigawatts.
Scope exclusions: Solar electricity retail tariffs and broader power generation fuels outside solar are excluded from this market sizing.
Segmentation Overview
- By Technology
- Solar Photovoltaic (PV)
- Concentrated Solar Power (CSP)
- By Grid Type
- On-Grid
- Off-Grid
- By End-User
- Utility-Scale
- Commercial and Industrial (C&I)
- Residential
- By Component (Qualitative Analysis)
- Solar Modules/Panels
- Inverters (String, Central, Micro)
- Mounting and Tracking Systems
- Balance-of-System and Electricals
- Energy Storage and Hybrid Integration
Data Sources, Market Sizing, and Validation
Desk Research
Desk research was used to build the fact base on Qatar electricity demand trends, grid expansion progress, and the renewable policy direction that affects how solar projects are awarded. We relied on public sources such as Qatar General Electricity and Water Corporation (Kahramaa) releases, national energy strategy publications, International Renewable Energy Agency datasets, International Energy Agency indicators, and open project disclosures from utilities and developers.
To translate policy goals into a practical demand pool, we also reviewed customs and trade statistics where available, peer reviewed papers on solar performance in desert climates, and reputable press coverage of project milestones and tender outcomes. A paid subscription covering company financials and another covering patents were used selectively to cross-check business scale signals and technology adoption where public disclosures were thin. The desk sources listed here are illustrative, and we also used other public references for collection, clarification, and validation.
Primary Interviews and Surveys
Primary work focused on project developers, EPC participants, equipment distributors, O&M contractors, and large electricity consumers that may adopt rooftop or C&I systems. Interviews were used to confirm the live project pipeline, the typical capacity ranges by site type, realistic execution timelines, and how grid connection constraints can shift commissioning dates in specific locations.
Distribution of primary research fieldwork respondents
| Company type | Respondent position | Region |
|---|---|---|
| Top tier: 37% | CXOs: 16% | |
| Mid tier: 47% | Functional/Unit leaders: 27% | |
| Smaller Players: 16% | Managers: 57% |
Market-Sizing & Forecasting
Sizing is anchored in a top-down capacity build, where national targets, utility tender awards, and grid connection progress were used to reconstruct yearly installed GW additions and the running base. The outputs were then checked using selective bottom-up approximations, mainly by rolling up a sample of announced project capacities, EPC award capacity totals, and capacity-weighted checks on typical module and inverter needs per MW to see if the implied build is technically consistent.
Key inputs used in the model include the utility-scale project pipeline and commissioning dates, grid connection and evacuation readiness, solar resource and expected capacity factors, the split between utility-scale and C&I rooftop adoption, and policy signals such as renewable targets and procurement rounds. Where project data was incomplete, gaps were handled by applying conservative time lags and probability weights that were reviewed with primary respondents. Forecasts were built using scenario analysis around award timing and execution risk, and then the scenario selected was aligned to the consensus view shared by local market experts.
Data Validation & Update Cycle
Results were triangulated across independent signals such as announced capacity, commissioning updates, and the implied pace of yearly additions versus grid readiness. Any outliers, for example a step change in capacity without matching project milestones, were flagged and re-checked through follow-up calls and additional document review before sign-off.
The model and narrative go through a multi-step analyst review so assumptions and unit conversions stay consistent across years. Reports are refreshed annually, and interim updates are triggered when there is a material tender, a major commissioning, or a policy change that can shift the near-term build. Before delivery, a final pass is completed to reflect the latest public announcements and primary confirmations.
Mordor Intelligence's Qatar Solar Energy Market Size Measured Against Other Published Estimates
Published estimates for Qatar solar often differ because some sources size revenue while others size installed capacity, and the inclusion rules around storage, hybrid plants, and distributed systems can vary. Differences also show up when the base year is set to a policy target year instead of the latest commissioned capacity.
Battery storage revenue bundled into solar projects sits outside Mordor Intelligence's scope, which keeps the estimate tied to installed solar capacity (GW) rather than project EPC or equipment sales value that can swing with pricing and contracting structures.
Benchmark comparison
| Source | Market Size | Gaps in Research Methodology |
|---|---|---|
| Mordor Intelligence | USD 2.55 B (2025) | |
| Regional Consultancy A | USD 1.00 B (2023) | Uses a value-based definition in USD and mixes revenue and volume discussion, which can understate the market versus a capacity-led view when EPC and equipment pricing is treated conservatively in the base year. |
| Industry Publisher B | USD 3.02 B (2025) | Presents solar as a value market and can implicitly bundle adjacent project elements across PV and CSP, which may inflate totals when storage or hybrid integration is counted as solar market value. |
The spread mainly comes from whether the market is measured in installed GW or in USD value tied to project and equipment spending. By keeping the model anchored to commissioned and pipeline capacity checks, and then validating timelines through interviews, the estimate stays traceable to clear build-out drivers and repeatable steps.


Key Questions Answered in the Report
How fast is installed solar capacity growing in Qatar?
Capacity is rising from 2.55 GW in 2025 to 5.29 GW by 2031, reflecting a 12.95% CAGR supported by state-backed tenders.
Which technology dominates new deployments?
Solar photovoltaic accounts for 100.00% of current capacity, with no concentrated-solar-power projects announced.
What role does LNG play in shaping solar demand?
Solar electricity offsets the carbon footprint of LNG liquefaction, making renewables an operational input for QatarEnergy.
Why is rooftop adoption still limited?
High renter ratios, bundled utility bills, and a net-billing rate below retail tariffs curb residential investment despite technical roof potential.
Where will the next major solar plant be built?
The 2 GW Dukhan facility, scheduled for 2029, will be co-located with oil-field infrastructure in western Qatar.
Which firms supply most utility-scale modules?
LONGi, JA Solar, and Trina Solar supply an estimated 95% of modules thanks to cost advantages and proven bifacial technology.
Page last updated on:


