
Market Overview
| Study Period | 2020 - 2031 |
|---|---|
| Forecast Data Period | 2026 - 2031 |
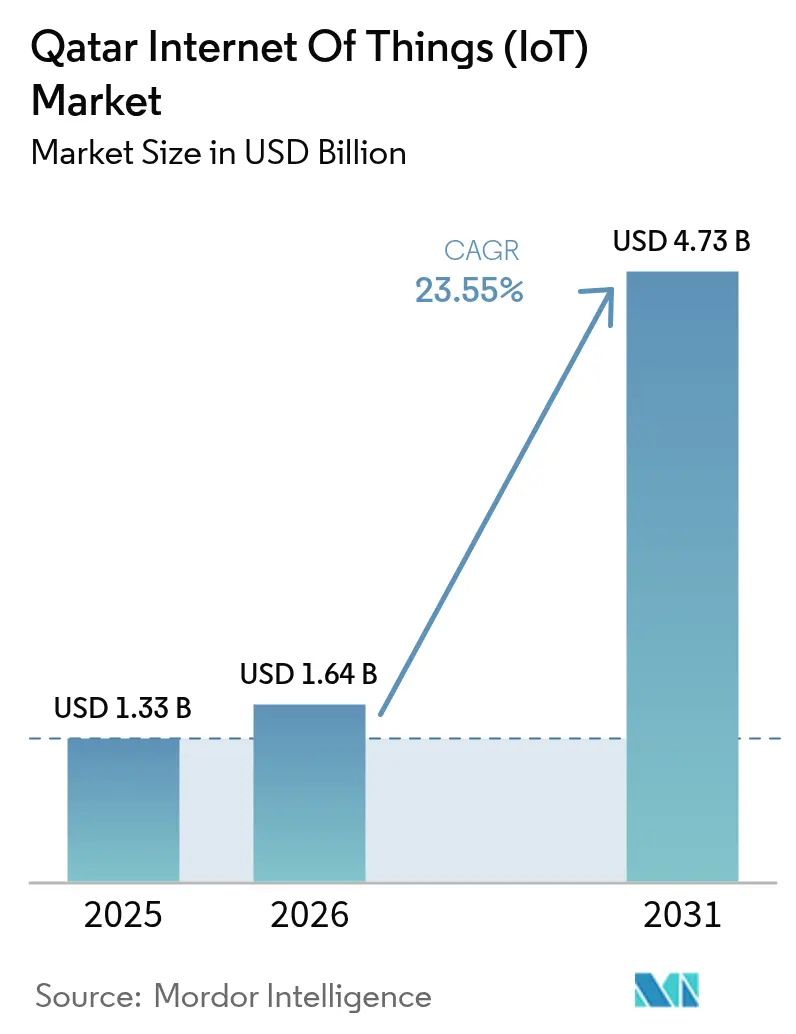
| Base Year Market Size (2025) | USD 1.33 Billion |
| Market Size (2026) | USD 1.64 Billion |
| Market Size (2031) | USD 4.73 Billion |
| Growth Rate (2026 - 2031) | 23.55 % |
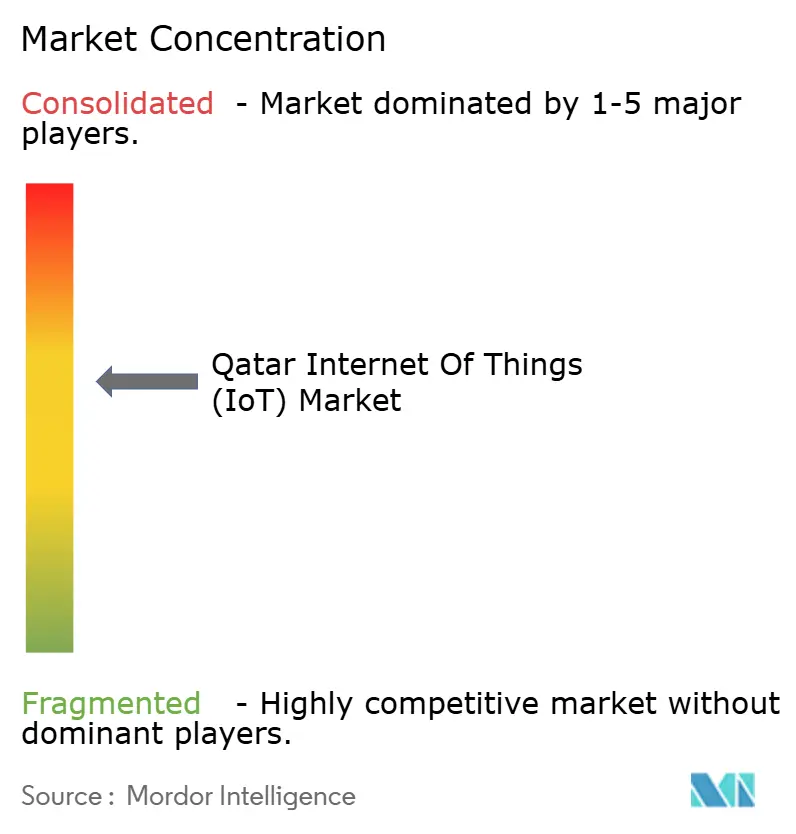
| Market Concentration | Medium |
Major Players *Disclaimer: Major Players sorted in no particular order Image © Mordor Intelligence. Reuse requires attribution under CC BY 4.0. | |
Qatar Internet Of Things (IoT) Market Analysis by Mordor Intelligence
The Qatar Internet Of Things (IoT) market size is expected to grow from USD 1.33 billion in 2025 to USD 1.64 billion in 2026 and is forecast to reach USD 4.73 billion by 2031 at 23.55% CAGR over 2026-2031. Persistent public-sector digitalisation under the Tasmu Smart Qatar program, a nationwide 5G footprint, and large-scale LNG industrial upgrades keep capital expenditure on connected devices elevated. Continuous infrastructure investments—including a USD 22.2 billion five-year plan that prioritises smart water management—create further demand for sensor networks. Ultra-high 5G median down-load speeds topping 666 Mbps foster low-latency use cases in autonomous mobility and mission-critical energy operations. At the same time, strict data-sovereignty rules are pushing enterprises toward localised edge-cloud deployments, reinforcing spending on secure IoT platforms. Qatar’s commitment to generate 13,000 technology jobs by 2030 under the National Digital Agenda bolsters a domestic services ecosystem that scales implementations across industries[1]Government Communications Office, “National Digital Agenda 2030,” gco.gov.qa.
Key Report Takeaways
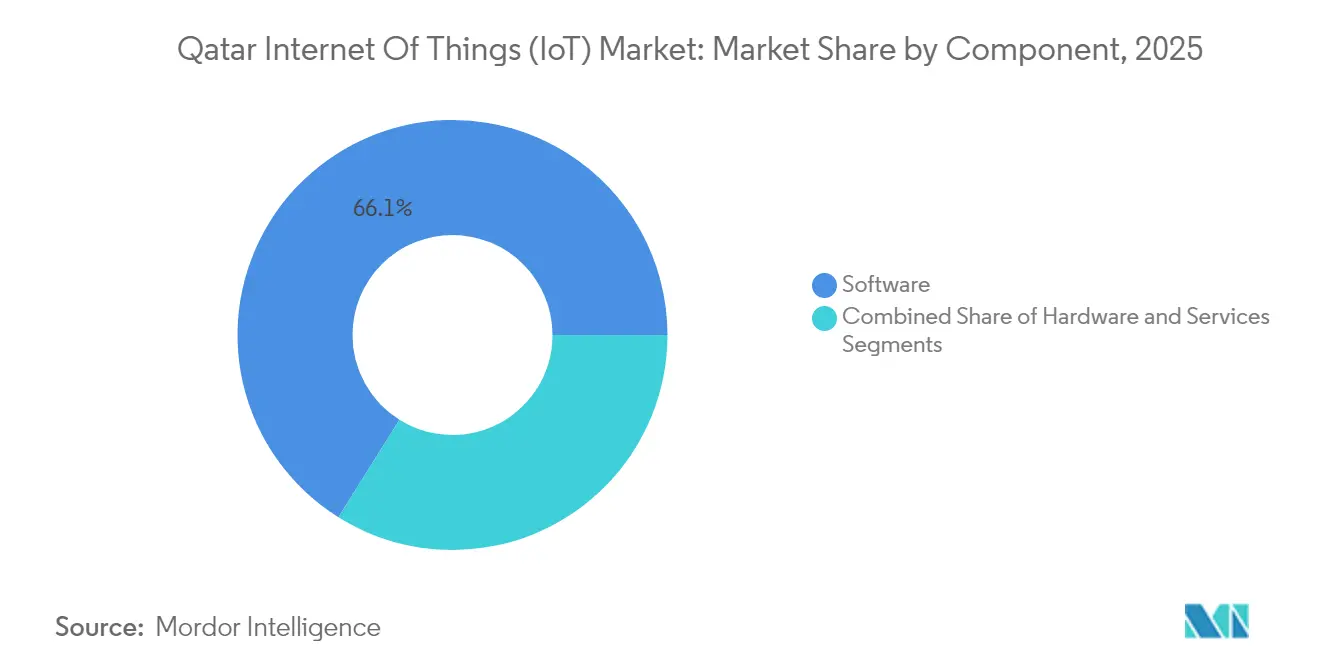
- By component, software led with a 66.10% revenue share in 2025; services are projected to grow at a 25.3% CAGR through 2031.
- By connectivity technology, NB-IoT/LTE-M held 40.65% share in 2025, while 5G SA/Private 5G is set to expand at 25.1% CAGR to 2031.
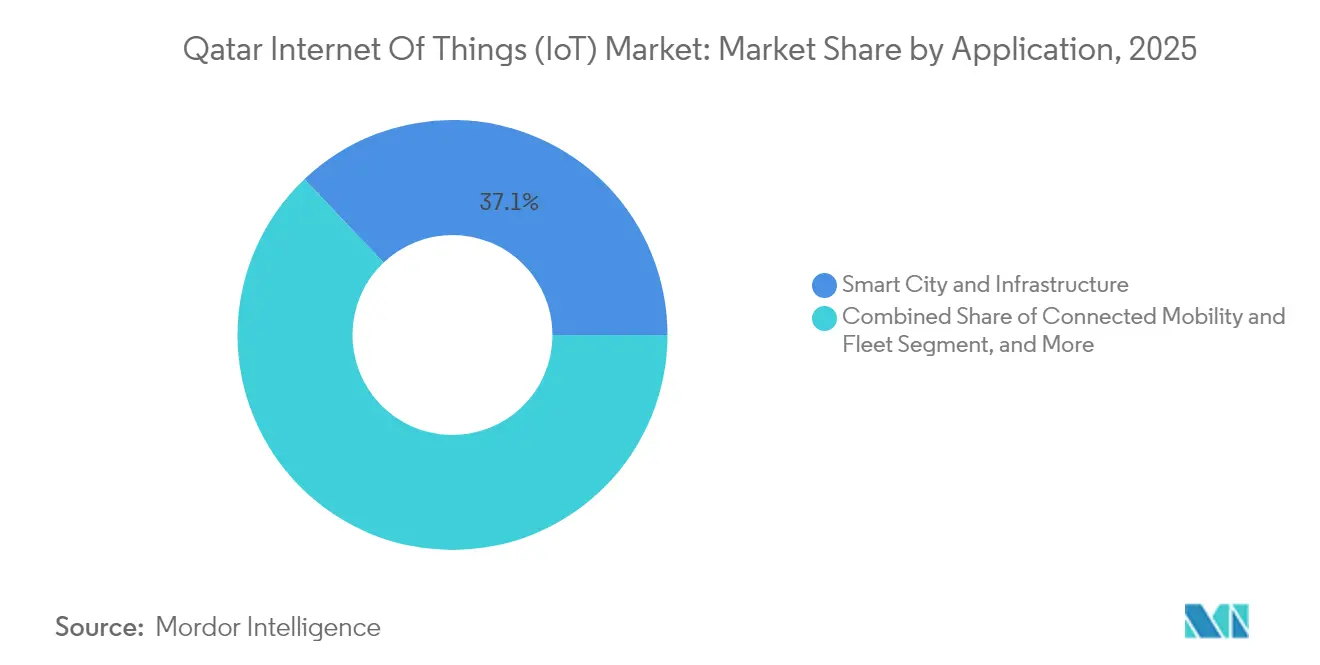
- By application, smart city and infrastructure captured 37.10% of the Qatar IoT market share in 2025; smart manufacturing is advancing at a 24.8% CAGR through 2031.
- By end-user vertical, manufacturing commanded 35.60% of the Qatar IoT market size in 2025, whereas transport and logistics is forecast to rise at 24.1% CAGR over 2026-2031.
Note: Market size and forecast figures in this report are generated using Mordor Intelligence’s proprietary estimation framework, updated with the latest available data and insights as of 2026.
Qatar Internet Of Things (IoT) Market Trends and Insights
Drivers Impact Analysis*
| Driver | (~) % Impact on CAGR Forecast | Geographic Relevance | Impact Timeline |
|---|---|---|---|
| Tasmu Smart Qatar and NDA 2030 digital-government roadmap | +6.2% | National, Doha and Al Rayyan | Long term (≥ 4 years) |
| Nation-wide 5G and NB-IoT roll-outs by Ooredoo and Vodafone | +4.8% | National coverage | Medium term (2-4 years) |
| Smart-city and FIFA-legacy infrastructure deployments | +3.5% | Doha, Al Rayyan, Al Wakrah | Medium term (2-4 years) |
| Rising disposable income fuelling smart-home uptake | +2.1% | Urban centres | Short term (≤ 2 years) |
| Mandatory smart-metering by Kahramaa in water and power grids | +2.8% | National grid | Medium term (2-4 years) |
| Industrial digitalisation of LNG mega-expansion projects | +4.1% | Ras Laffan and Al Khor | Long term (≥ 4 years) |
| Source: Mordor Intelligence | |||


Tasmu Smart Qatar and NDA 2030 Digital-Government Roadmap
Tasmu accelerates e-government, targeting 90% service digitalisation by 2030[2]US International Trade Administration, “Qatar – Information and Communications Technology,” trade.gov. The initiative has already launched an accelerator that on-boards 25 international start-ups, linking them with ministries for proof-of-concept pilots. Economic models anticipate QAR 40 billion in gross value added from these projects, amplifying fiscal headroom for connected infrastructure. Inter-agency data exchange creates a baseline demand for secure IoT gateways and analytics platforms that unify diverse sensor feeds. As the program aligns with the Third National Development Strategy, every ministry mandates interoperability standards that favour open APIs and modular architectures, further boosting the Qatar IoT market.
Nation-wide 5G and NB-IoT Roll-outs by Ooredoo and Vodafone
Ooredoo commercialised 5G in 2018 and now records peak rates of 35.46 Gbps on 3.5 GHz spectrum, enabling dense device connectivity. Vodafone is modernising its core network with cloud-native software from Nokia, unlocking features such as network slicing for enterprise SLAs. Regulatory plans to sunset 3G by December 2025 free spectrum for NB-IoT layers, delivering cost-efficient coverage for utility metering. Device density projections exceed 1 million links per square kilometre in Doha’s central districts, catalysing mass-scale sensor roll-outs. Competitive pressure between the two carriers ensures ongoing throughput upgrades, stabilising quality of service for mission-critical verticals.
Smart-city and FIFA-legacy Infrastructure Deployments
World-Cup venues adopted INTALEQ’s Connected Stadiums Platform that integrates crowd analytics, predictive maintenance, and energy optimisation. Lusail City now runs real-time adaptive signal control across 100 intersections, cutting travel times by 30%. Energy City Qatar installed 320 Zigbee-enabled smart poles that reduce street-lighting electricity use by 37%. These proven blueprints are replicated in Al Rayyan and Al Wakrah, creating economies of scale for vendors. Stadium IoT assets remain operational for concerts and conferences, ensuring long-term utilisation and revenue streams.
Rising Disposable Income Fuelling Smart-home Uptake
Projected national GDP growth of 5.5% through 2026 lifts household purchasing power, while zero personal income tax increases discretionary spending. Vodafone’s GigaHome fibre service offers 1 Gbps for QAR 299 per month, providing bandwidth headroom for multi-device environments. Qatar’s Digital Identity app seamlessly authenticates smart-lock access, simplifying user experiences. Cultural receptivity to technology, coupled with government rebates for energy-efficient appliances, underpins accelerated shipment of smart thermostats and security kits. Combined, these elements raise the residential share of the Qatar IoT market.
Restraints Impact Analysis*
| Restraint | (~) % Impact on CAGR Forecast | Geographic Relevance | Impact Timeline |
|---|---|---|---|
| Shortage of local IoT-cybersecurity and AI talent pool | -3.2% | National | Medium term (2-4 years) |
| Data-sovereignty and cybersecurity compliance hurdles | -2.1% | National | Short term (≤ 2 years) |
| High expatriate-labour churn hindering long-term O&M | -1.8% | Doha and industrial zones | Medium term (2-4 years) |
| Dependence on imported IoT hardware and chips | -1.4% | National | Long term (≥ 4 years) |
| Source: Mordor Intelligence | |||
Shortage of Local IoT-Cybersecurity and AI Talent Pool
Sixty-one percent of CIOs cite skills gaps in cloud and ML as a primary obstacle to scaled roll-outs. Expatriates fill 95% of ICT roles, but visa renewals every two years trigger attrition that erodes institutional memory. Monthly salaries exceeding QAR 45,000 for senior architects are competitive in the Gulf yet still trail packages in North America, causing outbound migration. The state has earmarked 13,000 new digital jobs by 2030; however, university enrolment in data science remains modest. The National Cyber Security Academy’s bootcamps will help, but the near-term pipeline stays thin.
Data-sovereignty and Cybersecurity Compliance Hurdles
The Personal Data Privacy Protection Law requires local hosting for sensitive datasets, raising capital costs for small integrators. A USD 150,000 fine levied on a QFC-licensed fintech for breach reporting delays underscores enforcement vigour. The National Information Assurance Standard obliges rigorous pen-testing and encryption audits before go-live, extending project timelines. AI-enabled IoT systems must also conform to emerging ethics rules, complicating algorithm deployment. Together, these mandates can push proof-of-concept costs beyond budget thresholds for SMEs.
*Our forecasts treat driver/restraint impacts as directional, not additive. The impact forecasts reflect baseline growth, mix effects, and variable interactions.
Segment Analysis
By Component: Software Dominance Drives Integration
The Qatar IoT market size for software reached USD 0.88 billion in 2025, equal to 66.10% of total revenue. Project pipelines for analytics dashboards and AI-enabled orchestration engines remain robust as public agencies demand unified command centres. System optimisation budgets thus shift toward licences, APIs, and maintenance contracts, reinforcing software’s grip. Managed services will deliver a 25.3% CAGR across 2026-2031 as enterprises outsource device lifecycle management, cybersecurity, and cloud hosting. Meanwhile, hardware purchases continue but grow at a slower clip, curbed by standardisation that elongates refresh cycles.
Software supremacy springs from Qatar’s data-driven governance model, where ministries seek real-time insights to benchmark public-service KPIs. Projects such as the Scale AI collaboration showcase the pivot toward predictive analytics for queue management and resource allocation. The services boom reflects a move from proof-of-concept to full production, compelling firms to engage integrators with multi-vendor skill sets. Hardware demand stays underpinned by LNG facility build-outs and smart-meter deployments, although bulk procurement agreements keep per-unit margins thin.


By Connectivity Technology: NB-IoT Leadership with 5G Acceleration
NB-IoT/LTE-M held 40.65% of 2025 revenue, anchored by national utility and street-lighting projects. The technology excels in deep indoor coverage and low-power operation, ideal for metering and environmental sensing. The 5G SA/Private 5G slice is the fastest-rising, projected at 25.1% CAGR, thanks to industrial mandates for deterministic latency under 10 ms in LNG liquefaction control loops. Wi-Fi 6/7 and Bluetooth dominate residential and commercial smart-building niches, while satellite LPWAN supports asset tracking along desert highways.
The Qatar IoT market relies on NB-IoT for cost-efficient mass deployment, particularly across 1.2 million electricity and water meters planned before 2029. Ooredoo’s Ericsson mediation upgrade adds billing granularity that translates payload volume into new revenue models. Private 5G proofs at Ras Laffan show 40% faster fault-diagnosis versus legacy Wi-Fi. Satellite LPWAN deals with Thuraya extend coverage to pipeline rights-of-way, and Wi-Fi 7 pilots in Doha’s high-rise offices provide sub-2 ms latency for immersive telepresence.
By Application: Smart Cities Lead, Manufacturing Surges
Smart city and infrastructure deployments generated 37.10% of 2025 turnover, confirming Qatar’s status as a global smart-urban lab. Transit optimisation, intelligent lighting, and connected waste-collection top municipal procurement lists. Smart manufacturing will post the highest CAGR at 24.8% as factories adopt predictive quality and digital twins to meet export standards. Energy, utilities, connected mobility, and smart homes collectively broaden the use-case matrix and hedge macro-sector risk.
Doha’s UNESCO Learning City recognition incentivises further spend on civic technology, from AI parking systems to real-time air-quality dashboards, entrenching its first-mover advantage. The smart manufacturing vertical gains traction through QDB’s Factory One accelerator, where 15 SMEs embedded IoT modules that cut defect rates by 22%. Connected mobility benefits from Lusail’s multi-modal MaaS platform, recording 50,000 daily micro-mobility trips. Distributed energy resources rely on IoT-enabled smart inverters to balance rooftop solar with grid supply, dovetailing with Kahramaa’s renewable goals.
By End-user Vertical: Manufacturing Leads, Transport Accelerates
Manufacturing retained a 35.60% slice of 2025 revenue, buoyed by LNG trains, petrochemicals, and advanced materials plants. Deployments emphasise condition-based maintenance and emissions monitoring to satisfy ESG disclosures. Transport and logistics is poised for a 24.1% CAGR as smart-port expansions, e-commerce fulfilment hubs, and fleet telematics scale. Home-building automation, power utilities, and government e-services round out adoption, ensuring a diversified revenue funnel.
ThingWorx roll-outs in a Doha steel mill improved overall equipment effectiveness by 160%, eliminating USD 2 million in capex for new lines. Qatar’s Al Khor Road integrates 200 ITS gantries that relay traffic data every 30 seconds, cutting accident response times by 18%. Government e-services such as the Hukoomi portal now plug directly into IoT feeds for queue management at public clinics, while utilities integrate smart valves that curtail non-revenue water.
Geography Analysis
Doha remains the nucleus of the Qatar IoT market with 23.75% revenue share in 2025, underpinned by advanced telecom back-bones, a critical mass of blue-chip headquarters, and international tech conferences that funnel venture capital The Peninsula. The municipality’s integrated command centre synthesises feeds from traffic cameras, smart poles, and energy meters, improving incident response times by 40% on key arterials. Siemens Navigator deployment across 200 commercial towers cut combined electricity and water usage by 30%, illustrating the scalable paybacks that entice private landlords Gulf Times. Doha’s convergence of fibre and nationwide 5G ensures under-20 ms round-trip latency, enabling cloud gaming, AR, and drone surveillance services that elevate consumer expectations. Continued hosting of flagship events—Web Summit 2025 and the Qatar Economic Forum—keeps the spotlight on pilot funding, while the Qatar Science and Technology Park offers subsidised labs for start-ups, creating a self-reinforcing innovation loop.
Al Rayyan posts the fastest growth at 23.9% CAGR to 2031, propelled by green-field real-estate projects that bake connectivity into early design stages. The Education City campus integrates more than 15,000 BLE beacons for indoor navigation and facility management, providing a template for smart university roll-outs across the Gulf. The municipality’s new mass-transit corridors host sensorised bus shelters that collect weather and passenger flow data, refining route scheduling algorithms. Residential districts adopt district cooling equipped with smart metering, cutting carbon footprints and unlocking utility cost savings for developers. Government incentives streamline permitting for private 5G networks in industrial parks, permitting factories to install real-time quality-control cameras and AGVs.
Al Wakrah, Al Khor, Umm Salal, Al Daayen, Al Shahaniya, and Al Shamal contribute the remaining share of the Qatar IoT market. Al Khor leverages the USD 2 billion Al Khor Road project, whose 200 smart gantries gather telemetry for AI-driven traffic guidance AUDI. Ras Laffan Industrial City feeds vibration, pressure, and temperature data to a central operations centre, lowering unplanned downtime in LNG trains. Al Wakrah’s smart fishing-harbour initiative tags 12,000 mesh sensors to monitor catch quality, water salinity, and vessel positions. Northern municipalities deploy IoT solutions for water-table monitoring and livestock management, ensuring balanced regional development in line with Qatar National Vision 2030. Qatar National Broadband Network’s back-haul ring guarantees 1 Gbps symmetrical speeds in all municipalities, erasing connectivity disparities and widening the addressable device base.
Regulatory Landscape
Qatar's IoT and M2M regulatory direction is anchored by the Communications Regulatory Authority (CRA), which published the final Position Paper on IoT and M2M in May 2025 after an earlier public consultation in 2024. The Position Paper points to a largely light-touch approach for services, including class-licensing options discussed, while tightening the technical gatekeeping that affects market access.
On compliance, the CRA requires IoT and M2M devices sold or used in Qatar to complete a dedicated Type Approval process, which is particularly material for imported modules, gateways, and RF-enabled end devices. The framework references international baselines such as ETSI TS 103 306 (M2M identification requirements) and ITU-T Y.2066 (common IoT requirements), and ties identifier management to the National Numbering Plan and Numbering Regulation, shaping how providers allocate and govern IoT identifiers at scale.
Value Chain Analysis
The Qatar IoT value chain starts with imported devices, modules, and sensors (cellular and short-range), then moves into connectivity provisioning from national operators, notably Ooredoo and Vodafone Qatar, across 5G, NB-IoT, and LTE-M. Satellite connectivity also extends reach for remote assets. Platform and software layers focus on device management, data ingestion, analytics, and security controls, supplied by global vendors and local platforms, and then implemented by systems integrators and specialized local players such as IoT-Shabaka, often alongside telco-managed offerings.
Demand is pulled through public programs and regulated utilities. MCIT initiatives, including Tasmu Smart Qatar and the Tasmu platform, along with Kahramaa initiatives (including Tarsheed), function as recurring anchors that shift deployments from pilots into multi-site roll-outs. Governance and enablement are shaped by the CRA, covering Type Approval and the IoT/M2M framework direction, as well as by MCIT's IoT Adoption Policy draft under consultation with a stated close on January 16, 2026, which influences procurement requirements around interoperability, security, and data handling, increasing the value of local hosting and in-country delivery partners.
Competitive Landscape
Global platform vendors, regional telcos, and home-grown innovators shape a moderately fragmented Qatar IoT market. Cisco, Huawei, Siemens, and Ericsson anchor infrastructure and orchestration layers, leveraging long-standing relationships with ministries and operators. Ooredoo’s USD 1 billion deal with Nvidia provisions GPUs across 26 data centres, positioning the telco as a regional AI inference hub and raising the compute intensity of IoT analytics. Microsoft maintains three availability zones in the country, supporting low-latency edge services that comply with strict data-sovereignty laws. Huawei perseveres amid geopolitical scrutiny, retaining share through turnkey campus networks that bundle Wi-Fi 6 access points and cloud management dashboards.
Local differentiation emerges in verticalised platforms such as Qatar Mobility Innovations Centre’s Labeeb, which offers Arabic-language SDKs and on-premises deployment options tailored to public-sector compliance mandates. Quantiphi’s AI engineering hub in the Free Zones delivers computer-vision pipelines for manufacturing defect detection, reducing project lead times by 30%. Ooredoo and Vodafone compete on private 5G SLAs, with bundled cybersecurity and device-management add-ons aimed at industrial customers. Nokia’s dual win for standalone cores at both operators locks in a multi-year software revenue stream and underlines its strategic hold on packet core evolution.
Competitive intensity rises as global cloud leaders enter the managed-edge space, offering pay-as-you-go models that undercut traditional licence fees. Yet domain expertise and Arabic-localised interfaces give domestic players an edge in public tenders. White-space opportunities persist in niche LPWAN services for agriculture and offshore asset monitoring, where satellite back-haul remains dominant. Overall, the top five players account for nearly 55% of platform and integration spending, keeping the market contestable for niche specialists that target compliance consulting or vertical dashboards.
Qatar Internet Of Things (IoT) Industry Leaders
Ooredoo Q.P.S.C
Vodafone Qatar P.Q.S.C
Cisco Systems Inc.
Huawei Technologies Co. Ltd
Labeeb IoT (QMIC)
- *Disclaimer: Major Players sorted in no particular order

Market Opportunities and Future Outlook
A near-term opportunity is in security-first, operator-packaged IoT that reduces deployment friction for enterprises working under data-sovereignty and assurance requirements. Ooredoo's May 2026 launch of IoT SecureConnect (Zero Trust for IoT devices) highlights demand for bundled device identity, posture checks, and policy enforcement, creating whitespace for providers that can combine connectivity, device lifecycle management, and compliance-aligned security validation for government, utilities, and industrial accounts.
At the solution level, smart-city scale deployments and LPWAN expansion continue to open addressable use cases for asset tracking, facilities optimization, and metering. The February 2026 partnership between Ooredoo Qatar and Msheireb Properties to integrate more than 650,000 IoT sensors into Msheireb Downtown Doha shows how sensor networks and analytics platforms are moving into large-scale operations, while Ooredoo's April 2026 LTE-M commercial launch supports massive IoT roll-outs that need low-power wide-area coverage. These actions reinforce opportunities for localized edge analytics, Arabic-localized dashboards, and multi-vendor integration services that align with CRA technical approval requirements and MCIT-led interoperability direction.
Recent Industry Developments
- May 2026: Ooredoo Qatar launched IoT SecureConnect, an operator-led Zero Trust security solution for connected IoT devices. The offering strengthens device-level verification and policy controls, supporting enterprise deployments where security assurance and data privacy are procurement-critical requirements.
- April 2026: Ooredoo Qatar announced the commercial launch of LTE-M (CAT-M1) network technology in Qatar for large-scale IoT applications. The rollout expands LPWAN options beyond NB-IoT for use cases such as asset tracking and smart infrastructure, and helps operators package connectivity plus management for massive IoT estates.
- February 2025: Qatar government signed a five-year agreement with Scale AI to infuse AI into more than 50 public-service workflows across predictive analytics and automation. The program strengthens demand for IoT-linked data pipelines and analytics platforms as ministries standardize operational decisioning using sensor and service data.


Research Methodology Framework and Report Scope
Market Definition and Coverage
For this methodology, the market covers spending in Qatar on IoT solutions that connect devices and sensors to networks and software so data can be collected, transmitted, and used in operations.
Scope exclusions: We exclude basic consumer electronics that are not connected for monitored use cases, and we also exclude pure telecom access revenues unless they are priced as IoT connectivity.
Segmentation Overview
- By Component
- Hardware
- Software
- Services
- By Connectivity Technology
- 5G SA / Private 5G
- NB-IoT / LTE-M
- Wi-Fi 6/7 and Bluetooth
- LPWAN
- Others
- By Application
- Smart Manufacturing
- Smart City and Infrastructure
- Smart Energy and Utilities
- Connected Mobility and Fleet
- Smart Home and Consumer IoT
- By End-user Vertical
- Manufacturing
- Transport and Logistics
- Home and Building Automation
- Power and Utilities
- Government / Smart-City
Data Sources, Market Sizing, and Validation
Desk Research
Desk research was used to set the Qatar context and to build practical demand signals for connected deployments. We reviewed public materials such as Ministry of Communications and Information Technology and Tasmu program releases, International Telecommunication Union indicators for connectivity readiness, GSMA publications on mobile networks, and World Bank macro series to anchor GDP and investment cycles.
Along with this, we checked deployment and procurement signals through sources such as company annual reports and investor presentations, reputable local and international press, and peer reviewed and technical publications that describe NB-IoT, LTE-M, and private 5G activity in the region. Where helpful, paid database subscriptions were used in a limited way for company financials and for patent activity screening so the model assumptions could be cross-checked. The desk sources named here are illustrative and not exhaustive, and additional public references were also used to collect, validate, and clarify data points.
Primary Interviews and Surveys
Primary work was used to confirm what is actually being deployed in Qatar and how budgets split across devices, platforms, connectivity, and services. We spoke with telecom led IoT teams, system integrators, solution developers, and enterprise users, covering utilities, transport, smart buildings, and industrial sites. Their input was used to finalize adoption assumptions and pricing ranges used in the forecast.
Distribution of primary research fieldwork respondents
| Company type | Respondent position |
|---|---|
| Top tier: 39% | CXOs: 15% |
| Mid tier: 40% | Functional/Unit leaders: 26% |
| Smaller Players: 21% | Managers: 59% |
Market-Sizing & Forecasting
The market size was built using a top-down and bottom-up mix, where connectivity and digital infrastructure signals were translated into an IoT demand pool and then filtered through realistic adoption by industry use cases in Qatar. Totals were corroborated with selective bottom-up approximations, such as sampled deployments by use case and indicative ASP times device counts, and then adjusted where the implied values did not align with interview feedback.
Key inputs in the model include the presence of NB-IoT and LTE-M, 5G and private network rollout momentum, smart city program activity, industrial modernization signals in energy and utilities, and the pace of connected building projects. Forecasts were developed using scenario analysis, where adoption rates and ASP progression were tested under a base case and sensitivity cases, and then aligned to what interviewees expected for procurement timing and rollout constraints. Where the public record was thin on smaller deployments, gaps were handled through conservative proxies tied to similar use cases and contract patterns observed in the country.
Data Validation & Update Cycle
Outputs were checked against independent signals, such as implied connected endpoint counts, typical service attach rates, and whether the mix of connectivity and platform spend matched how deployments are contracted in Qatar. Anomalies were reviewed by another analyst, and any large variance from expected adoption patterns triggered follow-up outreach to reconfirm assumptions.
The report is refreshed annually, with interim updates when material events occur, such as major smart city awards, new spectrum or security guidance, or step changes in enterprise 5G availability. Before delivery, we complete a fresh review pass so the final numbers reflect the latest public developments and validated interview inputs.
Mordor Intelligence's Qatar Internet of Things IOT Market Size Measured Against Other Published Estimates
It is common to see different IoT market values for Qatar because the scope can shift between device and platform spend versus broader digital services, and because some estimates treat connectivity revenue in different ways. Differences also come from the year selected as the anchor, the exchange rate timing, and whether smart city programs are counted as committed spend or only as realized deployments.
The biggest gaps typically show up when one model uses a narrow definition that focuses on connectivity led revenue, while another folds in a wider bundle like smart city services, analytics, and adjacent ICT projects. When the split between IoT connectivity and general mobile data is validated through operator offer checks and project level timing, the totals stay closer to what is being deployed on the ground, a check applied by Mordor Intelligence.
Benchmark comparison
| Source | Market Size | Gaps in Research Methodology |
|---|---|---|
| Mordor Intelligence | USD 1.33 B (2025) | |
| Government Program Portal A | USD 0.61 B (2022) | This figure is anchored to an earlier year and is presented as a broad market snapshot, so later platform and services expansion tied to newer rollout cycles can be understated. |
| Local Business Press B | USD 1.30 B (2024) | This estimate is communicated as sector revenue and is typically closer to near term realized spending, which can miss multi year project ramp ups and differences in what is counted as IoT solution value. |
The spread in values is mainly explained by the base year selected and whether the model counts only realized sector revenue versus deployments that are scaling across industries. By keeping the inputs tied to rollout timing, adoption signals, and repeatable pricing ranges, the final total remains traceable across updates.


Key Questions Answered in the Report
What is the current value of the Qatar IoT market?
The Qatar IoT market stands at USD 1.64 billion in 2026 and is projected to reach USD 4.73 billion by 2031.
Which component segment leads revenue generation?
Software leads with 66.10% of 2025 revenue, reflecting demand for analytics platforms and AI-driven orchestration.
How fast is smart manufacturing growing within the market?
Smart manufacturing is forecast to expand at a 24.8% CAGR through 2031, the fastest among all application categories.
Why is Al Rayyan the fastest growing municipality?
Green-field urban projects that embed IoT at the design stage and robust transport links to Doha drive a 23.9% CAGR in Al Rayyan.
What are the main regulatory challenges for IoT deployments in Qatar?
Strict data-sovereignty and cybersecurity compliance requirements under the Personal Data Privacy Protection Law add cost and complexity, particularly for SMEs.
Which connectivity technology has the largest installed base?
NB-IoT/LTE-M captures 40.65% market share in 2025, primarily through smart-meter and street-lighting deployments.
Page last updated on:





