
Pyrophyllite Market Size and Share
Market Overview
| Study Period | 2021 - 2031 |
|---|---|
| Market Volume (2026) | 802.81 kilotons |
| Market Volume (2031) | 891.16 kilotons |
| Growth Rate (2026 - 2031) | 2.11 % |
| Fastest Growing Market | Asia Pacific |
| Largest Market | Asia Pacific |
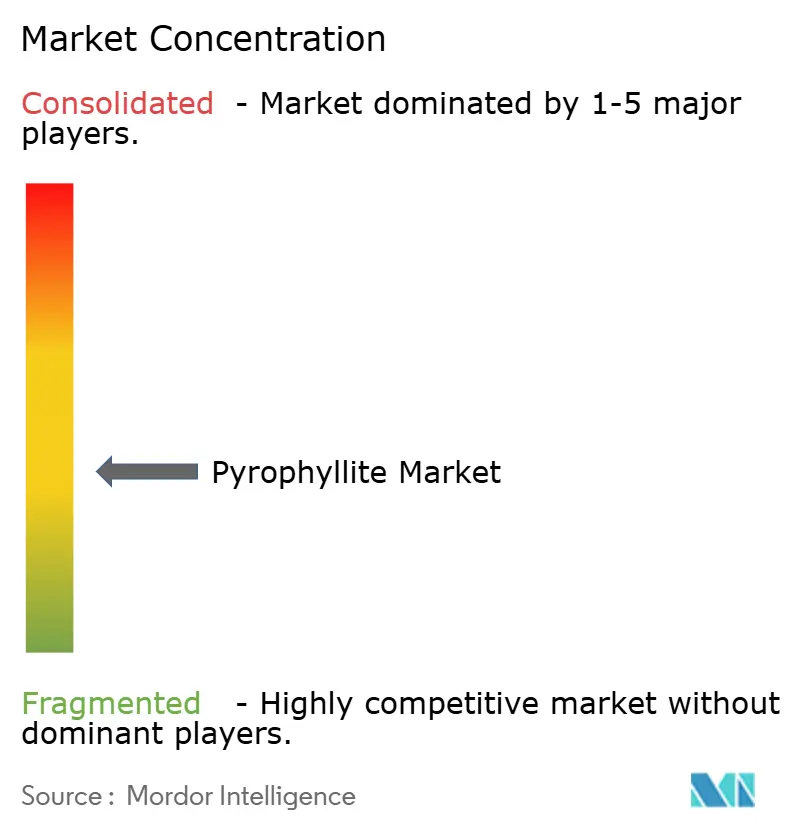
| Market Concentration | Medium |
Major Players
*Disclaimer: Major Players sorted in no particular order Image © Mordor Intelligence. Reuse requires attribution under CC BY 4.0. |
|
Pyrophyllite Market Analysis by Mordor Intelligence
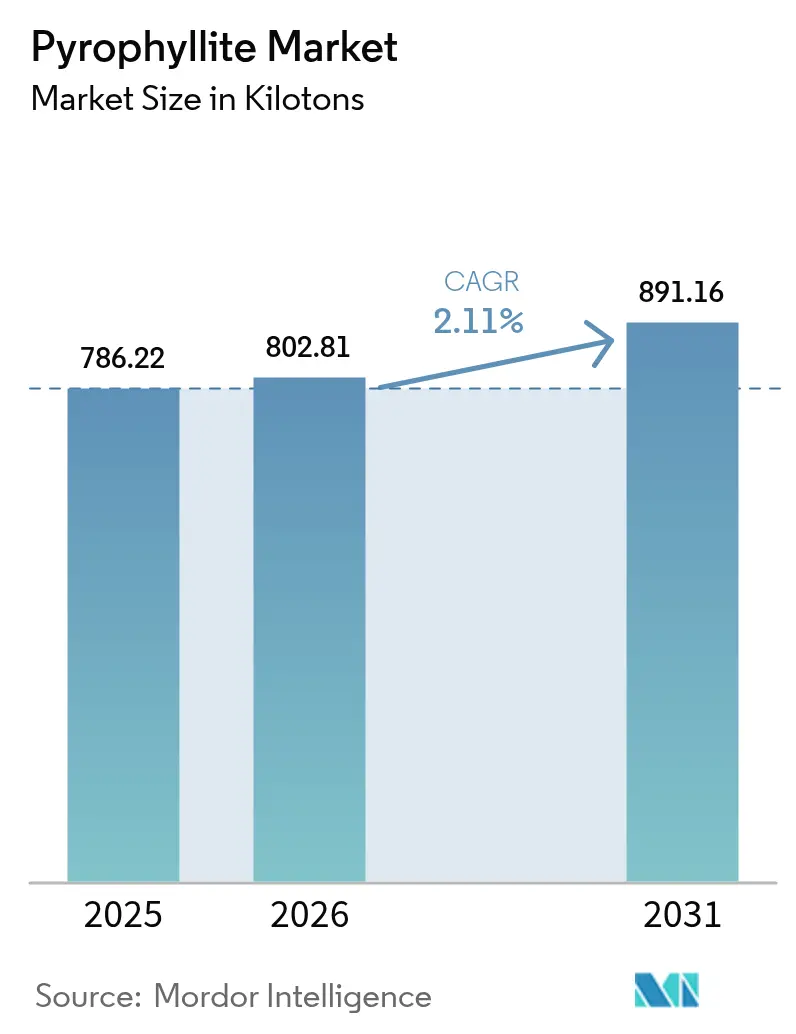
The Pyrophyllite Market size is expected to increase from 786.22 kilotons in 2025 to 802.81 kilotons in 2026 and reach 891.16 kilotons by 2031, growing at a CAGR of 2.11% over 2026-2031. Asia-Pacific holds three-quarters of global demand, electric-arc steelmaking now channels almost half of output into refractory blends, and battery as well as cosmetics producers are paying premiums for low-iron, high-alumina concentrates. Integrated refractory groups are securing captive ore supplies, while battery-separator innovators reward processors that can deliver <0.05% Fe₂O₃ feedstocks. Substitution pressure from talc, kaolin, and feldspar curbs margins, yet hydrogen-based furnaces and solid-state battery separators create distinct technical niches that sustain price differentials within the pyrophyllite market.
Key Report Takeaways
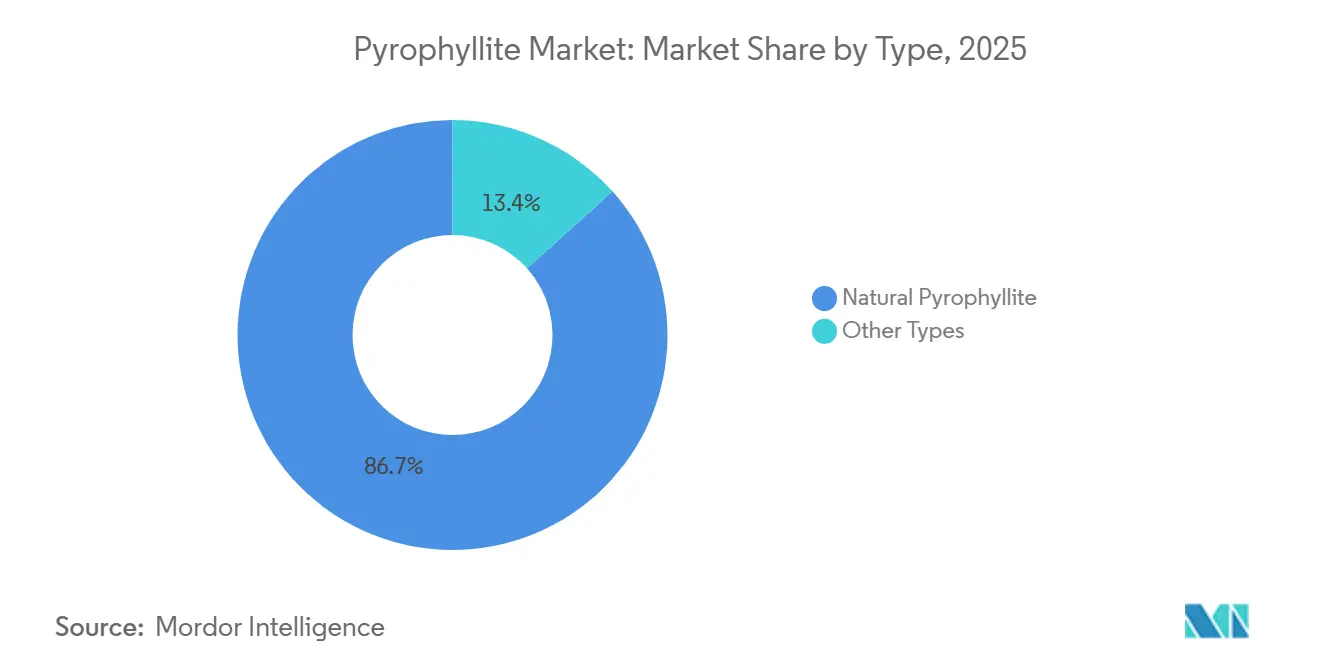
- By type, natural grades captured 86.65% of 2025 volume, while beneficiated and synthetic variants are expanding at a 2.71% CAGR through 2031.
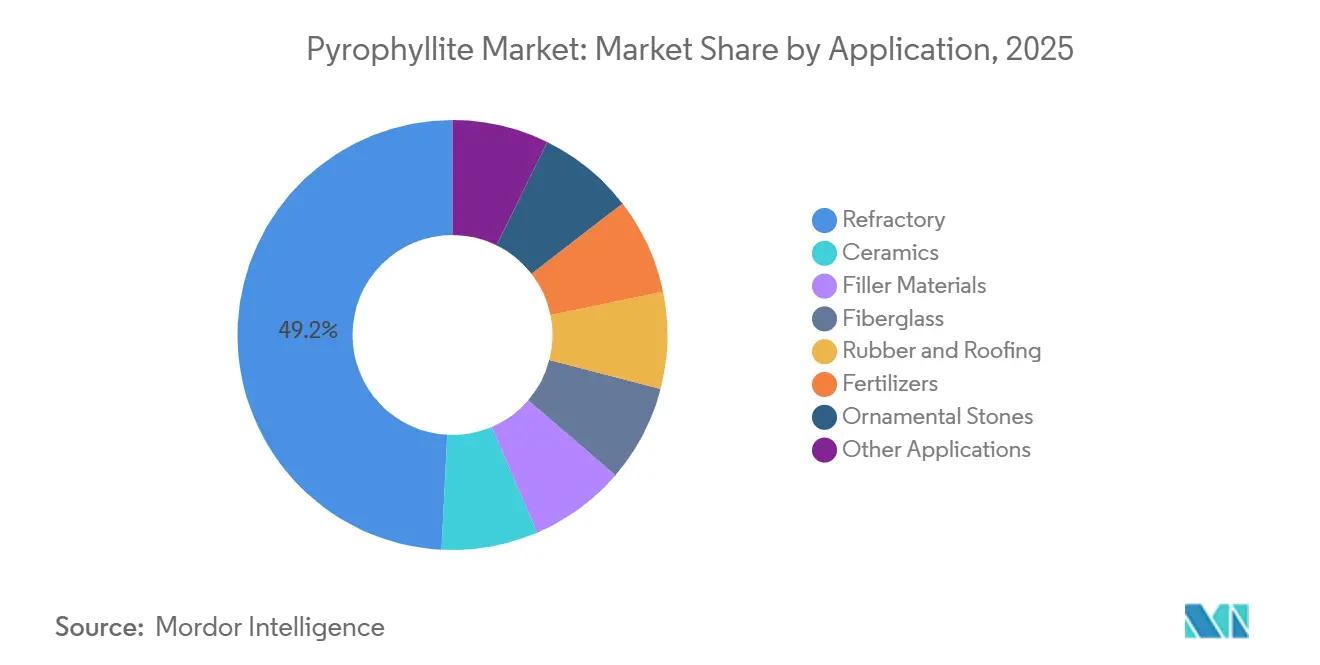
- By application, refractory material led with a 49.18% pyrophyllite market share in 2025 and is forecast to register the fastest 2.56% CAGR to 2031.
- By geography, Asia-Pacific commanded 75.62% of 2025 demand and is projected to grow at 2.78% through 2031.
Note: Market size and forecast figures in this report are generated using Mordor Intelligence’s proprietary estimation framework, updated with the latest available data and insights as of 2026.
Market Trends and Insights
Drivers Impact Analysis of Pyrophyllite Market*
| Drivers | (~) % Impact on CAGR Forecast | Geographic Relevance | Impact Timeline |
|---|---|---|---|
| Rising refractory demand in electric-arc steelmaking | +0.5% | Asia-Pacific core, spill-over to North America and Europe | Medium term (2-4 years) |
| Lightweight mineral fillers for high-build industrial coatings | +0.3% | Global, with concentration in North America and Europe | Short term (≤ 2 years) |
| Shift from talc to pyrophyllite in cosmetics amid asbestos litigation | +0.2% | North America and Europe | Short term (≤ 2 years) |
| Solid-state battery ceramic separators needing high-purity Al-Si feedstocks | +0.4% | Asia-Pacific (China, Japan, South Korea), spill-over to North America | Long term (≥ 4 years) |
| Low-alkali grades enabling hydrogen furnace refractories | +0.2% | Europe and North America, early pilots in Asia-Pacific | Long term (≥ 4 years) |
| Source: Mordor Intelligence | |||
Rising Refractory Demand in Electric-Arc Steelmaking
Electric-arc furnaces displace blast-oxygen routes because they cut direct CO₂ emissions and accept 100% scrap feedstocks. Every heat subjects refractories to 1,600 °C thermal shock, so tap-hole, ladle, and launder bricks increasingly rely on pyrophyllite binders that exhibit very low thermal expansion, excellent slag resistance, and stable alumina-silica networks. Global EAF capital spending rose from USD 670 million in 2024 and is slated to hit USD 1.27 billion by 2032 at an 11% CAGR, which feeds directly into refractory-grade pyrophyllite absorption. RHI Magnesita’s USD 1 billion acquisition spree locks in ore supply for this wave, while any Chinese export restriction on magnesite would widen the application window for alumina-silicate alternatives.
Lightweight Mineral Fillers for High-Build Industrial Coatings
Offshore wind-turbine towers, LNG tanks, and marine structures need thick coatings that resist corrosion without adding mass. Pyrophyllite’s platy habit and 1.58 refractive index deliver hiding power equivalent to talc at lower loading, enabling 400-600 μm dry-film thickness in one pass[1]Vanderbilt Minerals, “Performance Silicates for High-Build Coatings,” vanderbiltminerals.com. North American and European formulators also substitute the mineral for titanium dioxide after 2024’s 40% TiO₂ price spike. Fiberglass manufacturers mix pyrophyllite into E-glass batches to lower the melting temperature by 30-50 °C, which trims natural-gas use and aligns with decarbonization goals. These factors add 0.3 percentage points to the forecast CAGR, mainly in 2026-2028, while paint lines qualify new masterbatches.
Shift from Talc to Pyrophyllite in Cosmetics Amid Asbestos Litigation
FDA’s proposed talc-testing ruling in December 2024, though withdrawn in November 2025 for review, spurred cosmetic houses to trial pyrophyllite that has no geological link to asbestos[2]U.S. Food and Drug Administration, “Proposed Talc Rule for Cosmetics,” fda.gov. Brands accept USD 800-1,200 per-ton pricing, double standard talc, to avoid recall risks. The mineral duplicates talc’s softness and oil absorption, yet is sourced from North Carolina schists and South African metapelites safely outside serpentine zones. Litigation over talc propelled Estée Lauder, L’Oréal, and Shiseido to audit powders and shift procurement, contributing 0.2 percentage points to near-term CAGR.
Solid-State Battery Ceramic Separators Needing High-Purity Al-Si Feedstocks
QuantumScape and Corning aim for commercial oxide separators after their September 2025 partnership, and ProLogium had already shipped 2.4 million ceramic units by July 2025. Battery recipes require aluminosilicate filler with <0.05% Fe₂O₃ to avoid internal redox, so beneficiated pyrophyllite replaces costlier high-purity alumina. Current concentrates at 30-32% Al₂O₃ undercut pure alumina by 40-50% and add 0.4 percentage points to long-term CAGR, with Asia-Pacific at the forefront as most gigafactory pilots cluster in China, Japan, and South Korea.
Restraints Impact Analysis of Pyrophyllite Market*
| Restraints | (~) % Impact on CAGR Forecast | Geographic Relevance | Impact Timeline |
|---|---|---|---|
| Abundant substitute minerals: talc, kaolin, feldspar | -0.4% | Global | Short term (≤ 2 years) |
| Scarcity of low-iron, high-Al₂O₃ ore bodies | -0.3% | Global, acute in North America and Europe | Medium term (2-4 years) |
| High-energy intensity of fine-grinding and flotation circuit upgrades | -0.2% | Global, most severe in Europe and South Africa | Short term (≤ 2 years) |
| Source: Mordor Intelligence | |||
Abundant Substitute Minerals: Talc, Kaolin, Feldspar
Talc, kaolin, and feldspar serve roughly 80% of the same end uses and benefit from multi-million-ton economies of scale. Kaolin sales should climb from USD 4.85 billion in 2024 to USD 6.67 billion by 2030, bolstered by low-cost mining in Georgia, Cornwall, and Jiangsu. Talc continues as the default filler for polymers and paper, while feldspar remains the cheapest ceramic flux. These options shave 0.4 percentage points off pyrophyllite’s CAGR as buyers substitute whenever performance requirements allow.
Scarcity of Low-Iron, High-Al₂O₃ Ore Bodies
Fewer than 20 deposits worldwide combine >28% Al₂O₃ with <1% Fe₂O₃, and only two North Carolina mines stayed active through 2025 after U.S. output declined in 2023. South African exporters face rail constraints and port congestion, capping shipments at 150,000-200,000 tons/year. Chinese Liaoning ores need magnetic cleaning that adds USD 80-120 per ton while still missing battery-grade specifications. Ore scarcity, therefore, subtracts 0.3 percentage points from CAGR as demand outruns approved mining expansions.
*Our forecasts treat driver/restraint impacts as directional, not additive. The impact forecasts reflect baseline growth, mix effects, and variable interactions.
Pyrophyllite Market Segment Analysis
By Type:
Natural Dominance Masks Synthetic GainsNatural grades supplied 86.65% of 2025 tonnage, yet beneficiated and synthetic options are logging a 2.71% expansion through 2031. Natural feedstocks from Kings Mountain and Ottosdal sell at USD 200-350 per ton for ceramics, refractories, and filler uses, while battery and cosmetics buyers demand concentrates leached to <0.05% Fe₂O₃ that fetch USD 800-1,200. QuantumScape specifies ±0.02% tolerance on alumina, achievable only by flotation plus acid-leach routes that straddle natural and synthetic classes.
Hybrid processing is redefining product taxonomy. North Carolina producers are adding magnetic separation before calcination, while Japanese traders surface-treat powders with silanes for cosmetics. This migration shifts revenue even if natural ore retains volume leadership. The pyrophyllite market reports that synthetics can command three to five times natural pricing, supporting processors’ capital spending on leach and calcine assets.


By Application:
Refractories Lead, Batteries DisruptRefractories used 49.18% of 2025 supply and will log the fastest 2.56% CAGR to 2031 as EAF steelmaking doubles North American and European capacity. Ceramics secure roughly one-fifth of demand, but feldspar substitution holds growth below 2%. Coatings, paper, and plastics fillers cluster around 16% of volume, with coatings outperforming because offshore wind requires thick, durable layers that tap pyrophyllite’s platy opacity. Fiberglass melts absorb 6% on average, driven by wind-blade and automotive lightweighting. The residual “other applications” bucket, solid-state battery separators, cosmetics, and 3D-printed feedstocks, remains under 5% but is growing in double digits, so its revenue share is set to outrun tonnage through 2031.

Geography Analysis
APAC Pyrophyllite Market
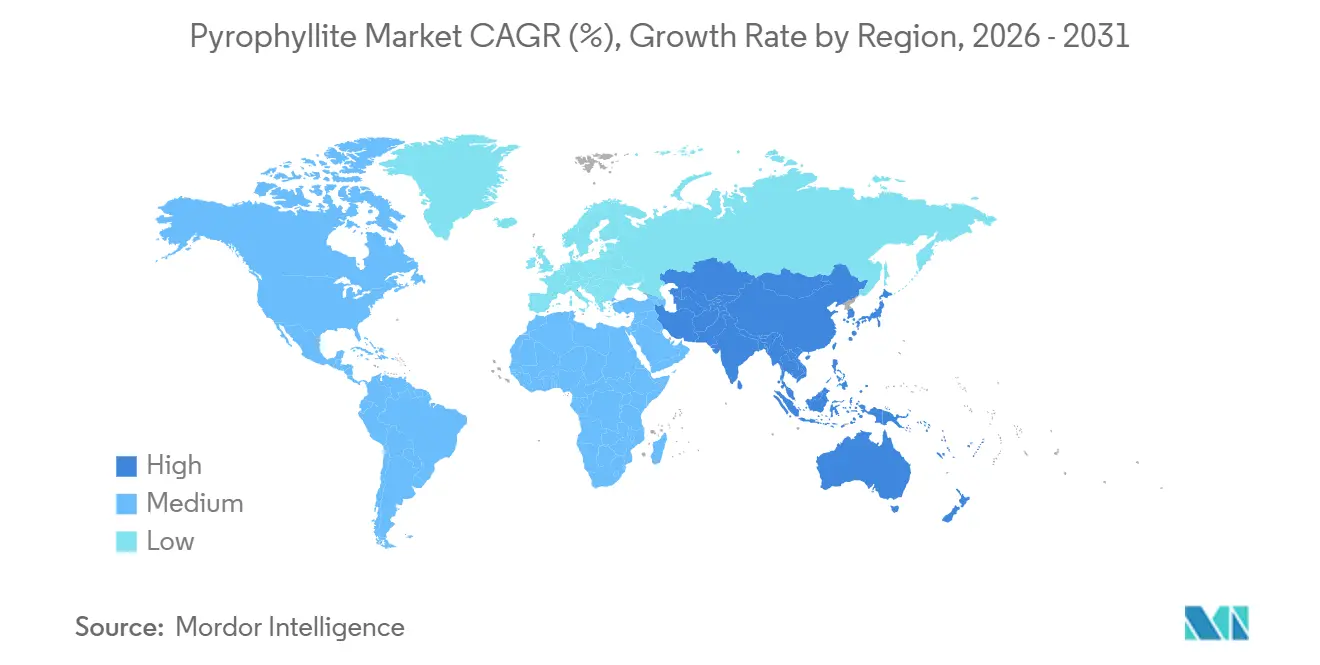
Asia-Pacific possessed 75.62% of 2025 consumption and will advance at 2.78% to 2031. China’s coupled mining-refractory ecosystem in Liaoning underpins most of that demand, and India’s ceramics and filler sectors add further pull. Japan and South Korea import low-iron North Carolina concentrates at USD 600-900 per ton for advanced ceramics and separator research and development.
North America and Europe Pyrophyllite Market
North America accounted for a significant market share in 2025 as two North Carolina operations feed U.S. steelmakers and coatings formulators. Inflation Reduction Act incentives should lift domestic EAF steel output 15-20% by 2030, nudging regional pyrophyllite uptake. Europe is witnessing moderate market growth, with Germany’s and Sweden’s hydrogen-furnace pilots sparking new low-alkali refractory demand. Southern Europe retains ceramics customers in Italy and Spain, while Nordic offshore-wind investments push coating fillers.
MEA, South America and APAC Pyrophyllite Market
South America, plus the Middle East and Africa, are witnessing an expansion of the market. South African production goes mostly to export markets, but rail and energy constraints cap quantum. Any Chinese export quota, similar to the 2010 rare-earth move, would reroute buyers toward North Carolina and South Africa. Given permitting lags, Asia-Pacific is unlikely to drop below 70% share by 2031.

Value Chain Analysis
Pyrophyllite value creation starts with exploration and selective mining of aluminosilicate ore bodies, followed by crushing, drying, and size reduction. Because many deposits carry quartz, mica, and iron-bearing impurities, beneficiation (attrition scrubbing, classification, flotation, and increasingly magnetic cleaning) determines whether the material can be sold into higher-value refractory, technical ceramics, battery-separator, and cosmetics channels. Low-iron, high-alumina ore scarcity also makes ore blending, tighter QA/QC, and chemical certification more important as products move through processing, where fine grinding and impurity removal tend to be the most energy-intensive steps.
Downstream, processors either sell milled concentrates through mineral distributors and traders or supply directly to refractory producers, ceramics plants, coatings formulators, fiberglass manufacturers, and emerging separator developers that require very low Fe2O3 feedstocks (<0.05% for battery-facing recipes). Export-oriented corridors rely heavily on logistics and reliability, with South African rail and port congestion limiting shipment flexibility. This dynamic reinforces the role of vertically integrated players that can secure captive ore, run internal beneficiation lines, and contract with end users that need consistent chemistry and particle-size distributions.
Competitive Landscape
The pyrophyllite market is moderately fragmented. RHI Magnesita spent USD 1.01 billion during 2024-2025 to acquire Krosaki Harima, Resco Products, and Dolomite Franchi, thereby locking in feedstock for captive refractory plants across three continents. Wonderstone and Idwala distribute to 40 nations but struggle with South African freight bottlenecks, while several Indian miners compete in low-margin ceramic fillers.
Strategic whitespace revolves around upgrading middling ores to battery grade, premixing LLZO masterbatches for cell makers, and coupling beneficiation with on-site renewables to market “green aluminosilicates.” Technology startups pilot sensor-based ore sorting that can cut downstream energy by 30-40%. Very few operators have ISO 14001 certification, giving sustainability-oriented newcomers a wedge to win auto and battery offtake contracts bound by science-based targets.
Pyrophyllite Industry Leaders
-
Avani Group
-
Wonderstone
-
R.T. Vanderbilt Holding Company, Inc.
-
Hankook Mineral Powder Co. Ltd.
-
Anand Talc
- *Disclaimer: Major Players sorted in no particular order
Pyrophyllite Market Companies Covered in this Report
- Anand Talc
- Avani Group
- Hankook Mineral Powder Co. Ltd.
- Hebei Yayang Spodumene Co., Ltd.
- Idwala Industrial Holdings
- Jinhae Pyrophyllite
- Liaoyuan Pharmaceutical Co., Ltd.
- NINGBO INNO PHARMCHEM CO., LTD.
- PT Gunung Bale
- R.T. Vanderbilt Holding Company, Inc.
- RHI Magnesita
- SAMIROCK Company
- SEPRA
- SKKU Minerals
- Wonderstone

Market Opportunities and Future Outlook
The clearest opportunity is upgrading middling ores into premium concentrates for applications that pay for chemistry control rather than bulk tonnage. Separator and advanced-ceramics programs already specify tight impurity limits, including <0.05% Fe2O3 in battery-facing formulations, so beneficiation, magnetic separation, and leach-and-calcine capability can be a practical entry path for processors that lack scale versus talc, kaolin, and feldspar. The September 2025 partnership between QuantumScape and Corning on commercial oxide separators, along with ProLogium shipping 2.4 million ceramic units by July 2025, provides more concrete demand signals for higher-purity aluminosilicate feedstocks and supports product development such as premixed ceramic masterbatches and tighter alumina tolerance control.
In refractories, electric-arc steelmaking channels almost half of output into refractory blends, and hydrogen-furnace pilots in Europe and North America raise demand for low-alkali, low-impurity aluminosilicates that hold stability under aggressive slag and thermal shock. Integrated refractory groups have been consolidating upstream resources, including RHI Magnesita’s acquisition-driven buildout during 2024-2025, and this is shifting procurement toward secured feedstock and more direct contracting. That creates room for independent miners and processors that can differentiate through audited traceability, consistent particle engineering for coatings and joint compounds, and processing upgrades that reduce the energy penalty of fine grinding and flotation.
Recent Industry Developments in Pyrophyllite Market
- June 2026: Wonderstone reaffirmed its ongoing supply of pyrophyllite for high-pressure high-temperature (HPHT) and technical ceramic applications, emphasizing use of the mineral in its natural form for pressure transfer performance. The communication underscored continuity of supply from South Africa for specialty industrial uses where repeatable mineral behavior matters more than lowest cost.
- December 2025: Wonderstone announced its annual mine shutdown period scheduled from 12 December 2025 to 12 January 2026, while confirming that sales and customer support would remain operational. The notice helped customers plan inventory and shipping around a known production pause in a supply chain already sensitive to logistics constraints.
- May 2025: Hercules Metals Corp. reported identifying pyrophyllite occurrences within advanced argillic alteration zones at its Leviathan project in western Idaho, supported by SWIR analysis and association with a high-sulfidation epithermal system. The update broadened exploration attention on North American occurrences at a time when low-iron, high-alumina ore scarcity remains a key constraint for higher-purity end uses.


Pyrophyllite Market Report Scope and Research Methodology
Market Definition and Coverage
This market covers the bulk pyrophyllite mineral traded and consumed for industrial use, tracked mainly in volume terms from mining output through processing and end use demand in key industries.
Scope exclusions: We exclude downstream finished products where pyrophyllite is only a minor additive and we also exclude non-industrial ornamental use that is not tracked through industrial supply chains.
Segments Covered in This Report
-
By Type
- Natural Pyrophyllite
- Other Types
-
By Application
- Ceramics
- Refractory
- Filler Materials (Paper, Paints, Insecticides)
- Fiberglass
- Rubber and Roofing
- Fertilizers (Soil Conditioners)
- Ornamental Stones
- Other Applications
-
By Geography
-
Asia-Pacific
- China
- India
- Japan
- South Korea
- Malaysia
- Thailand
- Indonesia
- Vietnam
- Rest of Asia-Pacific
-
North America
- United States
- Canada
- Mexico
-
Europe
- Germany
- United Kingdom
- France
- Italy
- Spain
- Nordic Countries
- Turkey
- Russia
- Rest of Europe
-
South America
- Brazil
- Argentina
- Colombia
- Rest of South America
-
Middle-East and Africa
- Saudi Arabia
- United Arab Emirates
- Qatar
- Egypt
- Nigeria
- South Africa
- Rest of Middle-East and Africa
-
Asia-Pacific
Data Sources, Market Sizing, and Validation
Desk Research
Desk work started with building the supply and demand map for pyrophyllite, using a volume-first view since this market is often reported in tons rather than revenue. We reviewed public sources such as the USGS mineral summaries, national geological survey publications, UN Comtrade trade statistics, and customs and port authority data where available.
To keep the demand side grounded, we also tracked end use indicators from sources such as the World Bank and IMF macro series, ceramics and refractory association publications, and peer reviewed materials journals that discuss substitution and performance of pyrophyllite in formulations. Company filings, investor presentations, and credible press were used to understand capacity changes and operational updates. A paid subscription for company financials and an import or export shipment level database was used selectively to validate flow direction and consistency. These examples are illustrative only, and we reviewed several other public sources for data collection, validation, and clarification as the model was built.
Primary Interviews and Surveys
Primary inputs came from interviews and short surveys with mining and processing participants, distributors, and large industrial buyers, so gaps in trade and production reporting could be closed. Because this is a global market, we balanced views across APAC, EMEA, and the Americas, and used these conversations to sanity check grade mix, typical loss factors, and how volumes move into ceramics, refractories, fillers, and other uses.
Distribution of primary research fieldwork respondents
| Company type | Respondent position | Region |
|---|---|---|
| Top tier: 29% | CXOs: 12% | APAC: 44% |
| Mid tier: 50% | Functional/Unit leaders: 31% | EMEA: 30% |
| Smaller Players: 21% | Managers: 57% | Americas: 26% |
Market-Sizing & Forecasting
The market was sized mainly using a top-down logic where production and trade data reconstruct the apparent consumption pool in kilotons by region, then adjusted for processing yields and inventory movement that we learned in interviews. Results were corroborated with selective bottom-up approximations, such as sample supplier volume checks, channel discussions on typical shipment sizes, and indicative pricing by grade to sanity check implied revenue ranges.
Key inputs used in the model included mining output trends in key producing countries, import and export volumes and unit values, ceramics and refractory activity signals that influence pyrophyllite pull through, grade mix shifts between natural and processed material, and substitution patterns versus nearby industrial minerals (where end users sometimes switch for cost). For forecasting, we leaned on scenario analysis with a light multivariate view, where volume growth is tied to ceramics and refractory production outlook, construction and industrial activity, and expected trade rebalancing. Where bottom-up volume indications were missing for smaller producing regions, the gaps were handled using trade proxies and capacity utilization assumptions that were checked back with respondents.
Data Validation & Update Cycle
Validation was handled through multiple checks so the final numbers do not depend on one data series. Model outputs were compared against independent signals such as trade balances, major capacity announcements, and end use sector direction, and outliers were reviewed before sign off.
Reports are refreshed annually, and when a material event occurs, assumptions like unit values, currency conversion timing, and trade flows are revisited and rechecked with selected contacts. Before delivery, a fresh analyst pass is completed so clients receive the latest updated view aligned with the most recent public releases.
Mordor Intelligence's Pyrophyllite Market Size Measured Against Other Published Estimates
Published market sizes for pyrophyllite often do not match because some studies track volume in kilotons while others convert into revenue, and each choice changes what gets counted. Differences also come from the year used for pricing, how trade flows are netted out, and whether the work is refreshed soon after large unit value moves.
A common gap driver is ASP logic, where some estimates apply a single average price across grades and regions, even though traded unit values can vary widely by quality and processing. Another driver is the update cycle, because when currency timing and recent shipment unit values are rolled forward more frequently, the conversion from tons to USD can shift even if physical demand is stable, which is why the refresh cadence and unit value checks used in Mordor Intelligence can widen or narrow the spread versus older revenue snapshots.
Benchmark comparison
| Source | Market Size | Gaps in Research Methodology |
|---|---|---|
| Mordor Intelligence | USD 0.79 M (2025) | |
| Global Consultancy A | USD 0.62 B (2024) | Revenue sizing is presented without clear linkage to grade mix and regional price dispersion, and the USD conversion appears anchored to a base year snapshot that can miss later unit value movements in traded material. |
| Industry Research Publisher B | USD 0.08 B (2024) | The estimate looks closer to a narrower definition that may focus on selected application chains, and the price build seems to rely on a single blended ASP, which can understate value when processed or higher grade material has a larger share. |
The table shows that the widest spread usually comes from whether the study treats pyrophyllite as a physical tonnage market with optional value conversion, or as a revenue market that assumes one pricing layer. By keeping the calculation traceable to production and trade volumes first, and then applying transparent price timing and checks, we can explain the differences and keep the final view repeatable year after year.


Key Questions Answered in the Report
How large will the market size be for pyrophyllite in 2031?
The pyrophyllite market is anticipated to reach at 891.16 kilotons in 2031 by growing with a CAGR of 2.11% during the forecast period.
Which countries drive demand for pyrophyllite in refractories by 2031?
China, India, Japan, and South Korea account for most Asian growth, with the U.S. and Germany adding capacity through new electric-arc and hydrogen furnaces.
How fast will natural versus synthetic grades grow to 2031?
Natural maintains volume dominance at roughly 86% share, while synthetic and beneficiated grades grow 2.71% annually, faster than overall demand.
What lifts pricing for battery-grade pyrophyllite?
Separator producers pay three to five times refractory price to secure <0.05% Fe₂O₃ and tight alumina tolerance needed for LLZO and LATP chemistries.
Why is energy intensity a concern for processors?
Achieving −325 mesh with low iron uses up to 280 kWh per tonne, so higher electricity tariffs in Europe raise operating cost to one-quarter of selling price.
Which companies dominate global supply?
RHI Magnesita, Wonderstone, Idwala, and major Chinese state-owned miners together hold about 55% of capacity; none control more than 20%.
What new end uses arise beyond refractories and ceramics?
Solid-state battery separators, asbestos-free cosmetics powders, and high-build industrial coatings are emerging niches with higher margins.
Page last updated on:


 Your data is secure and never sold or shared.


