Advanced Ceramics Market Size and Share
Market Overview
| Study Period | 2026 - 2031 |
|---|---|
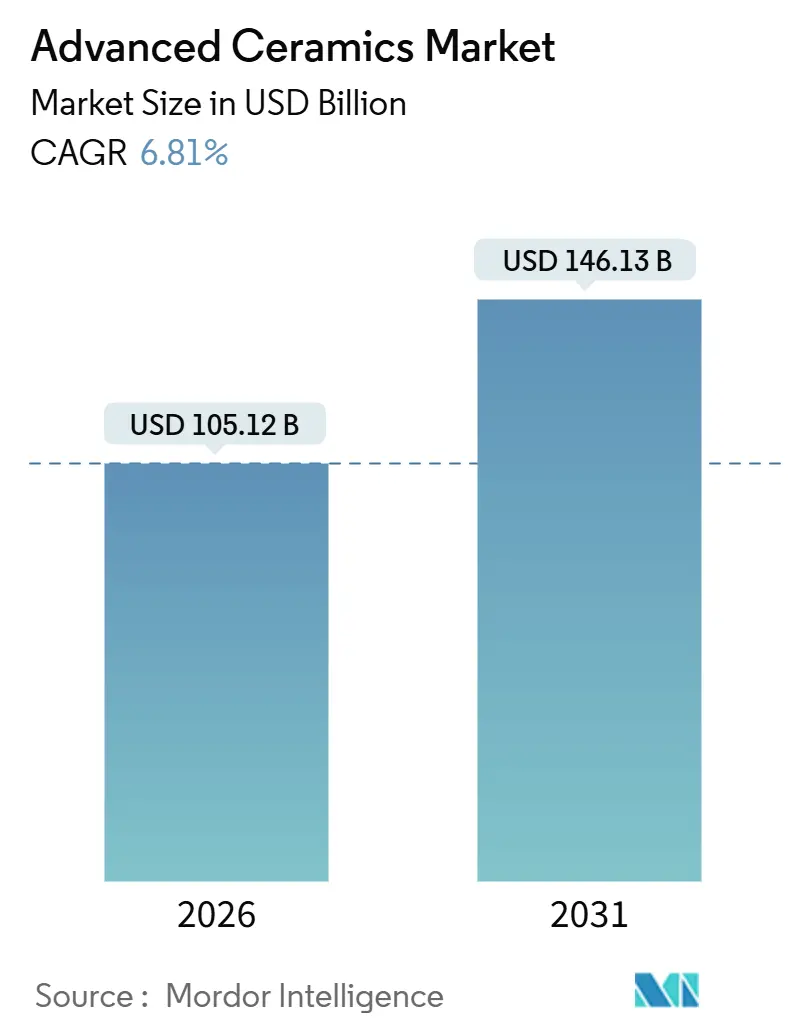
| Market Size (2026) | USD 105.12 Billion |
| Market Size (2031) | USD 146.13 Billion |
| Growth Rate (2026 - 2031) | 6.81% CAGR |
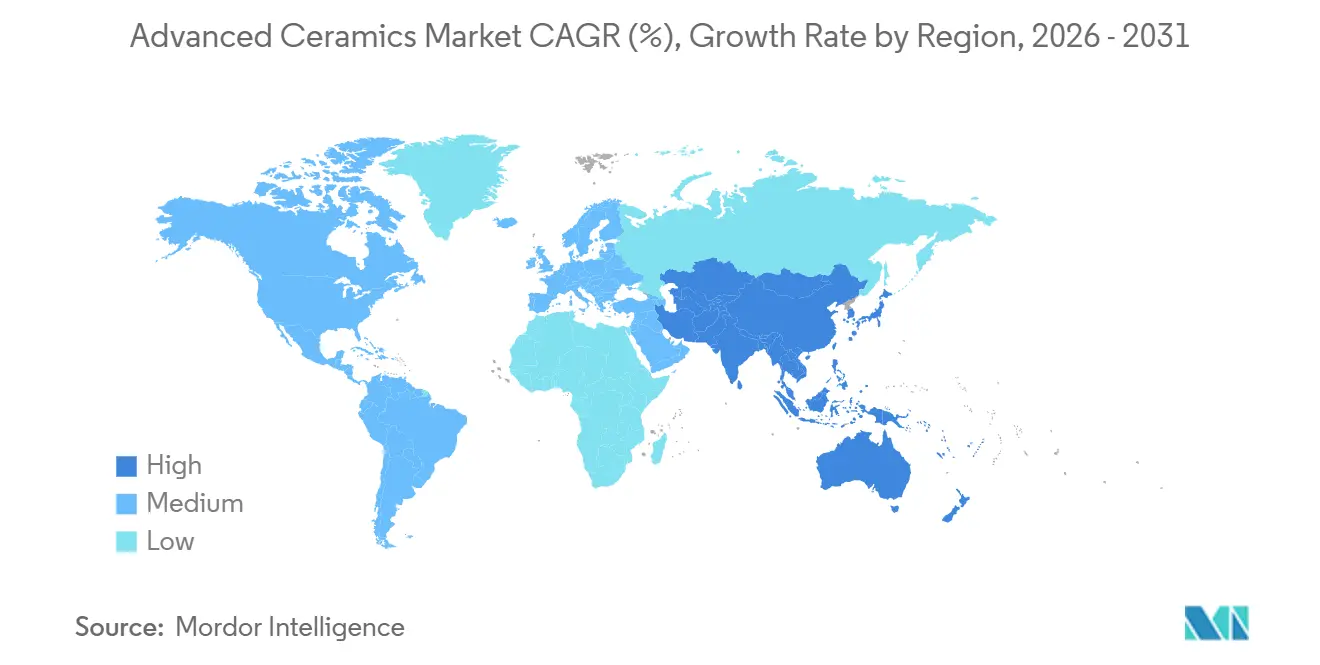
| Fastest Growing Market | Asia-Pacific |
| Largest Market | Asia-Pacific |
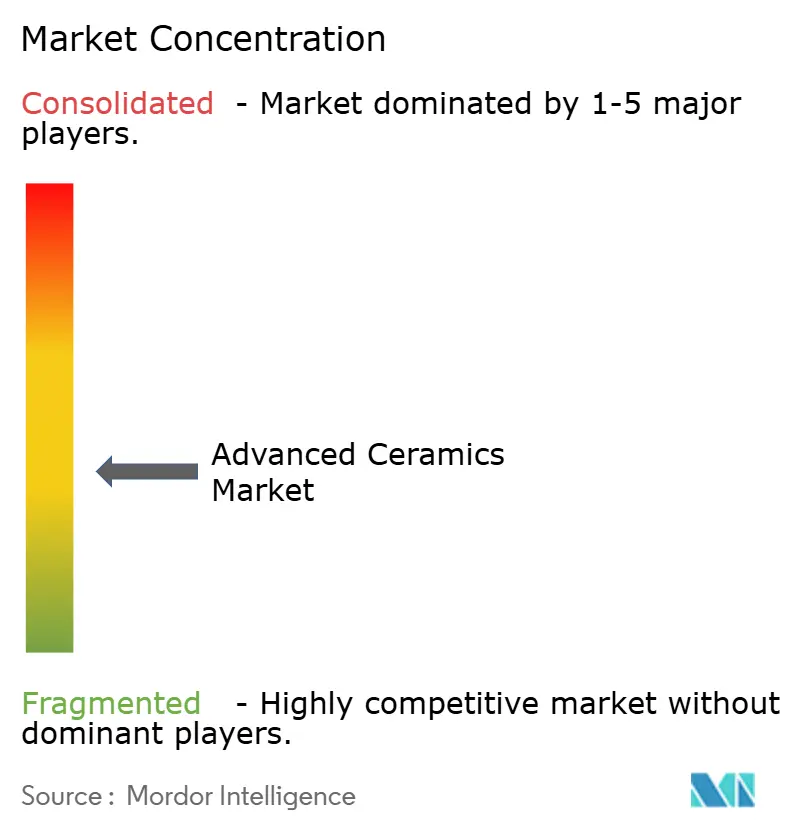
| Market Concentration | Medium |
Major Players *Disclaimer: Major Players sorted in no particular order Image © Mordor Intelligence. Reuse requires attribution under CC BY 4.0. | |
Advanced Ceramics Market Analysis by Mordor Intelligence
The Advanced Ceramics Market size is estimated at USD 105.12 billion in 2026, and is expected to reach USD 146.13 billion by 2031, at a CAGR of 6.81% during the forecast period (2026-2031). This steady ascent stems from the electrification of vehicles, demand for high-frequency power electronics, and sovereign-manufacturing directives that localize substrate output in the United States, the European Union, and China. Supply-chain realignment favors materials able to handle temperatures above 1,200 °C, extend component life, and enable miniaturization in AI servers and 5G infrastructure. Manufacturers are widening portfolios to include piezoelectric titanates, aluminum nitride substrates, and zirconia-based bioceramics that win faster regulatory approvals. At the same time, capital-intensive sintering processes and limited recycling options temper near-term profitability, prompting incumbents to pursue efficiency gains and strategic partnerships.
Key Report Takeaways
- By material type, alumina captured 41.26% of the 2025 share; titanate ceramics hold the highest 7.82% CAGR outlook.
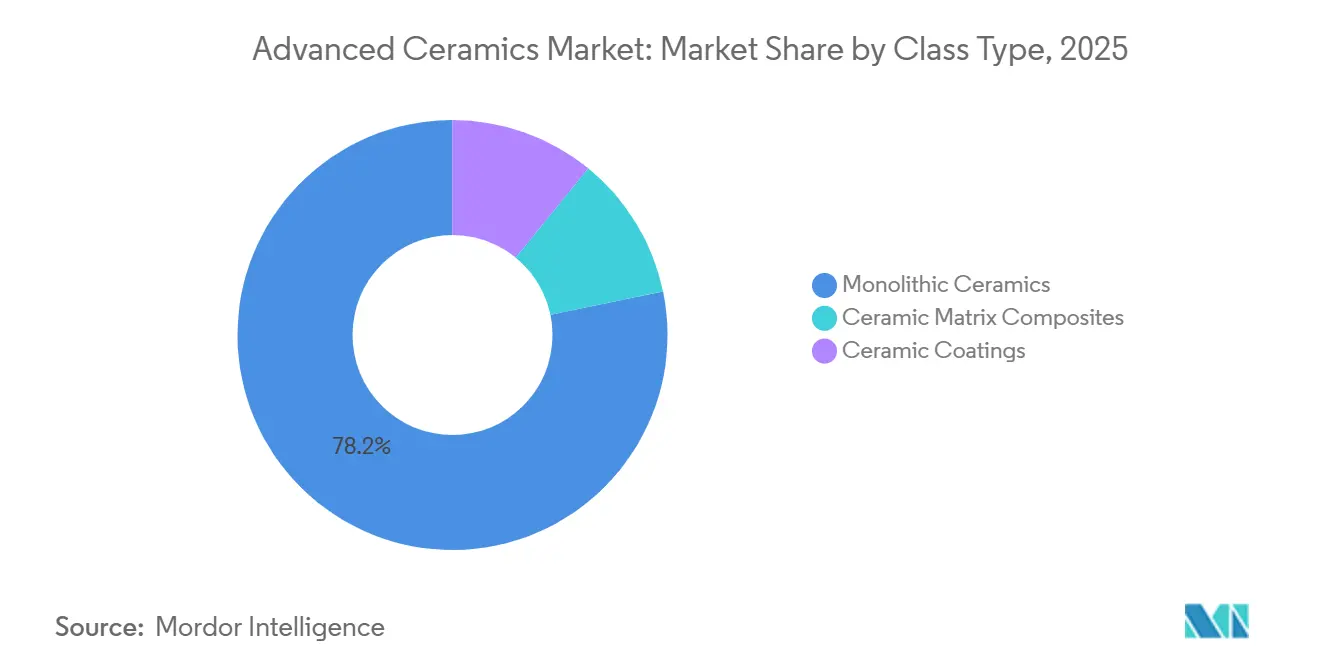
- By class type, monolithic products commanded 78.24% of 2025 revenue; ceramic matrix composites are pacing at an 8.17% CAGR.
- By application, electroceramics led with 45.31% of 2025 revenue, while bioceramics is advancing at an 8.79% CAGR through 2031.
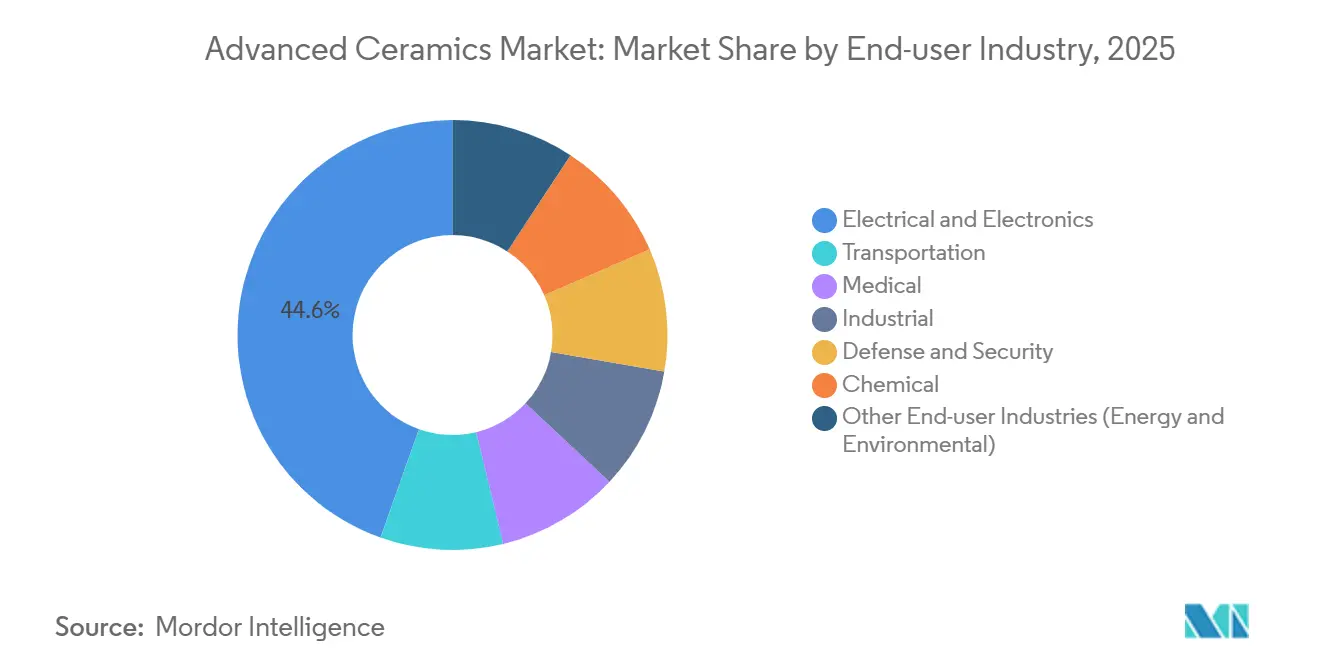
- By end-user industry, electronics accounted for 44.56% of sales in 2025, whereas the medical segment is anticipated to post the fastest 11.87% CAGR to 2031.
- By geography, Asia-Pacific controlled 54.22% of 2025 turnover and is expanding at a 7.11% CAGR to 2031.
Note: Market size and forecast figures in this report are generated using Mordor Intelligence’s proprietary estimation framework, updated with the latest available data and insights as of January 2026.
Global Advanced Ceramics Market Trends and Insights
Driver Impact Analysis*
| Drivers | (~) % Impact on CAGR Forecast | Geographic Relevance | Impact Timeline |
|---|---|---|---|
| Shift from metals and high-performance plastics | +1.2% | Asia-Pacific, North America | Medium term (2-4 years) |
| Expanding use in medical implants and devices | +1.8% | North America, Europe, emerging Asia-Pacific | Long term (≥ 4 years) |
| Demand in high-frequency power electronics | +1.5% | Asia-Pacific core, spill-over to North America | Short term (≤ 2 years) |
| Rising aerospace and defense thermal needs | +1.1% | North America, Europe | Long term (≥ 4 years) |
| Solid-state batteries and SOFC adoption | +1.0% | Global, early traction in Japan, Germany, California | Medium term (2-4 years) |
| Source: Mordor Intelligence | |||
Shift From Metals And High-Performance Plastics
Automotive and aerospace weight-reduction rules accelerate the swap from steel and aluminum to silicon nitride and silicon carbide. Hyundai-Transys showed ceramic bearings cut parasitic losses by 12% versus steel in 2024 tests[1]Hyundai-Transys Research Center, “Ceramic Bearing Efficiency Study,” hyundai-transys.com. NASA’s 2025 work proved silicon-nitride turbine blades endure 1,400 °C, 200 °C hotter than nickel superalloys, while lowering mass by 40%[2]NASA Glenn Research Center, “High-Temperature Silicon Nitride Turbine Blades,” nasa.gov. Yet NSK’s 2024 filing revealed that ceramic-ball costs above USD 15 each keep some suppliers on hybrid designs. Overall, OEMs continue to qualify all-ceramic parts for EV gearboxes and hypersonic propulsion despite cost gaps.
Expanding Use In Medical Implants And Devices
Zirconia-toughened alumina and yttria-stabilized zirconia are replacing cobalt-chromium in joint arthroplasty because of low ion release and high wear resistance. Zimmer Biomet won FDA 510(k) clearance in March 2025 for its Persona IQ femoral component featuring a zirconia head that lowers polyethylene wear by 60% over 15 years. Stryker’s 2025 investor deck said its Mako platform with ceramic liners cut revision surgeries below 2% at 10 years. Although Europe’s stricter Medical Device Regulation extends launch timelines 18-24 months, the added rigor consolidates share for ISO 13485-certified plants.
Demand In High-Frequency Power Electronics
Gallium-nitride and silicon-carbide transistors need aluminum nitride and silicon-carbide substrates with thermal conductivity above 150 W/m-K. Kyocera expanded Kagoshima AlN output by 30% in January 2025 to serve 800-V EV platforms. Maruwa noted 45% shipment growth to 5G customers with ASPs above USD 8/cm² during fiscal 2024. An IEEE 2025 study found SiC substrates slash inverter cooling mass 25%, letting automakers delete liquid loops. These advantages support rapid substrate uptake through 2027.
Rising Aerospace And Defense Thermal Needs
Ceramic matrix composites now appear in high-pressure turbine sections. GE Aviation disclosed over 200 kg of SiC–SiC CMC parts per LEAP engine, trimming fuel burn by 1.5%. Rolls-Royce’s June 2025 data showed UltraFan CMC blades run at 1,500 °C, 100 °C hotter than metal Trent XWB parts, boosting thermal efficiency 2%. Oerlikon Surface Solutions landed a USD 42 million U.S. Air Force contract in September 2024 for yttria-stabilized zirconia coatings rated 1,650 °C. Defense programs, therefore, lock in long-term demand for ultra-high-temperature ceramics.
Restraint Impact Analysis*
| Restraints | (~) % Impact on CAGR Forecast | Geographic Relevance | Impact Timeline |
|---|---|---|---|
| High production costs | -0.9% | Global, acute in North America and Europe | Short term (≤ 2 years) |
| Complex, capital-intensive manufacturing | -0.7% | Global, barriers highest in emerging markets | Medium term (2-4 years) |
| Limited end-of-life recycling infrastructure | -0.4% | Global, most pronounced in Asia-Pacific | Long term (≥ 4 years) |
| Source: Mordor Intelligence | |||
High Production Costs
Kiln temperatures above 1,600 °C and post-machining inflate ceramic prices 3-5× molded polymers. CoorsTek’s 2024 deck showed alumina substrates need 12 MWh per ton, with volatile European gas adding USD 0.80-1.20/kg. CeramTec’s 2025 sustainability report projected EUR 18 million (USD 19.4 million) to electrify kilns, raising unit cost by 6% until power prices stabilize. Small-batch niches like pyrolytic boron nitride exceed USD 500/kg, deterring wider uptake.
Complex, Capital-Intensive Manufacturing
Greenfield plants require USD 50-150 million for powder synthesis, isostatic presses, and metrology. Morgan Advanced Materials invested USD 12 million with Penn State to pilot SiC fibers that will not be commercialized before 2027. ISO 17025 accreditation adds 8-12 weeks to aerospace and medical qualification. Emerging-market suppliers struggle to recruit ceramics engineers, paying 40% salary premiums for expatriates.
*Our forecasts treat driver/restraint impacts as directional, not additive. The impact forecasts reflect baseline growth, mix effects, and variable interactions.
Segment Analysis
By Material Type: Alumina Anchors Electronics, Titanate Gains in Sensors
Alumina captured 41.26% of the advanced ceramics market share in 2025, reflecting its entrenched use as the dielectric in multilayer ceramic capacitors that ship in the trillions every year. That dominance equated to the largest slice of the advanced ceramics market size for any individual material during the base year. Titanate ceramics, led by barium titanate and lead zirconate titanate, are projected to clock a 7.82% CAGR through 2031, the fastest rate among material categories. Together, alumina and titanate therefore set the tone for how the advanced ceramics market will evolve in electronic components and sensing technologies. Demand for alumina MLCC dielectrics intensified after Murata expanded Izumo capacity by 20% to satisfy AI-server boards that need up to 2,000 capacitors each.
Beyond MLCCs, zirconia commands a share in dental crowns and femoral heads because yttria-stabilized grades deliver fracture toughness above 10 MPa√m, double alumina. Silicon carbide and silicon nitride remain staples for high-temperature hardware, with SiC substrates already embedded in 800-volt electric-vehicle inverters. Aluminum nitride sells at premium prices—USD 8–12 per cm²—because 170 W/m-K thermal conductivity keeps gallium-nitride radio-frequency amplifiers within safe operating limits. Magnesium silicate catalyst supports and pyrolytic boron nitride crucibles fill smaller but profitable niches as the advanced ceramics market diversifies into petrochemical reforming and semiconductor crystal growth. Collectively, these materials define the next phase of functional specialization across the advanced ceramics market.
By Class Type: Monolithic Dominance Faces CMC Disruption
Monolithic products generated 78.24% of revenue in 2025, giving them the largest position in the overall advanced ceramics market. That commanding presence translated into the single biggest contribution to the advanced ceramics market size for any class type. Yet ceramic matrix composites are forecast to expand at an 8.17% CAGR, almost two percentage points above the market average, as aerospace primes qualify CMC turbine components capable of running 100 °C hotter than nickel alloys. Powder-to-part vertical integration at Kyocera, CoorsTek, and TDK allows monolithic substrates to meet tight AI-server impedance tolerances, thereby reinforcing short-term volume advantages.
Momentum nonetheless is shifting. Safran reported that CMC shrouds trim fuel burn by 1.2% on LEAP-equipped aircraft. Praxair Surface Technologies documented yttria-stabilized zirconia coatings that stretch overhaul intervals from 15,000 to 22,000 flight hours, a USD 3.2 million benefit per engine. These gains illustrate how coatings and composites erode the incumbent lead of monolithics. The advanced ceramics market, therefore, stands at a crossroads where volume remains in monolithic formats while value migrates to engineered CMC and coating architectures that lengthen service life in demanding thermal profiles.


By Application: Electroceramics Lead, Bioceramics Surge
Electroceramics delivered 45.31% of application revenue in 2025, marking the single biggest vertical inside the advanced ceramics market. Multilayer ceramic capacitors dominate this slice, and Samsung Electro-Mechanics is adding 10 billion units per month of MLCC capacity by Q2 2026, underscoring strong unit intensity in AI accelerators. Bioceramics, led by zirconia-toughened alumina implants, will grow at an 8.79% CAGR through 2031, the highest among application groups. That pace positions medical devices to add the most absolute dollars to the advanced ceramics market size after electronics.
Structural ceramics such as silicon-nitride cutting inserts and alumina armor plates continue to find traction in transportation and defense. Wear and corrosion components protect pump seals and valve seats in chemical processing, while thermal-barrier ceramics like hafnium diboride guard scramjet leading edges at 2,000 °C. Cordierite diesel-particulate filters capture 95% of soot to help heavy-duty trucks meet Euro VI targets, reflecting environmental pull on the advanced ceramics market. Catalyst supports and high-temperature filters, therefore, remain indispensable even as new medical and electronic uses proliferate.
By End-User Industry: Electronics Dominate, Medical Accelerates
Electrical and electronics accounted for 44.56% of the advanced ceramics market size in 2025, yielding the largest slice of any customer vertical in the market. Persistent double-digit data-center growth and vehicle digitization keep MLCC demand elevated, and UBS reported distributor inventory dipped to only 45 days of supply in late 2024. The medical segment, however, is slated for an 11.87% CAGR through 2031, the fastest trajectory across end users, driven by more than 2.5 million annual joint-replacement procedures in mature economies. That expansion propels medical devices toward a bigger share of the advanced ceramics market size by decade-end.
Transportation, spanning automotive and aerospace, relies on silicon-carbide substrates and ceramic matrix composites to meet lightweighting mandates. Industrial sectors use alumina and silicon carbide tooling to machine nickel-based superalloys, while the chemical industry needs cordierite honeycomb supports to oxidize volatile organic compounds at 98% efficiency. Defense agencies obligated USD 1.8 billion in fiscal 2025 for advanced materials under the U.S. Defense Production Act, highlighting a sovereign push that reverberates across the advanced ceramics market. Collectively, these diverse customer sets ensure that no single industry can dictate future growth paths, preserving balanced demand dynamics.
Geography Analysis
Asia-Pacific generated 54.22% of revenue in 2025, making it the largest regional slice of the advanced ceramics market. That lead is projected to widen as the region posts a 7.11% CAGR through 2031, well ahead of North America and Europe. Japan’s Ministry of Economy, Trade and Industry indicated domestic shipments hit JPY 1.2 trillion in 2024 (USD 8.1 billion) and still grew exports 18% despite geopolitical frictions. Vertical integration at Kyocera, Murata, and TDK—spanning powder synthesis to electrical testing—compresses cycle times and safeguards proprietary know-how, cementing Asia-Pacific’s dominance in the advanced ceramics market.
South Korea accelerates capacity via Samsung Electro-Mechanics and LG Innotek, whose combined 2024 capital outlays topped KRW 800 billion (USD 610 million) for new MLCC and substrate lines. China’s Made in China 2025 incentives subsidize alumina-powder expansion at Sinocera’s Yixing plant, now producing 15,000 metric tons per year. India remains import-dependent for 70% of its needs, yet its Production-Linked Incentive scheme for electronics foresees localized substrate assembly by 2028, potentially adding fresh momentum to the regional advanced ceramics market.
The advanced ceramics demand in North America is anchored by aerospace and defense programs that favor U.S. suppliers such as CoorsTek, 3M, and Corning. The Inflation Reduction Act’s domestic-content clauses prompted General Motors to commit to U.S. aluminum-nitride substrates in Ultium battery packs from 2026 onward. Pratt & Whitney Canada is deploying ceramic-matrix-composite turbine components in PW800 engines to improve fuel economy for Gulfstream business jets, demonstrating the technology’s northward diffusion. Mexico’s Querétaro automotive hub hosts substrate assembly lines that supply U.S. EV plants, capitalizing on regional-value-content rules under USMCA.
Europe represented a considerable market share in 2025, with Germany, France, and the United Kingdom leading production and consumption. CeramTec and Morgan Advanced Materials operate ISO 13485-certified plants producing zirconia femoral heads and alumina acetabular liners. While the European Medical Device Regulation lengthens approval cycles, it also filters out non-compliant importers, funneling demand toward established brands. Germany’s Fraunhofer IKTS collaborates with Siemens Energy to achieve 65% electrical efficiency in hydrogen-fueled SOFC stacks by 2027. EU Horizon Europe grants are channeling EUR 120 million into ultra-high-temperature ceramics for hypersonic vehicles, ensuring the region remains relevant in the advanced ceramics market.
South America and the Middle East and Africa are witnessing rising demand for advanced ceramics. Brazil’s EMBRAER is testing silicon-nitride flap-track rollers to shave aircraft maintenance costs, while Saudi Aramco finances pyrolytic boron nitride crucibles for in-house semiconductor pilot lines. Both regions, however, depend on imported powders, limiting value capture within the advanced ceramics market. Long-term upside hinges on knowledge transfer and the maturation of local ceramic-engineering curricula.
Mordor Intelligence provides coverage of the advanced ceramics market across other key regional markets. Detailed country-level analysis extends to United States incorporating local coverage and market participation, as required.

Competitive Landscape
The advanced ceramics market is moderately fragmented. Japanese incumbents maintain powder-to-module vertical integration, giving them tight control of dielectric formulations and multilayer stacking accuracy. Murata’s 2025 roll-out of 0402-size capacitors with 100 V ratings for AI accelerator boards illustrates the edge gained from in-house material science. Kyocera expanded Kagoshima AlN capacity by 30% in 2025 to protect its share in EV inverter substrates.
Advanced Ceramics Industry Leaders
KYOCERA Corporation
CoorsTek Inc.
CeramTec GmbH
Morgan Advanced Materials
Saint-Gobain
- *Disclaimer: Major Players sorted in no particular order

Recent Industry Developments
- January 2025: Kyocera boosted the aluminum-nitride substrate capacity 30% at Kagoshima to serve 800-V EV battery systems, investing JPY 8 billion (USD 54 million).
- May 2024: Morgan Advanced Materials entered a USD 12 million collaboration with Pennsylvania State University to develop silicon carbide fibers for ceramic matrix composites, targeting aerospace turbine applications. The partnership will establish a chemical vapor infiltration reactor at Penn State's Materials Research Institute, with pilot-scale fiber production expected by 2027.


Research Methodology Framework and Report Scope
Market Definitions and Key Coverage
Our study defines the advanced ceramics market as revenue generated from engineered, high-purity, oxide and non-oxide ceramic parts and coatings sold for electronic, medical, transportation, industrial, defense, and energy uses. Coverage spans monolithic bodies, ceramic matrix composites, and functional coatings manufactured by sintering, hot pressing, or CVD.
Exclusion: traditional clay-based structural products and glass-ceramics are outside scope.
Segmentation Overview
- By Material Type
- Alumina
- Zirconia
- Titanate
- Silicon Carbide
- Silicon Nitride
- Aluminum Nitride
- Magnesium Silicate
- Pyrolytic Boron Nitride
- Others
- By Class Type
- Monolithic Ceramics
- Ceramic Matrix Composites
- Ceramic Coatings
- By Application
- Structural Ceramics
- Bioceramics
- Electroceramics
- Wear and Corrosion Components
- Thermal Barrier and UHTC Components
- Catalyst Supports and Filters
- Others (Environmental and Energy Systems)
- By End-user Industry
- Electrical and Electronics
- Transportation
- Medical
- Industrial
- Defense and Security
- Chemical
- Other End-user Industries (Energy and Environmental)
- By Geography
- Asia-Pacific
- China
- India
- Japan
- South Korea
- Rest of Asia-Pacific
- North America
- United States
- Canada
- Mexico
- Europe
- Germany
- United Kingdom
- France
- Italy
- Rest of Europe
- South America
- Brazil
- Argentina
- Rest of South America
- Middle East and Africa
- Saudi Arabia
- South Africa
- Rest of Middle East and Africa
- Asia-Pacific
Detailed Research Methodology and Data Validation
Primary Research
Mordor analysts interviewed material scientists, MLCC purchasers, turbine OEM buyers, and implant surgeons across Asia-Pacific, North America, and Europe. Their insights tested adoption rates, validated regional ASP spreads, and fine-tuned yield loss assumptions that secondary data could not surface.
Desk Research
We began with trade statistics from UN Comtrade, production and price updates from the USGS, export logs on Volza, and patent trends extracted via Questel. Those figures were anchored with sector data from WSTS (semiconductors), IMTMA (machine tools), and annual reports from listed ceramic firms. Subscription feeds in D&B Hoovers and Dow Jones Factiva helped our team spot capacity additions and contract awards that signal demand swings. The sources named here illustrate, not exhaust, the wider document set consulted.
A second sweep captured regulatory filings, peer-reviewed papers on zirconia implants, and procurement notices for ceramic armor, giving baseline volumes and average selling prices across end uses.
Market-Sizing & Forecasting
A top-down reconstruction built demand pools from electronics output, vehicle production, implant procedure counts, turbine shipments, and export trade. Select bottom-up cross-checks, supplier roll-ups, and sampled alumina substrate ASP × volume tempered over or under shoots. Key model levers include multilayer ceramic capacitor output, EV production growth, orthopedic implant volumes, substrate yield improvements, and alumina price trends. Forecasts employ multivariate regression blended with scenario analysis for raw material cost shocks, and gaps in bottom-up inputs are bridged through weighted regional proxies.
Data Validation & Update Cycle
Before release, outputs pass variance screens against historical series and peer benchmarks, then a senior reviewer signs off. Reports refresh each year, and we trigger interim revisions when plant closures, force majeure events, or major regulation changes alter fundamentals.
Why Mordor's Advanced Ceramics Baseline Commands Reliability
Published estimates often diverge because firms choose different product mixes, pricing ladders, and refresh cadences.
Key gap drivers include narrower material lists, single-region samples, or currency conversions frozen at historic rates, whereas Mordor applies uniform 2024 average exchange rates, tracks thirteen material classes, and revisits models annually.
Benchmark comparison
| Market Size | Anonymized source | Primary gap driver |
|---|---|---|
| USD 104.34 B (2025) | Mordor Intelligence | - |
| USD 115.07 B (2024) | Global Consultancy A | excludes coatings; six-year refresh cycle |
| USD 95.91 B (2024) | Press Release B | assumes uniform ASP across regions |
| USD 12.16 B (2024) | Sector Study C | covers only piezo, filters, and medical parts |
The comparison shows that scope breadth and update frequency materially shift totals; Mordor's disciplined, repeatable approach produces a balanced reference point clients can trust.


Key Questions Answered in the Report
What is the current value of the advanced ceramics market?
The advanced ceramics market size is estimated at USD 105.12 billion in 2026 and is on track for USD 146.13 billion by 2031.
Which application accounts for the largest revenue?
Electroceramics, led by multilayer ceramic capacitors, generated 45.31% of 2025 revenue.
Which end-user industry is growing fastest?
The medical industry segment is projected to post an 11.87% CAGR through 2031 due to wider adoption of zirconia-based orthopedic implants.
Why is Asia-Pacific so dominant in advanced ceramics?
The region hosts vertically integrated giants like Kyocera and Murata and benefits from concentrated MLCC and EV-inverter supply chains.
What hinders wider adoption of advanced ceramics?
High production costs above 1,600 °C sintering, complex capital-intensive processes, and limited recycling infrastructure restrain growth.
Are ceramic matrix composites gaining share?
Yes, CMCs are forecast to expand at an 8.17% CAGR through 2031 as aerospace and defense programs qualify hotter-running turbine components.
Page last updated on:


