
Transparent Ceramics Market Size and Share
Market Overview
| Study Period | 2020 - 2031 |
|---|---|
| Market Size (2026) | USD 1 Billion |
| Market Size (2031) | USD 1.79 Billion |
| Growth Rate (2026 - 2031) | 12.36 % |
| Fastest Growing Market | Asia Pacific |
| Largest Market | Asia Pacific |
| Market Concentration | Medium |
Major Players *Disclaimer: Major Players sorted in no particular order Image © Mordor Intelligence. Reuse requires attribution under CC BY 4.0. | |
Transparent Ceramics Market Analysis by Mordor Intelligence
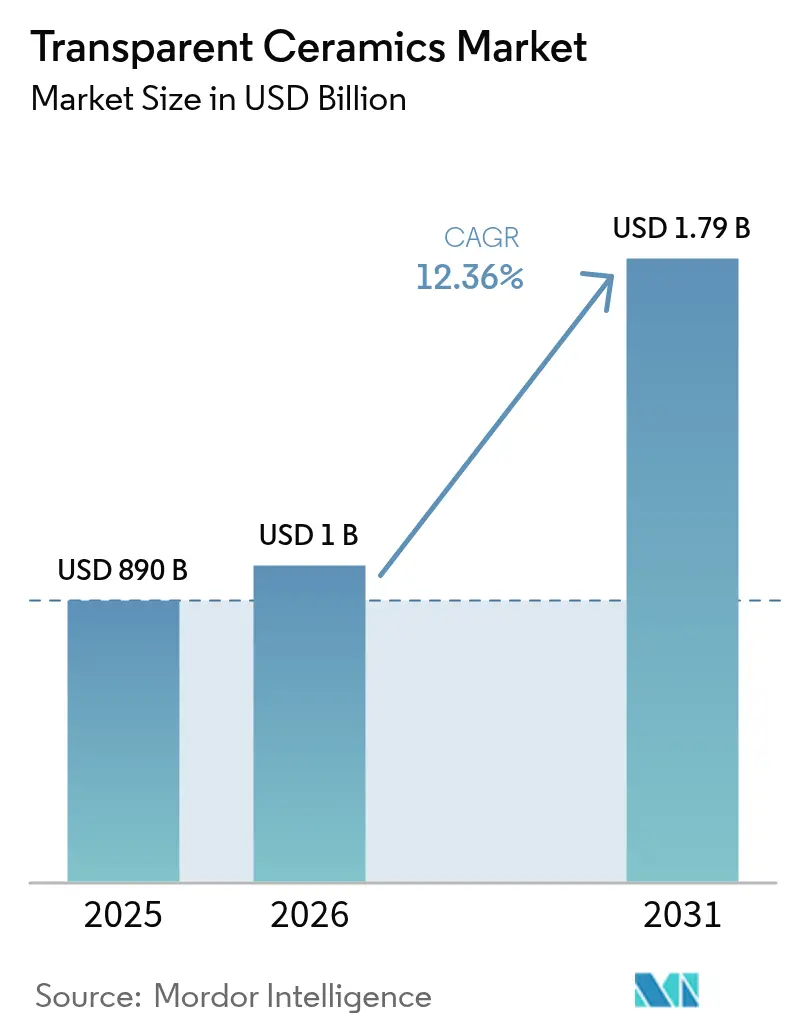
The Transparent Ceramics Market size was valued at USD 890 million in 2025 and estimated to grow from USD 1 billion in 2026 to reach USD 1.79 billion by 2031, at a CAGR of 12.36% during the forecast period (2026-2031). Demand for fusion-grade laser optics, hypersonic vehicle domes, and next-generation optoelectronic components continues to redefine performance baselines, spurring investment in manufacturing technologies that shrink defect rates and expand throughput. Asia Pacific, supported by semiconductor and aerospace buildouts in China and Japan, contributes the largest revenue block and simultaneously registers the fastest regional growth, reflecting scale economics and coordinated industrial policy. Crystalline-structure ceramics dominate current shipments, especially in military optics, yet cost-advantaged glass-ceramic variants are closing ground as consumer electronics brands pivot to scratch-resistant, high-clarity covers. Material leadership resides with sapphire, but aluminum oxynitride’s ballistic performance is allowing it to seize design-in wins for next-generation infrared (IR) windows on hypersonic platforms. The competitive field, while moderately consolidated, is tilting toward vertical integration as players race to secure rare-earth inputs and proprietary sintering know-how, lowering unit costs and unlocking capacity for high-volume sectors such as dental implants and LED lighting.
Key Report Takeaways
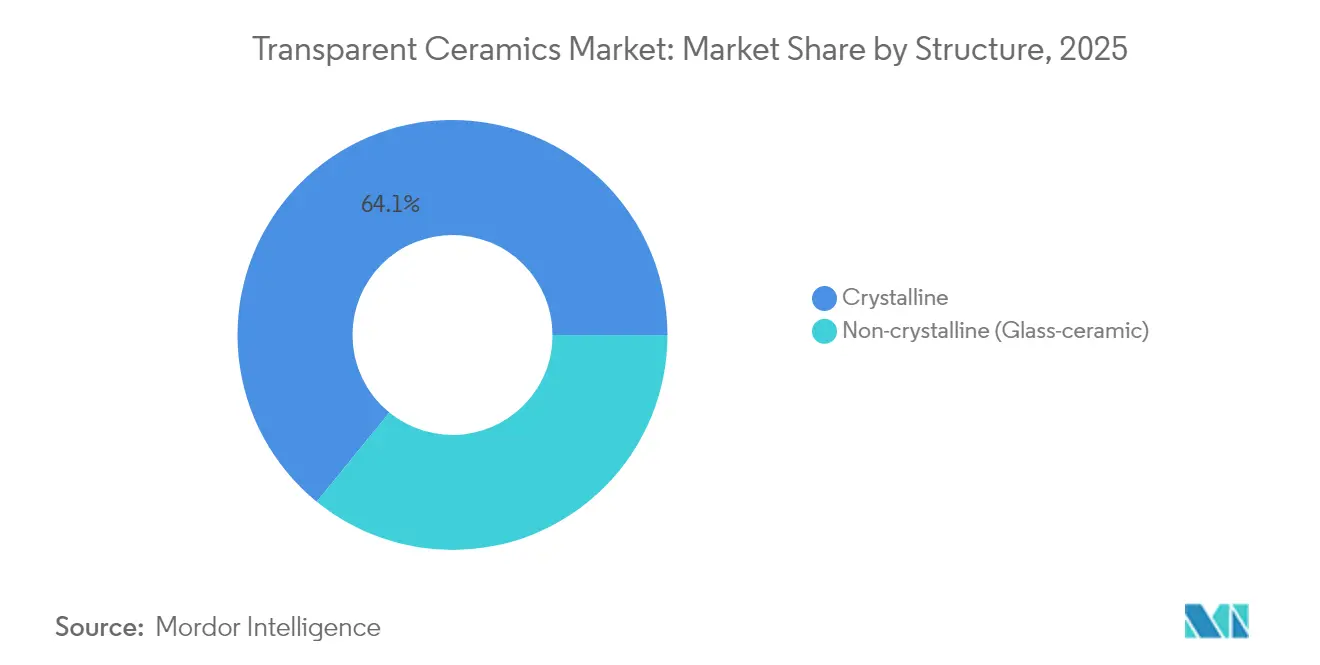
- By structure, crystalline ceramics held 64.12% of the 2025 transparent ceramics market share, whereas non-crystalline formats are forecast to expand at a 12.58% CAGR through 2031.
- By material, sapphire captured 42.74% share of the transparent ceramics market size in 2025; aluminum oxynitride is set to grow at 12.66% CAGR to 2031.
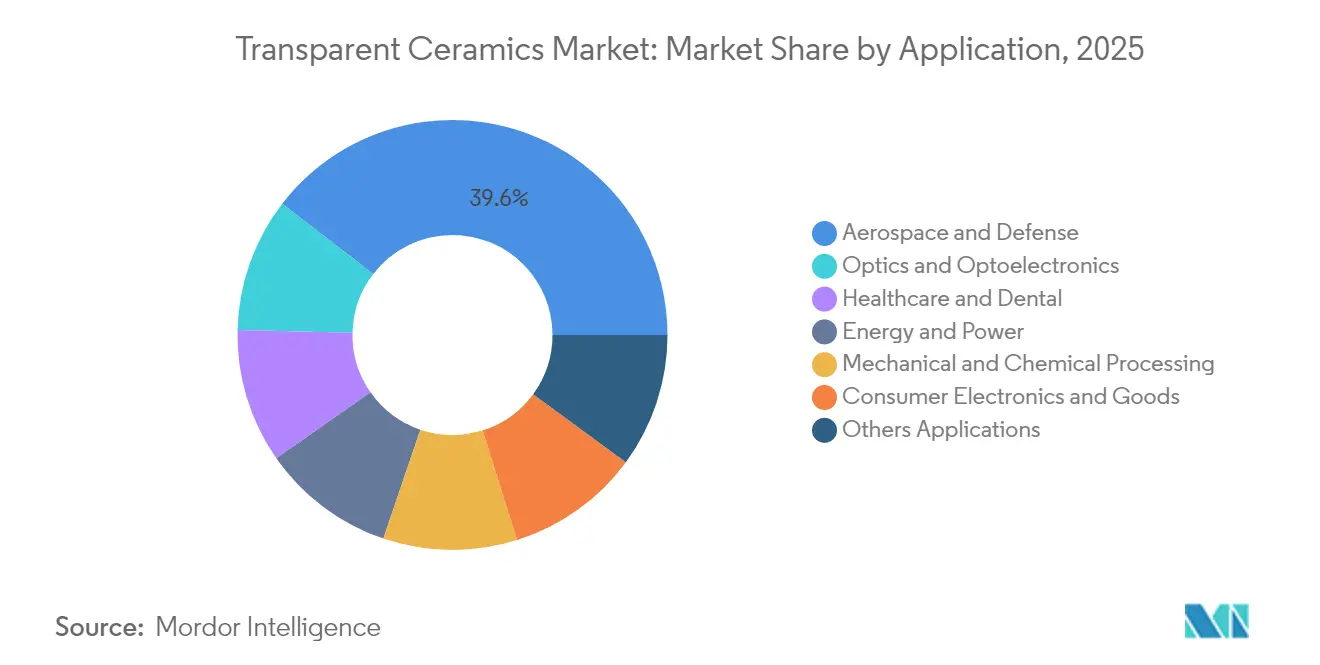
- By application, aerospace & defense accounted for 39.55% of the transparent ceramics market share in 2025, while healthcare and dental are advancing at 13.28% CAGR to 2031.
- By region, Asia Pacific led with 56.12% revenue share in 2025; the same region is forecast to accelerate at a 13.95% CAGR through 2031.
Note: Market size and forecast figures in this report are generated using Mordor Intelligence’s proprietary estimation framework, updated with the latest available data and insights as of 2026.
Market Trends and Insights
Drivers Impact Analysis of Transparent Ceramics Market*
| Driver | (~) % Impact on CAGR Forecast | Geographic Relevance | Impact Timeline |
|---|---|---|---|
| Accelerating usage in optics & optoelectronics | +3.20% | Global, with concentration in Asia Pacific and North America | Medium term (2-4 years) |
| Growing demand from aerospace & defense | +2.80% | North America, Europe, Asia Pacific | Long term (≥ 4 years) |
| Advanced Ceramics Increasingly Replacing Plastics and Metals | +2.10% | Global | Medium term (2-4 years) |
| Fusion-grade high-power ceramic lasers | +1.90% | North America, Europe | Long term (≥ 4 years) |
| Rising use of transparent ceramics in IR domes for hypersonic vehicles | +1.60% | North America, Asia Pacific | Long term (≥ 4 years) |
| Source: Mordor Intelligence | |||
Accelerating Usage in Optics & Optoelectronics
Laser-driven manufacturing, lidar, and photonic-integrated circuits are fueling record off-take for high-purity, low-defect transparent ceramics. Titanium:sapphire-on-insulator prototypes have delivered compact layouts that cut system footprints while boosting power density, signaling commercial feasibility for wafer-level laser arrays. Ce-doped garnet ceramics now demonstrate luminance saturation thresholds of 65 W mm-2, offering durable, thermally stable alternatives to single-crystal gain media in LED backlights and industrial lasers. The transparent ceramics market is, therefore, intertwined with broadband communications, where miniaturization pressures amplify the value of materials that can survive intense photon flux and elevated junction temperatures.
Growing Demand from Aerospace & Defense
Transparent ceramics meet the dual mandate of optical transmission and high-temperature resilience imposed by supersonic aircraft, missile seekers, and satellite sensor windows. Porous Si₃N₄ radomes have reached 56% porosity while preserving mechanical integrity, trimming overall weight for long-range interceptors[1]. Transparent domes on hypersonic glide bodies must tolerate 2,000 °C skin temperatures; AlON and spinel exceed such thresholds while resisting thermal shock. U.S. federal roadmaps name these ceramics as cornerstone materials for resilient energy weapon optics and directed-energy systems[2]. Substitution away from germanium windows further elevates the transparent ceramics market, alleviating strategic mineral supply risk through chalcogenide glass derivatives that match sensor bandwidth needs.
Advanced Ceramics Increasingly Replacing Plastics and Metals
Automakers, consumer-electronics brands, and industrial OEMs are phasing in ceramic parts where polymers warp or metals corrode. Transparent ceramics resist thermal cycling, harsh chemicals, and abrasion, making them suitable for EV battery seals, smartphone camera covers, and high-visibility machinery guards. Experiments with titania-based nano screens promise wall-scale displays at one-tenth of OLED cost, translating to large-volume glass-ceramic substrates in next-generation public information panels. Additive-manufactured alumina parts cut tool-change downtime in semiconductor etchers, replacing coated metals that suffer plasma erosion.
Fusion-Grade High-Power Ceramic Lasers
Commercial-fusion timelines are compressing, pivoting the transparent ceramics industry toward specialty optics that endure megajoule pulse regimes. Laser World of Photonics 2025 showcased supply-chain gaps in diode pump arrays and beam-combiner windows, with ceramic slabs offering higher damage thresholds than glass lenslets. Fluoride-based transparent ceramics have achieved visible lasing at 605 nm under room temperature, hinting at cost-effective beamline components for inertial-confinement reactors. Research into ultra-high-temperature ceramics processed via laser melting has yielded compositions that withstand 4,000 °C, positioning them for first-wall panels and diagnostic ports in tokamak environments.
Restraints Impact Analysis of Transparent Ceramics Market*
| Restraint | (~) % Impact on CAGR Forecast | Geographic Relevance | Impact Timeline |
|---|---|---|---|
| High production cost | -2.40% | Global | Short term (≤ 2 years) |
| Manufacturing complexity & yield losses | -1.80% | Asia Pacific, North America | Medium term (2-4 years) |
| Sustainability issues in rare-earth mining | -1.20% | Global, particularly China and Africa | Long term (≥ 4 years) |
| Source: Mordor Intelligence | |||
High Production Cost
Transparent ceramics require high-purity feedstocks and multi-stage sintering profiles that push furnace dwell times and electricity usage well above standard tile or structural ceramics. Two-step sintering raises density but demands precision thermal ramps, while diamond-wheel finishing of sapphire parts adds capex for high-RPM spindles and coolant systems. Industry carbon-footprint scrutiny is accelerating shifts to green hydrogen kilns, but near-term conversion expenses weigh on margins.
Manufacturing Complexity & Yield Losses
Yield attrition stems from micro-porosity, inclusions, and residual stress. Spark plasma sintering can collapse these defects, yet the technique calls for bespoke dies and tight vacuum control that inflate maintenance overheads. Laser additive routes sometimes cause cellular-solid microstructures harboring dislocations that undermine optical throughput[3]. Oxygen-vacancy management in indium gallium zinc oxide electrodes illustrates the broader hurdle: unmitigated vacancies shift carrier mobility, compromising electro-optic response. Thermal gradients during laser polishing of quartz pieces can spike to 940 °C in milliseconds, necessitating intricate scan-path algorithms to stave off craze lines.
*Our forecasts treat driver/restraint impacts as directional, not additive. The impact forecasts reflect baseline growth, mix effects, and variable interactions.
Transparent Ceramics Market Segment Analysis
By Structure:
Crystalline Dominance Drives Defense ApplicationsCrystalline variants secured 64.12% transparent ceramics market share in 2025, validated by consistently higher transmission in the 0.3–5 μm band and compressive strengths above 2 GPa. Fine-grain sapphire domes and YAG laser slabs illustrate the segment’s versatility across radomes and solid-state lasers. Non-crystalline glass-ceramics, conversely, capitalized on agile melt-casting lines and lower scrap rates, capturing handset lens covers and smart-watch backplates. Their 12.58% CAGR underscores demand elasticity in price-sensitive consumer channels.
Cordierite glass-ceramics that combine 82.3% transmittance with sub-2.6 ppm °C-1 thermal expansion pave the way for monolithic mobile screens that forego polymer lamination. Meanwhile, advanced nucleant systems—P₂O₅ + ZrO₂ + TiO₂—shift crystallization to the bulk, enhancing mechanical tensile strength without sacrificing clarity. Spark plasma sintering reduces processing windows from hours to minutes, halving energy input and shrinking grain boundaries to suppress scattering.

By Material:
Sapphire Leadership Challenged by AlON InnovationSapphire’s 42.74% grip on revenues owes to mature Kyropoulos and edge-defined film-fed growth furnaces that scale boules up to 300 kg, lowering per-substrate cost for LED wafers and smartphone optics. Aluminum oxynitride, however, is registering 12.66% CAGR as missile OEMs specify lighter, tougher IR windows. Surmet’s ALON blanks show flexural strengths near 400 MPa, a substantial margin over spinel. Yttrium aluminum garnet still anchors DPSS laser cavities, while spinel (MgAl₂O₄) wins ballistic-window programs.
Alpha HPA’s commissioning of 5N-purity sapphire growth units signals the ongoing expansion of legacy material supply. At the same time, exploratory transparent AlN ceramics emerge from plasma-assisted deposition, offering 320 W m-1 K-1 thermal conductivity, which could disrupt high-flux lidar arrays. Yttria-stabilized zirconia is surging in zirconia-based dental crowns, blending translucency with load-bearing capacity. Rare-earth-doped garnets are penetrating micro-LED displays, where pulse width modulation demands rapid phosphor decay.
By Application:
Healthcare Growth Accelerates Beyond Aerospace DominanceAerospace & defense contributed 39.55% of sector turnover in 2025, valued at more than USD 352 million, anchored by seeker windows, armor-grade viewports, and laser weapon optics. The transparent ceramics market size addressed by aerospace is set for high-single-digit CAGR as hypersonic and counter-UAS programs proliferate. Healthcare and dental, however, outpace all segments at 13.28% CAGR; transparent zirconia implants cut peri-implantitis risk while meeting aesthetic expectations.
Ceramic femoral heads exhibit 1439 ± 62 HV1 hardness, translating to reduced wear debris and longer prosthesis lifespans. Intraoral scanners now integrate optical blocks cast from spinel to withstand autoclave cycles. Consumer electronics absorb volumes of scratch-immune sapphire lenses, with multi-camera phone architectures magnifying unit demand. Energy applications are taking shape, where spectral-conversion ceramic layers up-shift photons, enhancing c-Si solar output by 7–9%.
Geography Analysis
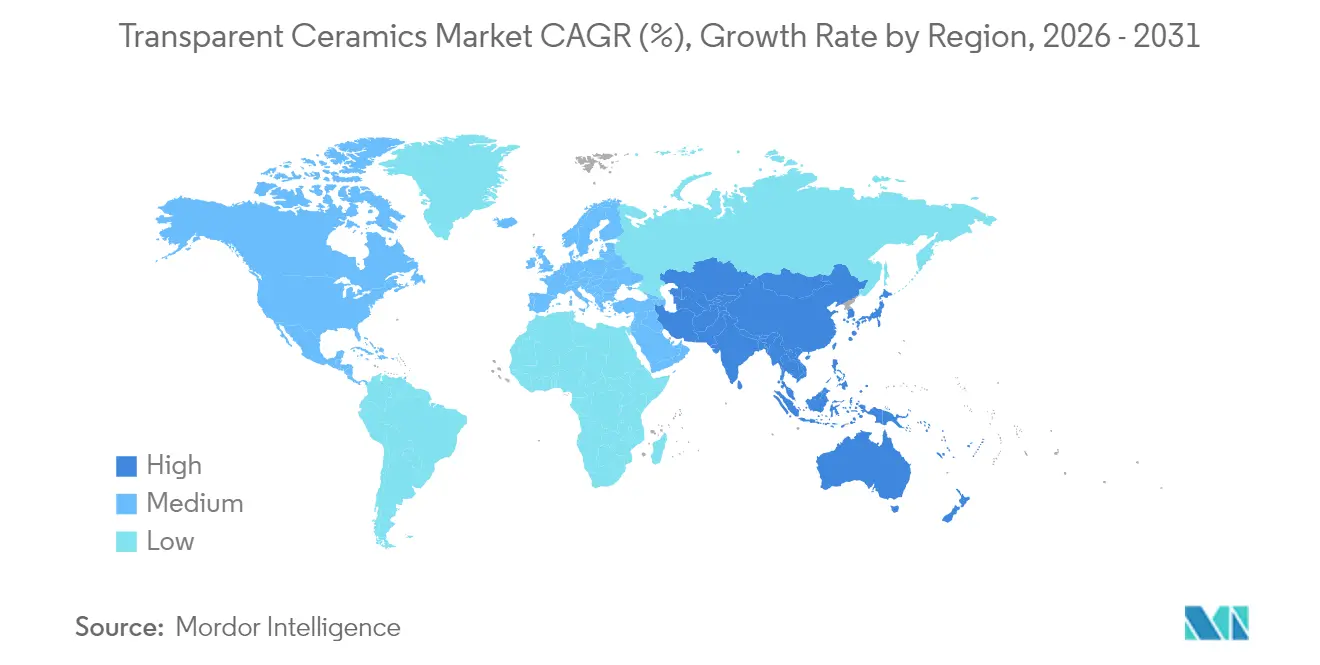
APAC Transparent Ceramics Market
Asia Pacific controlled 56.12% of 2025 sales, buoyed by entrenched sapphire boules in Hunan and wide-aperture AlON plates in Nagoya. Government stimulus for local semiconductor etching and display fabs furnishes anchor demand, while export-oriented defense conglomerates in China adopt spinel domes for next-generation ISR drones. By 2031, the region is poised to generate significant incremental revenue, growing at a rate of 13.95% CAGR. South Korea’s nano transparent screen initiative cuts per-inch costs to one-tenth of OLED, broadening addressable display footprints and deepening local supply chains.
North America Transparent Ceramics Market
North America remains the technology vanguard, leveraging DARPA and DoE grants to demonstrate directed-energy laser couplers and fusion-grade optics. LightPath Technologies is substituting BDNL4 chalcogenide glass for germanium, insulating the defense base from geopolitical risk. Mexico’s electronics maquiladoras integrate glass-ceramic heat spreaders into power modules, signaling outward regional diffusion of advanced materials.
EMEA Transparent Ceramics Market
Europe positions itself on value-added, low-carbon production. SCHOTT’s EUR 450 million capital program includes a hydrogen-fired float line that delivered its first CO₂-neutral glass in 2024, validating feasibility for ceramic sintering kilns. Germany’s Ceramic Composites network targets a doubling of oxide-fiber throughput by 2025, critical for ceramic-matrix composites in aerospace turbines. The Middle East and Africa record nascent but strategic uptake, especially in concentrated solar power fields where dust-resistant, IR-transparent shields elongate heliostat lifetimes.
Value Chain Analysis
Upstream value creation is driven by high-purity ceramic feedstocks and dopants, including alumina (Al2O3), aluminum oxynitride (AlON), magnesium aluminate spinel (MgAl2O4), and yttrium aluminum garnet (YAG). Supplier performance is typically tied to impurity control and powder characteristics, which determine optical transmission after densification, as well as access to specialty processing inputs (high-temperature furnaces, vacuum systems, and precision tooling) that support defect suppression across powder preparation, compaction, and sintering.
Midstream manufacturing is the main cost and yield gate. Multi-stage sintering requires tight control of crystallization and grain growth to avoid devitrification, inclusions, and bubble formation, followed by precision shaping and finishing (grinding, lapping, and polishing) to meet optical and ballistic specifications. Process innovations such as Spontaneous Coagulation Casting (SCC) for complex geometries (demonstrated for large spinel parts up to 470 mm by 235 mm by 10 mm) and the use of machine learning with particle swarm optimization to shorten armor-structure design cycles shift competitive advantage toward players that can industrialize reproducible, low-defect throughput. Downstream, transparent ceramics are integrated into application-specific systems by defense glazing and sensor-window system houses, laser and LED optics suppliers, and medical and dental device OEMs, where qualification cycles, ballistic and optical testing, and tight dimensional tolerances influence procurement and supplier lock-in.
Competitive Landscape
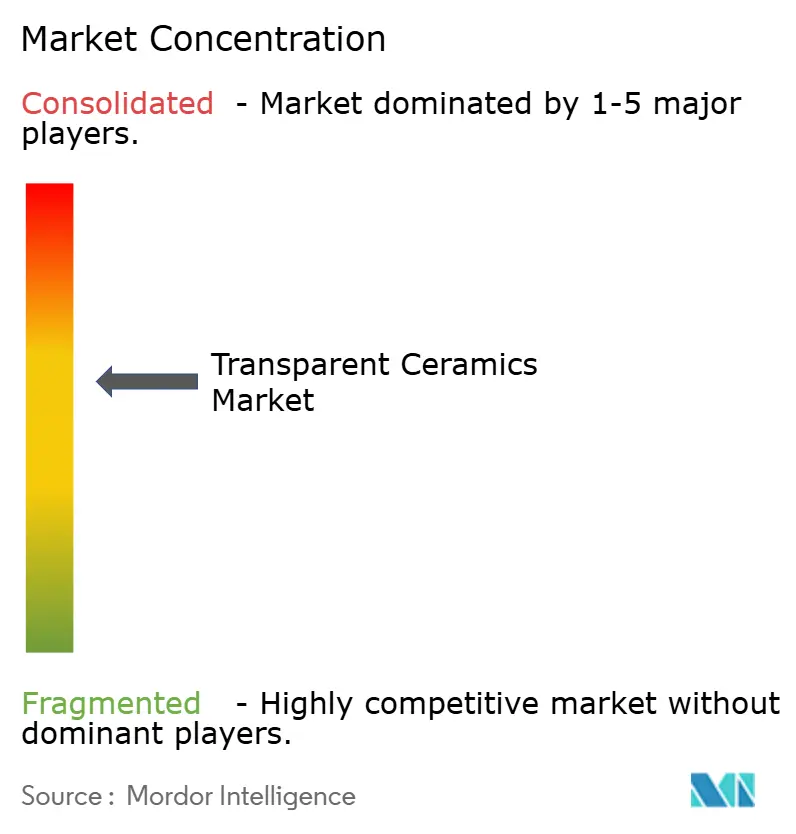
The transparent ceramics market features a moderate degree of consolidation: the top five producers—SCHOTT AG, CoorsTek Inc., Surmet Corporation, CeramTec GmbH, and AGC Inc.—collectively hold roughly 53% of global turnover. These incumbents intensify vertical integration, acquiring powder-feedstock firms and kiln-component suppliers to lock in price stability and proprietary grain-growth modifiers. CoorsTek has paired spark plasma sintering with high-purity alumina feed to lift yields by 18%, while Surmet scales 40-inch ALON blanks for next-generation airborne sensors.
New entrants in China and South Korea exploit scale economies and domestic rare-earth deposits, narrowing cost gaps in sapphire wafers and glass-ceramic lens covers. IP portfolios, rather than capacity alone, are becoming decisive: SCHOTT’s zero-lead alumino-silicate filed patents on hydrogen-assisted melt pools, granting an ecological differentiator. Strategic alliances abound; Kyocera’s 2024 accord with Kyoto Sangyo University transfers cordierite mirror recipes into telescope OEMs, ensuring application-focused feedback loops.
Competitive intensity also rises from cross-industry incursions. LED epitaxy giants begin backward integration into sapphire growth, while defense primes establish joint ventures for in-house AlON finishing. Supply security for yttrium and terbium oxides influences procurement decisions, giving miners with ESG-compliant extraction an upstream bargaining chip.
Transparent Ceramics Industry Leaders
-
Surmet Corporation
-
CoorsTek Inc.
-
SCHOTT AG
-
CeramTec GmbH
-
AGC Inc.
- *Disclaimer: Major Players sorted in no particular order
Transparent Ceramics Market Companies Covered in this Report
- AGC Inc.
- CeramTec GmbH
- CILAS
- CoorsTek Inc.
- Deisenroth Engineering GmbH
- Fraunhofer IKTS
- General Electric
- II-VI Optical Systems
- Konoshima Chemical Co. Ltd
- Kyocera Corporation
- Meller Optics Inc
- Murata Manufacturing
- OptoCity Inc.
- Philips Lighting Holdings
- Raytheon Technologies (RTX)
- Saint-Gobain Group
- SCHOTT AG
- Surmet Corporation
Market Opportunities and Future Outlook
A clear opportunity is the expansion of system-level offerings in transparent armor and protective optical windows. Buyers increasingly evaluate complete assemblies rather than monolithic ceramic blanks, which gives vertically integrated suppliers more room to capture value through coatings, lamination, and qualification support for defense and aerospace programs. SCHOTT has highlighted assembled optical protective windows, including U.S.-manufactured versions, and has positioned transparent armor capability through its DiamondView Armor Products ownership.
Manufacturing and materials innovations also create openings in larger form factors and more complex shapes. The U.S. Naval Research Laboratory has reported progress in spinel sintering for larger and uniquely shaped transparent armor components, and research activity includes new transparent ceramic families such as transparent cubic silicon nitride (c-Si3N4) synthesized under high pressure and heat, along with pressureless crystallization routes for YAG-based nanoceramic fibers. At the same time, consumer-device durability requirements support demand for glass-ceramic cover materials, including Corning's March 2026 launch of Gorilla Glass Ceramic 3, which puts additional cost, yield, and surface-finish throughput pressure on transparent ceramic producers for higher-volume applications.
Recent Industry Developments in Transparent Ceramics Market
- May 2026: Montana State University issued a notice of intent to sole source Surmet Corporation for development of aluminum oxynitride (ALON) tiles, ballistic testing, and V50 data generation. The workstream formalizes demand for repeatable ALON tile performance data, supporting qualification pathways for transparent ceramic armor and sensor-window programs.
- April 2026: SCHOTT North America introduced assembled protective windows manufactured entirely in the United States. This update supports SCHOTT's transparent protection products in meeting domestic sourcing requirements and strengthens delivery control from materials through finished assemblies for defense and high-reliability optical applications.
- August 2024: Fraunhofer IKTS opened Europe’s first R&D center for transparent ceramics in Hermsdorf, Thuringia. The facility expands European pilot and partner-development capacity for transparent ceramic materials and processes, accelerating the translation of lab-scale advances into industrial qualification programs.
Transparent Ceramics Market Report Scope and Research Methodology
Market Definition and Coverage
For this study, the market is defined as revenue generated from transparent ceramic materials that transmit light and are engineered into functional components for optics, protective windows, and other high performance uses.
Scope exclusions: We exclude conventional glass and polymer optics, and we also exclude standard non-transparent technical ceramics that do not meet optical transmission requirements.
Segments Covered in This Report
- By Structure
- Crystalline
- Non-crystalline (Glass-ceramic)
- By Material
- Sapphire (Al₂O₃)
- Yttrium Aluminum Garnet (YAG)
- Aluminum Oxynitride (AlON)
- Spinel (MgAl₂O₄)
- Yttria-stabilized Zirconia (YSZ)
- Other Advanced Materials
- By Application
- Optics and Optoelectronics
- Aerospace and Defense
- Mechanical and Chemical Processing
- Healthcare and Dental
- Consumer Electronics and Goods
- Energy and Power
- Others Applications
- By Geography
- Asia Pacific
- China
- Japan
- India
- South Korea
- Australia and New Zealand
- ASEAN countries
- Rest of Asia Pacific
- North America
- United States
- Canada
- Mexico
- Europe
- Germany
- United Kingdom
- France
- Italy
- NORDIC
- Russia
- Rest of Europe
- South America
- Brazil
- Argentina
- Rest of South America
- Middle East and Africa
- Saudi Arabia
- UAE
- South Africa
- Egypt
- Nigeria
- Rest of Middle East and Africa
- Asia Pacific
Data Sources, Market Sizing, and Validation
Desk Research
Desk work started by mapping the material and application universe for transparent ceramics, then building a short list of demand signals that can be checked year after year. Public sources were used to anchor the model with directional volume and activity indicators, such as government trade statistics, customs and tariff databases, and defense and aerospace procurement releases.
We also reviewed technical publications and standards related to optical transmission and material performance, including peer reviewed journals, patent databases, and websites of relevant trade associations. To understand pricing direction and capacity narratives, we cross-checked company filings, investor presentations, and reputable press coverage, then blended those inputs with paid subscriptions for company financials and news intelligence. Where product descriptions were specific enough, we also used an import and export shipment-level database. The sources listed here are illustrative, and additional public references were used throughout the work for data collection, validation, and clarification.
Primary Interviews and Surveys
Primary work focused on interviews and short surveys with material suppliers, component manufacturers, distributors, and downstream users in optics, aerospace and defense, and electronics. The discussions were used to confirm where transparent ceramics are actually specified, to validate typical selling price movement by material, and to pressure-test adoption timelines across APAC, EMEA, and the Americas.
Distribution of primary research fieldwork respondents
| Company type | Respondent position | Region |
|---|---|---|
| Top tier: 29% | CXOs: 15% | APAC: 42% |
| Mid tier: 54% | Functional/Unit leaders: 34% | EMEA: 36% |
| Smaller Players: 17% | Managers: 51% | Americas: 22% |
Market-Sizing & Forecasting
Sizing was built using a mix of top-down and bottom-up checks. A top-down demand pool was reconstructed first from application activity, such as defense and aerospace optical window demand, optoelectronics output trends, and healthcare device production signals. Totals were then adjusted using selective bottom-up approximations.
For the bottom-up checks, we used sampled revenue disclosures where available, distributor channel checks, and a volume times average selling price approach for a few well understood use cases.
The model used market-specific inputs such as estimated adoption of sapphire and other transparent ceramic materials, average thickness and yield assumptions for optical-grade parts, and capacity expansion and utilization narratives from producers. Pricing direction by material family was also incorporated, including how higher purity grades typically move differently than standard grades. Forecasting relied mainly on scenario analysis because demand is tied to uneven program cycles in aerospace and defense and design-in timing in consumer electronics. The scenarios were aligned to what primary respondents considered a realistic ramp. Where direct bottom-up data was patchy, gaps were handled using conservative penetration ranges, then cross-checked by comparing the implied per-unit material value with what buyers reported paying in recent procurement cycles.
Data Validation & Update Cycle
Validation was done through multiple passes where outputs were compared against independent signals. For example, we checked whether implied pricing stayed consistent with stated purity and performance requirements, and whether the regional split matched observed manufacturing and procurement activity. Outliers were flagged early. When a variance could not be explained by mix or timing, we re-contacted respondents to confirm the assumption driving the swing.
Before sign-off, the model and key assumptions go through analyst reviews focused on coherence across applications, materials, and geography. We also check continuity across years in the final numbers. The report is refreshed annually, and interim updates are made when material events occur, such as major capacity changes or demand shocks. Right before delivery, a final review is run so the client receives the most current view that can be supported by the tracked inputs.
Mordor Intelligence's Transparent Ceramics Market Size Compared With Other Published Estimates
Published market sizes for transparent ceramics do not always match. The gap usually comes from differences in what gets counted, which year is treated as the current value, and how pricing is projected as materials shift. The timing of updates also matters because this space can move quickly when new programs scale and when capacity comes online.
Conventional glass optics and polymer windows are outside Mordor Intelligence's scope, which tends to keep the number tighter than estimates that bundle adjacent optical materials into one total. Differences also show up when other figures use 2024 as the base year, apply aggressive price curves for advanced grades, or assume faster penetration into consumer electronics without validating design-in cycles through interviews. Currency conversion timing, and whether the work is anchored on component demand signals versus broader materials revenue, can further widen the spread.
Benchmark comparison
| Source | Market Size | Gaps in Research Methodology |
|---|---|---|
| Mordor Intelligence | USD 1.00 B (2026) | |
| Trade Publisher A | USD 667.00 M (2024) | Uses an earlier base year and a longer forecast window, and the scope appears broader across end uses, which can pull in adjacent revenue pools and make cross-year comparisons harder. |
| Industry Research Group B | USD 1.02 B (2024) | Builds from a 2024 starting point and applies a higher growth path, and the inclusion rules by material and end use are less transparent, which can overstate near-term adoption in program-driven applications. |
Taken together, the table shows that year selection and what is included as transparent ceramics explain most of the spread. By keeping the model traceable to a few repeatable demand signals, and then cross-checking with price and adoption inputs from interviews, the final estimate stays balanced and easier to reconcile across updates.
Key Questions Answered in the Report
What is the current transparent ceramics market size and growth outlook?
The transparent ceramics market size stands at USD 1 billion in 2026 and is projected to reach USD 1.79 billion by 2031, advancing at a 12.36% CAGR driven by aerospace, defense, and optoelectronics demand.
Which region dominates transparent ceramics demand?
Asia Pacific leads with 56.12% revenue share in 2025 and is also the fastest-growing region, expanding at 13.95% CAGR through 2031 on the back of semiconductor and aerospace investments.
Why is aluminum oxynitride attracting attention?
Aluminum oxynitride combines optical transparency with ballistic resistance, enabling lighter IR domes for hypersonic vehicles and achieving the fastest material-segment CAGR of 12.66%.
How are transparent ceramics penetrating healthcare?
Transparent zirconia implants and dental crowns exhibit high hardness and biocompatibility, propelling healthcare applications at a 13.28% CAGR, the quickest among end-use segments.
Which companies hold key positions in the transparent ceramics industry?
SCHOTT AG, CoorsTek Inc., Surmet Corporation, CeramTec GmbH, and AGC Inc. constitute the core leadership group, jointly accounting for about 53% of global revenue.