
Perlite Market Size and Share
Market Overview
| Study Period | 2020 - 2031 |
|---|---|
| Market Size (2026) | USD 2.59 Billion |
| Market Size (2031) | USD 3.41 Billion |
| Growth Rate (2026 - 2031) | 5.70 % |
| Fastest Growing Market | Asia Pacific |
| Largest Market | Asia Pacific |
| Market Concentration | Medium |
Major Players *Disclaimer: Major Players sorted in no particular order Image © Mordor Intelligence. Reuse requires attribution under CC BY 4.0. | |
Perlite Market Analysis by Mordor Intelligence
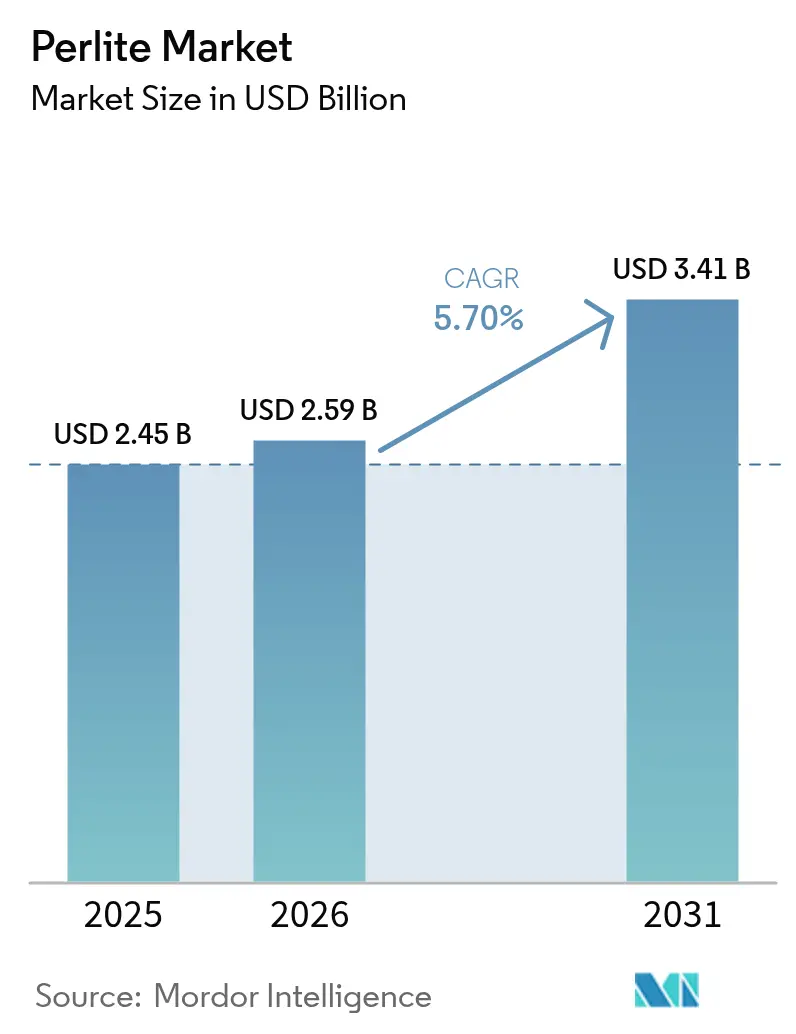
The Perlite Market size was valued at USD 2.45 billion in 2025 and estimated to grow from USD 2.59 billion in 2026 to reach USD 3.41 billion by 2031, at a CAGR of 5.70% during the forecast period (2026-2031). The outlook reflects strong demand for lightweight aggregates in energy-efficient construction, horticulture, precision filtration and cryogenic insulation. Construction codes that tighten thermal-performance benchmarks, especially in Europe and North America, reinforce volume growth, while rapid urbanization in the Asia Pacific creates large-scale infrastructure demand. Specialty grades for cryogenic storage, craft-beverage filtration and cosmetics deliver higher margins and anchor product innovation. Supply remains adequate because of abundant volcanic ore in Turkey and the United States, yet logistics costs influence regional pricing differentials.
Key Report Takeaways
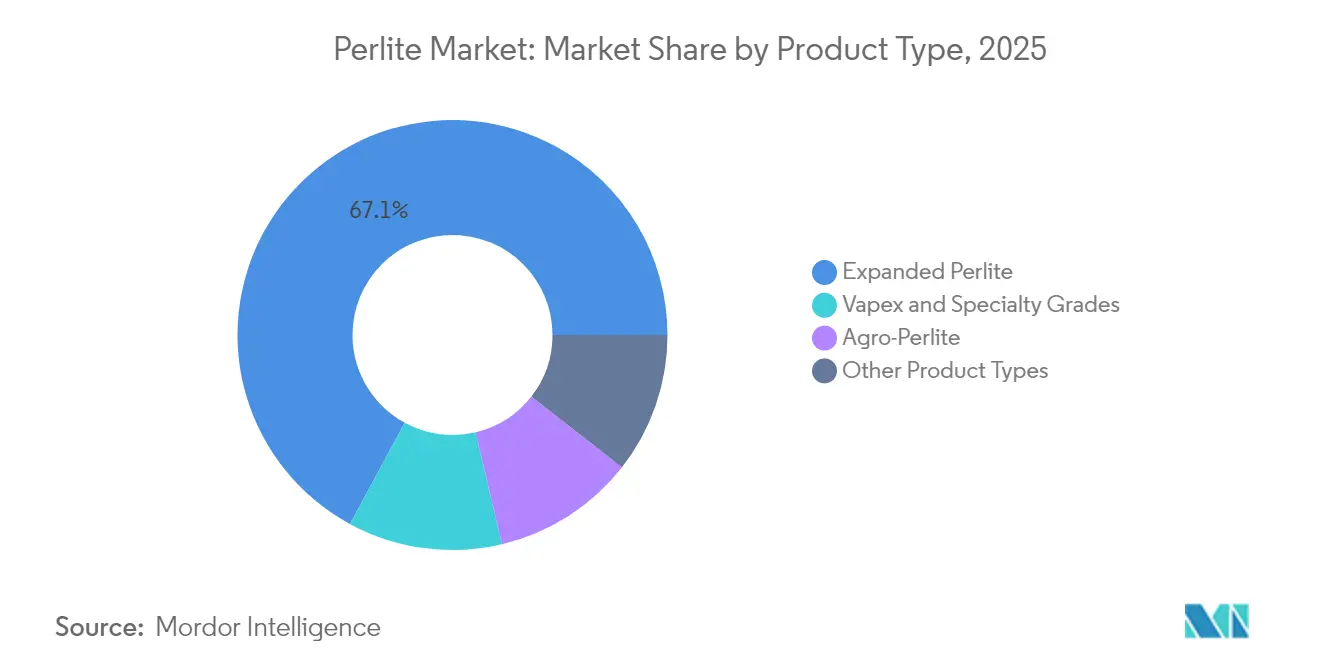
- By product type, Expanded Perlite led with 67.08% of the Perlite market share in 2025, while Vapex & Specialty Grades recorded the highest projected CAGR at 6.35% through 2031.
- By application, insulation accounted for 42.95% of the Perlite market size in 2025 and soil amendment/horticulture is advancing at a 5.90% CAGR to 2031.
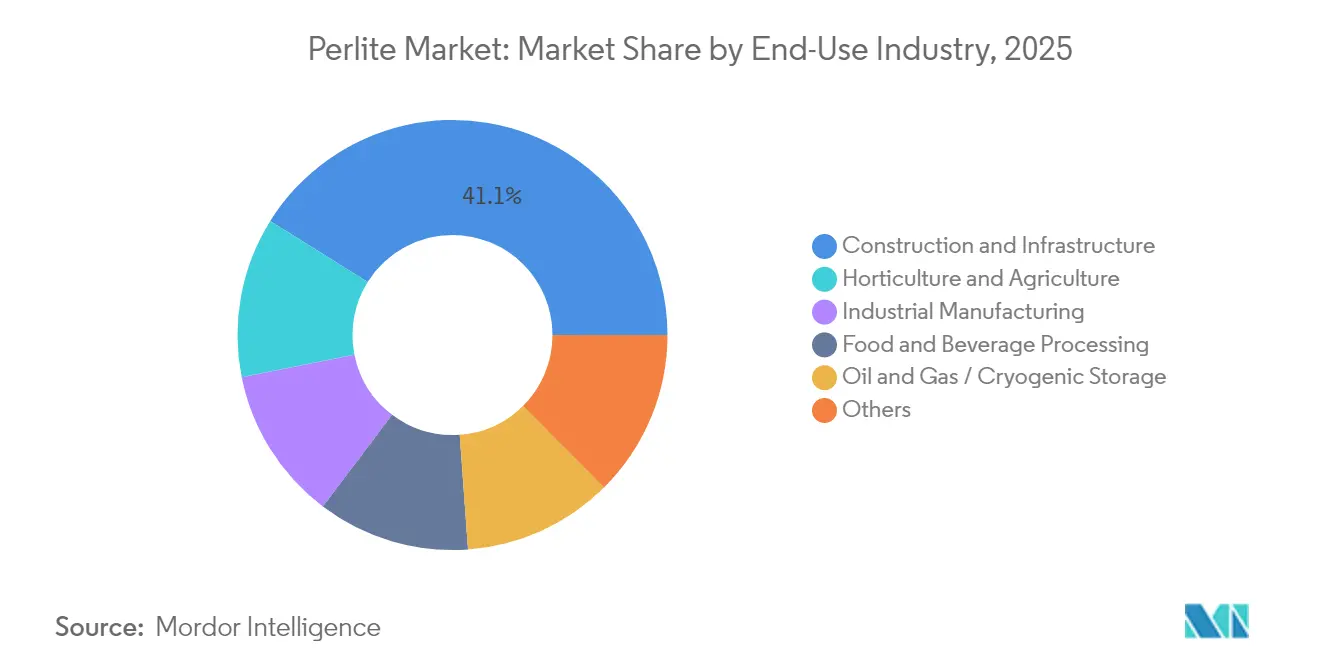
- By end-use industry, construction & infrastructure captured 41.10% revenue in 2025; horticulture & agriculture posts the fastest 6.02% CAGR through 2031.
- By geography, Asia Pacific held 48.30% revenue in 2025 and is expanding at a 6.78% CAGR, outpacing all other regions.
Note: Market size and forecast figures in this report are generated using Mordor Intelligence’s proprietary estimation framework, updated with the latest available data and insights as of 2026.
Global Perlite Market Trends and Insights
Drivers Impact Analysis*
| Driver | (~) % Impact on CAGR Forecast | Geographic Relevance | Impact Timeline |
|---|---|---|---|
| Growth in Lightweight Construction Demand | +1.2% | Global, with concentration in Asia Pacific and Europe | Medium term (2-4 years) |
| Horticulture & Hydroponics Adoption Boom | +0.8% | North America, Europe, and urban Asia Pacific | Long term (≥ 4 years) |
| Rising Metallurgical Insulation Requirements | +0.6% | Global, particularly in industrial regions | Medium term (2-4 years) |
| Energy-efficient Building Codes Tightening | +0.4% | Europe, North America, with spillover to Asia Pacific | Long term (≥ 4 years) |
| Expansion of Craft-beverage Filtration | +0.3% | North America, Europe | Short term (≤ 2 years) |
| Source: Mordor Intelligence | |||
Growth in Lightweight Construction Demand
Perlite concrete and plasters lower structural load without sacrificing thermal performance, enabling taller buildings on smaller foundations [1]PMC Staff, “Mechanical Characteristics of Lightweight Perlite Concrete,” pubmed.ncbi.nlm.nih.gov. Transportation savings arise because expanded particles weigh up to 80% less than sand and gravel. Modular building factories increasingly specify Perlite-enhanced panels to shorten on-site assembly time and meet stringent thermal-bridge limits. Prefabrication lines benefit from the mineral’s consistency, which improves batching accuracy and reduces rejects. Long-term urbanization in China, India and the ASEAN bloc positions the Perlite market as a preferred source of lightweight aggregates for sustainable, high-rise construction.
Horticulture & Hydroponics Adoption Boom
Controlled-environment farms value Perlite for sterile, pH-neutral, reusable substrates that retain moisture while preventing root rot. Commercial greenhouses in the United States and the Netherlands report yield gains when Perlite replaces peat-heavy mixes. Vertical-farm operators choose coarse grades that allow automated fertigation systems to maintain precise oxygen levels. Specialty growers of medical cannabis pay premium prices for ultra-clean grades certified for pharmaceutical cultivation. Expanding urban agriculture in Southeast Asia positions local processors to supply fresh media without high freight costs, underpinning regional Perlite market demand.
Rising Metallurgical Insulation Requirements
Cryogenic tanks for Liquidated Natural Gas (LNG), industrial gases and hydrogen storage rely on Perlite loose-fill insulation achieving thermal conductivity near 0.035 W/mK at 0°C. Steel mills and foundries specify Perlite board to line ladles and tundishes, citing resistance to thermal cycling. Semiconductor fabs in Japan and South Korea adopt ultra-pure grades for diffusion furnaces that operate above 1,000°C. Renewable-power projects add molten-salt storage units insulated with Perlite blankets to manage heat retention. Each of these applications prefers naturally inert, non-combustible materials with low shrinkage under extreme temperatures, sustaining the Perlite market across heavy industry.
Energy-efficient Building Codes Tightening
The European Union (EU) Directive 2024/1275 compels deep renovation of existing stock toward net-zero emission performance by 2050. Multiple United States states mirror stringent R-value and continuous-insulation rules, requiring high-performance cavity fillers where Perlite boards excel. Green-building certifications grant credits for low-embodied-carbon materials, a category in which Perlite scores favorably owing to simple kiln expansion and minimal processing additives. Architects designing passive-solar homes specify Perlite blocks to reduce heat transfer yet preserve daylight openings. Together these regulations lift long-run Perlite market consumption in both new-build and retrofit segments.
Restraints Impact Analysis*
| Restraint | (~) % Impact on CAGR Forecast | Geographic Relevance | Impact Timeline |
|---|---|---|---|
| Readily Available Substitutes | -0.7% | Global, particularly in cost-sensitive applications | Medium term (2-4 years) |
| Volatile Bulk-shipping Costs | -0.5% | Global, with higher impact on import-dependent regions | Short term (≤ 2 years) |
| Regional Depletion of High-grade Ore | -0.3% | Specific mining regions, particularly in Europe and North America | Long term (≥ 4 years) |
| Source: Mordor Intelligence | |||
Readily Available Substitutes
Vermiculite, rock wool, and expanded clay compete directly on weight and R-value, while glass wool often offers a lower installed cost in large-scale commercial projects. Recycled expanded polystyrene (EPS) beads gain share in light screeds that do not require high service temperatures. In filtration, engineered synthetic media achieve narrower cut-off thresholds, threatening Perlite’s position in sterile pharmaceutical lines. Horticulture faces bio-based rivals such as coconut coir that claim superior sustainability credentials. Product innovation and application support remain crucial for Perlite suppliers to defend their share in price-sensitive niches.
Volatile Bulk-shipping Costs
Turkey shipped 1.075 Million tons of crude ore in 2024, but freight from İzmir to East Asia can equal 20–30% of the landed cost when bunker fuel spikes. Expanded Perlite cannot be compressed, so the occupied container volume rises even on lower-weight cargo. Sudden port congestion or geopolitical risks in the Mediterranean disrupt regular supply lines. Producers respond by siting small-to-medium expansion plants near end-users, though those units often forfeit economies of scale. Logistics volatility, therefore, exerts an ongoing drag on Perlite market growth, particularly in import-dependent Southeast Asian nations.
*Our forecasts treat driver/restraint impacts as directional, not additive. The impact forecasts reflect baseline growth, mix effects, and variable interactions.
Segment Analysis
By Product Type: Expanded Perlite Dominance Faces Specialty Challenge
Expanded Perlite secured a 67.08% share of the Perlite market in 2025, reflecting broad acceptance in construction plasters, horticultural mixes, and industrial loose-fill insulation. Mature adoption keeps prices competitive, and suppliers emphasize logistics efficiency and ore purification to safeguard margins. Specialty producers now promote higher-density Vapex and coated grades that resist dusting inside cryogenic tanks, while cosmetic manufacturers demand finely classified powders for facial scrubs. The emerging specialty tier is projected to expand at a 6.35% CAGR to 2031, absorbing research and development (R&D) spend focused on surface functionalization.
Vapex & Specialty Grades add disproportionate value because technical thresholds govern approval in pharmaceutical filtration and space-constrained LNG modules. Processors apply silane or polymeric treatments that raise unit pricing several-fold relative to commodity expanded Perlite. Agro-Perlite maintains steady volumes in greenhouses that appreciate its balanced water-holding capacity and neutral pH. Other product types, including lump ore for foundry slag removal, occupy smaller niches yet benefit from captive customer relationships. The portfolio mix indicates a Perlite market trend toward bifurcation, high-volume commoditized insulation on one flank and low-volume, high-value engineered grades on the other.



By Application: Insulation Leadership Challenged by Emerging Uses
Insulation retained 42.95% of the Perlite market size in 2025 because national energy codes mandate thicker wall assemblies and higher attic R-values. Prefab panel makers embed expanded particles into cementitious matrices to improve fire rating without adding structural weight. Soil amendment/horticulture, however, now ranks as the fastest growth avenue at 5.90% CAGR, stimulated by hydroponic farms, vertical horticulture, and cannabis production.
Filtration & filter-aid users in craft breweries and edible-oil mills appreciate Perlite’s ability to remove particles to 4 µm while minimizing beer loss . Fire-proofing & refractory segments specify Perlite plasters that achieve up to 4-hour fire resistance. Abrasive and polishing powders occupy niche industrial jobs but yield attractive margins due to strict particle-shape specifications. Fillers for plastics and paints compete in a cost-driven arena where Perlite offers specific-gravity savings yet faces competition from hollow glass spheres.
By End-Use Industry: Construction Strength Meets Agricultural Innovation
Construction & infrastructure contributed 41.10% revenue in the Perlite market during 2025, underpinned by megaprojects in China, India, and Indonesia. Lightweight screeds and internal-partition blocks permit taller structures without overburdening foundations. Energy audits across Europe elevate demand for cavity fillers that meet strict U-value and fire-reaction classes. Horticulture & agriculture is projected to climb at a 6.02% CAGR to 2031, as greenhouse vegetables and ornamental plants seek resilient, sterile substrates that can be steam-treated between crop cycles.
Industrial manufacturing covers steel, cement, and semiconductor plants where thermal-shock resistance and chemical inertness prevail. Food & beverage processors rely on food-grade filter aids to safeguard taste and clarity in premium wines and craft beer. Oil & gas and cryogenic storage end-users insist on traceable provenance and tight conductivity ranges; these requirements limit new entrants but reward certified suppliers. Diversification across industries buffers the Perlite market against cyclical swings in any sector.
Geography Analysis
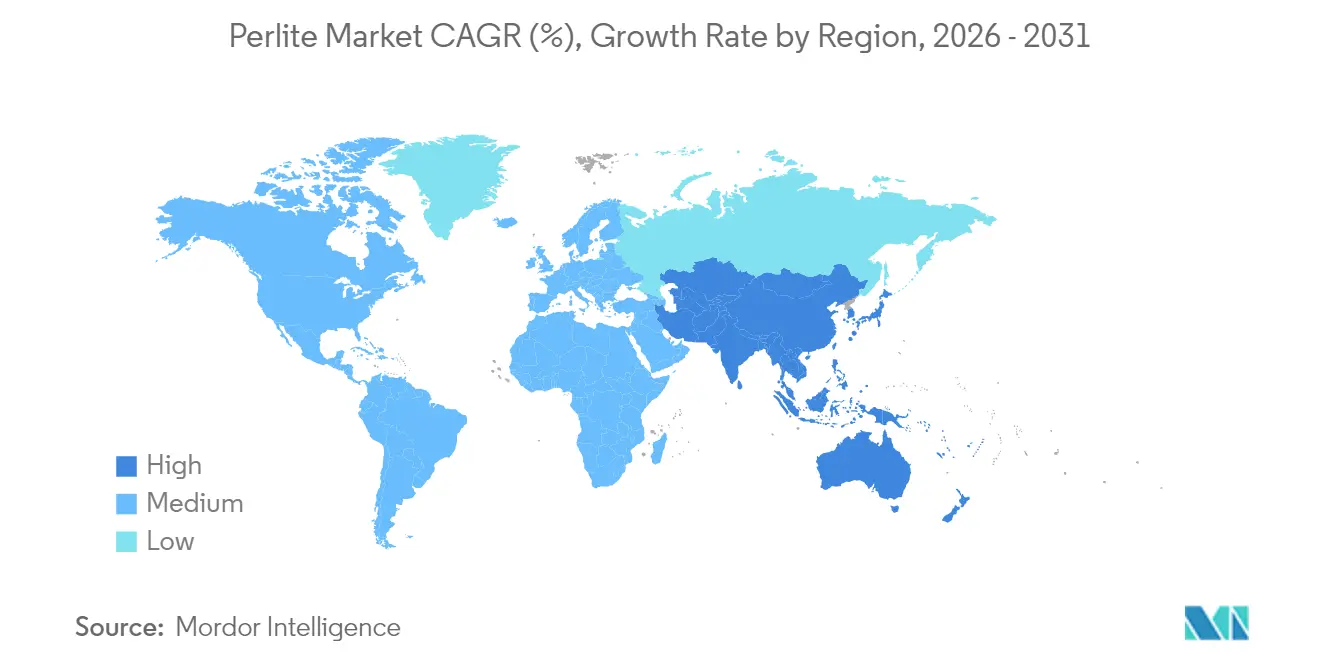
Asia Pacific accounted for 48.30% consumption in 2025 and is set to expand at a 6.78% CAGR through 2031. China’s 14th Five-Year Plan emphasizes prefabricated housing and green buildings, both heavy consumers of lightweight aggregates. India’s Smart Cities Mission funds mixed-use developments that use Perlite panels to reduce dead load and renovation timelines. Japan, South Korea, and Taiwan demand ultra-clean grades for electronics fabs and high-tech greenhouses. Domestic processors in Indonesia and the Philippines back-integrate into ore mining to reduce import reliance.
North America remains a technology and specialty-grade stronghold. United States LNG-export terminals in Texas and Louisiana consume loose-fill Perlite for 100-million-gal storage tanks, while Canadian cannabis producers buy horticultural grades in bulk. Energy codes such as American Society of Heating, Refrigerating and Air-Conditioning Engineers (ASHRAE) 90.1-2025 trigger deeper insulation retrofits, including Perlite cavity fills. Europe benefits from the EU zero-emission-building directive, with retrofit programs in Germany, France, and Italy accelerating mineral-based insulation uptake. Mediterranean ore supply from Greece and Turkey keeps landed cost competitive despite higher labor expenses.
South America and the Middle East & Africa together deliver a smaller yet strategic share. Brazil’s protected Amazon region prompts urban centers to expand vertically, favoring lightweight, low-transport-energy aggregates. Chilean lithium brine operations adopt Perlite filter aids to remove fine particulates before evaporation. Gulf Cooperation Council countries insulate LNG transshipment hubs to mitigate desert heat, and South Africa’s emerging greenhouse cluster sources horticultural Perlite to offset water scarcity. Although logistics and scale challenges persist, these regions present long-term upside for market participants that invest early.

Value Chain Analysis
The perlite value chain begins with volcanic ore extraction from reserves and producers led by China, Turkey, Greece, and the United States, which together accounted for about 92% of world mine production in 2025. Ore is then crushed and screened, beneficiated where required to control impurities, and thermally expanded in vertical furnaces at roughly 800-1,100 degrees Celsius to produce expanded perlite. China largely consumes domestic output, while Greece and Turkey act as major exporters, making seaborne logistics and port routing important determinants of landed cost for import-dependent regions.
Downstream, expanded perlite is distributed through building-material channels (loose-fill, boards, plasters), horticultural supply networks (bulk and bagged substrates), and industrial specialty distributors serving filtration, cryogenic insulation, and refractory uses. The high volume-to-value and non-compressible nature of expanded perlite often leads producers to locate expansion plants near end-use clusters to reduce freight intensity. Premium segments also rely on consistent, high-purity ore streams and tight particle-size control. Key friction points include shipping-cost volatility and longer lead times to permit, build, and commission new expansion capacity, which supports vertical integration across mining, expansion, and fabricated products for reliability and specification compliance.
Competitive Landscape
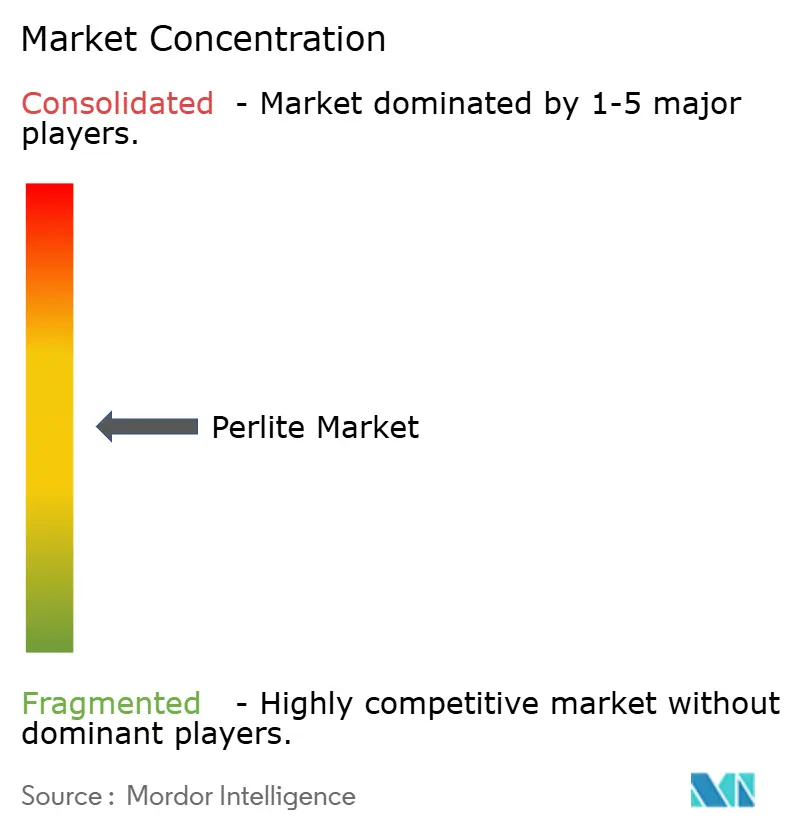
The Perlite market is moderately consolidated with the presence of major players including Imerys, Aegean Perlites SA, Çullas Construction Materials Industry and Foreign Trade Inc., Termolita S.A.P.I. de C.V., and Supreme Perlite. Imerys commands a leading volume through nine United States expansion plants and diverse European assets. Other notable participants leverage proximity to ore or end-user clusters. Vertical integration covering mining, expansion, and fabricated-board production reduces supply-risk exposure and supports consistent quality. Product differentiation centers on particle-size control, surface treatments, and impurity thresholds rather than bulk density alone. Sustainability messaging gains prominence as buyers scrutinize embodied carbon and circularity metrics.
Perlite Industry Leaders
Supreme Perlite
Aegean Perlites SA
Çullas Construction Materials Industry and Foreign Trade Inc.
Omya International AG
Imerys
- *Disclaimer: Major Players sorted in no particular order

Market Opportunities and Future Outlook
Opportunities cluster around higher-specification construction and industrial materials where perlite operates as an insulating lightweight aggregate and supports thermal and fire-performance needs. In building materials, perlite is linked to established standards and system approvals, including ASTM C549 for perlite loose-fill insulation and fire-rated wall assemblies, such as UL Designs U901, U904, U905, and U907. This framework supports more standardized adoption in masonry cavities and assemblies that prioritize non-combustibility and thermal performance. Academic work published across 2026 also supports development pathways for perlite-containing cementitious systems, including studies on replacing fine aggregate with expanded perlite to balance strength and insulation, and on geopolymer artificial lightweight aggregates incorporating expanded perlite. These findings give product developers more validated formulations aimed at green-building specifications.
A second area of focus is specialty grades and engineered uses, where purity control and application support matter most, notably in filtration and cryogenic insulation, as well as select ceramics applications. USGS notes that production remains concentrated in a few countries, and industry efforts to locate expansion close to demand centers create space for smaller regional expanders and toll-processing models where shipping dominates delivered economics. Beyond mainstream insulation and horticulture, technical research also points to low-density ceramic proppants using expanded perlite as an input, which highlights niche, higher-value demand. In these segments, suppliers can differentiate through particle engineering, impurity thresholds, and lot traceability, rather than competing only on bulk price.
Recent Industry Developments
- March 2026: Silbrico Corporation completed the acquisition of Supreme Perlite Company, a Portland-based expanded perlite manufacturer. The deal strengthens Silbrico's perlite footprint and adds a horticulture and industrial product platform, tightening regional supply in North America.
- January 2026: Imerys completed the acquisition of Chemviron's European diatomite and perlite business, expanding its filtration portfolio across Europe. The move reinforces Imerys' positioning in higher-margin filter-aid applications where technical specifications and customer qualification cycles shape supplier selection.
- October 2024: Omya International AG announced an investment in a new perlite production facility at its Moerdijk, Netherlands site to expand European production capacity. The added local footprint supports shorter lead times for construction and industrial buyers and reduces exposure to long-distance inbound logistics for expanded product.


Research Methodology Framework and Report Scope
Market Definition and Coverage
For this study, the perlite market is defined as revenue from mined crude perlite ore and processed expanded perlite sold for industrial and commercial uses, where demand is linked to construction materials, horticulture substrates, filtration media, and insulation needs.
Scope exclusions: We exclude downstream finished products where perlite is only a minor additive, and the perlite value cannot be separated reliably from the final product price.
Segmentation Overview
- By Product Type
- Expanded Perlite
- Agro-Perlite
- Vapex & Specialty Grades
- Other Product Types
- By Application
- Insulation
- Fillers
- Fire-Proofing & Refractory
- Filtration & Filter-Aid
- Abrasives & Polishing
- Soil Amendment/Horticulture
- By End-Use Industry
- Construction & Infrastructure
- Horticulture & Agriculture
- Industrial Manufacturing
- Food & Beverage Processing
- Oil & Gas/Cryogenic Storage
- Others
- By Geography
- Asia-Pacific
- China
- India
- Japan
- South Korea
- ASEAN
- Rest of Asia-Pacific
- North America
- United States
- Canada
- Mexico
- Europe
- Germany
- United Kingdom
- France
- Italy
- NORDIC
- Russia
- Rest of Europe
- South America
- Brazil
- Argentina
- Rest of South America
- Middle East and Africa
- Saudi Arabia
- United Arab Emirates
- South Africa
- Rest of Middle East and Africa
- Asia-Pacific
Data Sources, Market Sizing, and Validation
Desk Research
Desk work starts by building a clear view of where perlite is produced, traded, and consumed, since deposits are location specific and freight costs influence delivered pricing.
Public sources such as the USGS mineral summaries, UN Comtrade trade statistics, and national geological surveys help anchor ore availability, export flows, and major producing countries. To connect supply to end-use demand, we also refer to building and energy-efficiency code publications, construction output series from the World Bank and national statistics offices, and technical papers that describe perlite expansion yields and typical application loadings. Company annual reports, investor presentations, and credible industry association materials are used to sense-check capacity additions, product mix shifts, and application trends.
Where needed, a paid subscription for shipment-level trade data and company financials intelligence is used to cross-check volumes and revenues for key routes and producers. These examples are not exhaustive, and many other public and proprietary sources are referred to for data collection, validation, and clarification.
Primary Interviews and Surveys
Primary work focuses on validating pricing and utilization realities, since perlite is often sold on delivered terms and pricing can change quickly with energy and freight. We speak with producers, distributors, and large buyers in construction materials, horticulture, and filtration to confirm how product grades are specified, how supply contracts are structured, and what near-term demand signals look like by region. Insights from these discussions are then used to close gaps left by public data, and to align assumptions on volumes, yields, and average selling prices with what the market is actually transacting at.
Distribution of primary research fieldwork respondents
| Company type | Respondent position | Region |
|---|---|---|
| Top tier: 35% | CXOs: 16% | APAC: 38% |
| Mid tier: 47% | Functional/Unit leaders: 29% | EMEA: 36% |
| Smaller Players: 18% | Managers: 55% | Americas: 26% |
Market-Sizing & Forecasting
The core sizing is built using a top-down approach where production, trade, and apparent consumption signals are reconstructed by region, and then translated into value using grade-level price bands. Since perlite is used across a few repeatable demand pools, we track indicators such as construction output and insulation activity, horticulture substrate demand, filtration media usage in beverages and industrial processing, and cryogenic insulation projects, which together explain most of the volume movement.
After the demand pool is formed, value is calculated using average selling price logic that reflects product form (crude versus expanded), typical expansion yield factors, and freight-weighted delivered pricing differences between net importers and net exporters. To corroborate totals, selective bottom-up approximations are run using producer capacity ranges, utilization checks from interviews, and sampled pricing by application. This helps adjust for underreported trade or informal domestic supply. For forecasting, scenario analysis is used, with input paths for construction spending, greenhouse and horticulture area trends, and filtration growth expectations being aligned to what interviewees consider realistic, and then translated into volume and price outlooks by region.
Data Validation & Update Cycle
Model outputs are checked against independent signals, including trade balance logic, production feasibility versus known deposit and capacity constraints, and whether implied per-ton pricing stays within observed market ranges. If a region shows an unusual jump, the drivers are reviewed, and follow-up calls are triggered to verify whether the change is from a plant restart, a freight shock, a building-code pull-through, or a temporary inventory cycle.
Before sign-off, the work is reviewed in multiple steps so that assumptions, unit conversions, and currency treatments are consistent across countries. Reports are refreshed annually, and interim updates are made when material events occur, such as major capacity changes or sharp energy and freight movements. Right before delivery, a final pass is completed so the published view reflects the latest available data.
Mordor Intelligence's Perlite Market Size Compared With Other Published Estimates
Published perlite market values can look far apart because pricing timing and currency conversions move fast in a freight-heavy mineral, and because some studies implicitly blend crude and expanded material without adjusting for yield and delivered terms. Differences also show up when one estimate uses a single global price point, while another uses region-level price bands and then rolls them up.
When the model is refreshed, the key checks are whether implied per-ton values still match recent contract and spot discussions, whether trade-weighted prices shift with energy and ocean freight, and whether country totals reconcile with import-export balances, which is where Mordor Intelligence tends to separate timing effects from real demand changes.
Benchmark comparison
| Source | Market Size | Gaps in Research Methodology |
|---|---|---|
| Mordor Intelligence | USD 2.45 B (2025) | |
| Industry Publisher A | USD 1.68 B (2025) | Uses a narrower pricing build that appears closer to mine-gate or ex-works levels in several regions, and the value treatment for delivered freight and grade mix is less explicit, which can pull the total down. |
| Trade Research Group B | USD 1.80 B (2025) | Relies on broad form-based splits with limited adjustment for expansion yield and regional trade-weighted pricing, so the implied average selling price can lag when freight and energy costs change. |
Across the three figures, the spread is mainly explained by how quickly price inputs are updated, how delivered pricing is treated in a bulky mineral, and whether crude-to-expanded conversions are normalized before valuing the market. Using repeatable checks around trade flows, regional price bands, and interview-led price validation keeps the final number traceable to clear steps rather than a single blended assumption.


Key Questions Answered in the Report
What is the projected value of the Perlite market in 2031?
The Perlite market is forecast to reach USD 3.41 Billion by 2031, underpinned by a 5.70% CAGR during 2026-2031.
Which region contributes the largest Perlite demand?
Asia Pacific dominates with 48.30% revenue in 2025 and exhibits the fastest 6.78% CAGR through 2031, driven by construction and agricultural modernization.
What segment of the Perlite market is growing fastest?
Vapex & Specialty Grades represent the fastest product segment, advancing at 6.35% CAGR because of demand in cryogenic, pharmaceutical and cosmetic applications.
How do energy-efficient building codes influence Perlite sales?
Tightening building-performance standards in Europe and North America require higher insulation values, directly boosting Perlite board and loose-fill usage in retrofits and new builds.
Who are the leading players in the Perlite industry?
Imerys, Omya International AG, Aegean Perlites SA, Çullas Construction Materials Industry and Foreign Trade Inc., and Supreme Perlite a rank among the top processors, leveraging vertical integration, geographic spread and specialty-grade development to maintain share.
Page last updated on:


 Your data is secure and never sold or shared.


