Synthetic Data Market Size and Share
Market Overview
| Study Period | 2020 - 2031 |
|---|---|
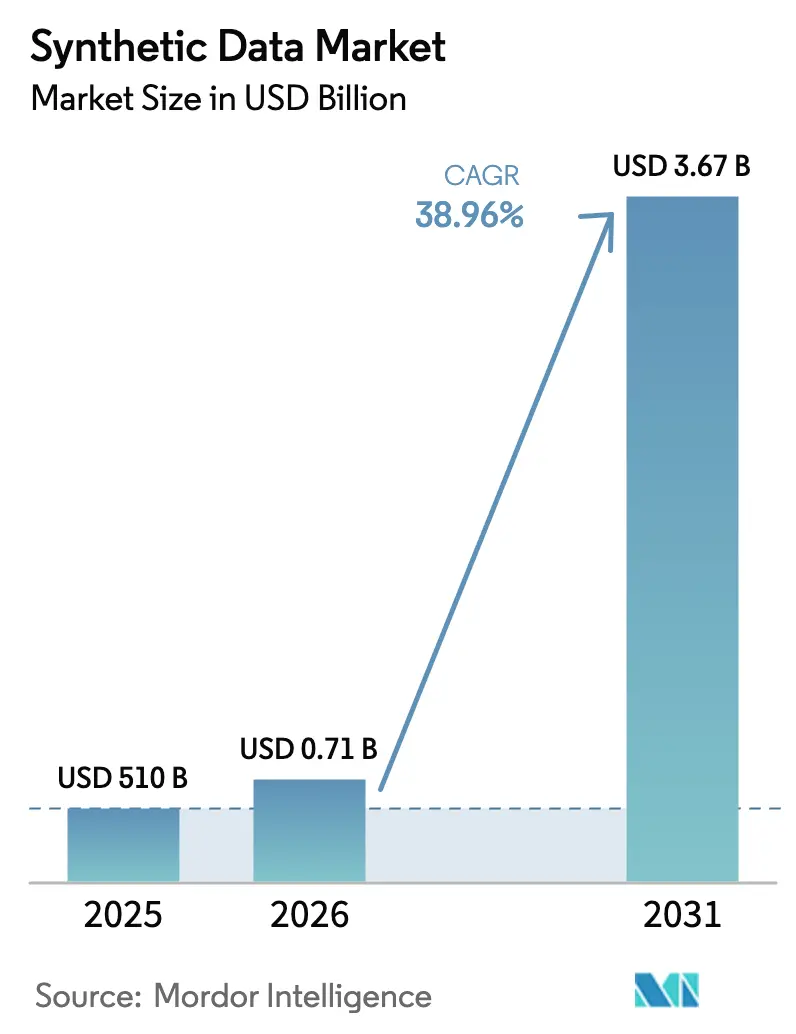
| Market Size (2026) | USD 0.71 Billion |
| Market Size (2031) | USD 3.67 Billion |
| Growth Rate (2026 - 2031) | 38.96% CAGR |
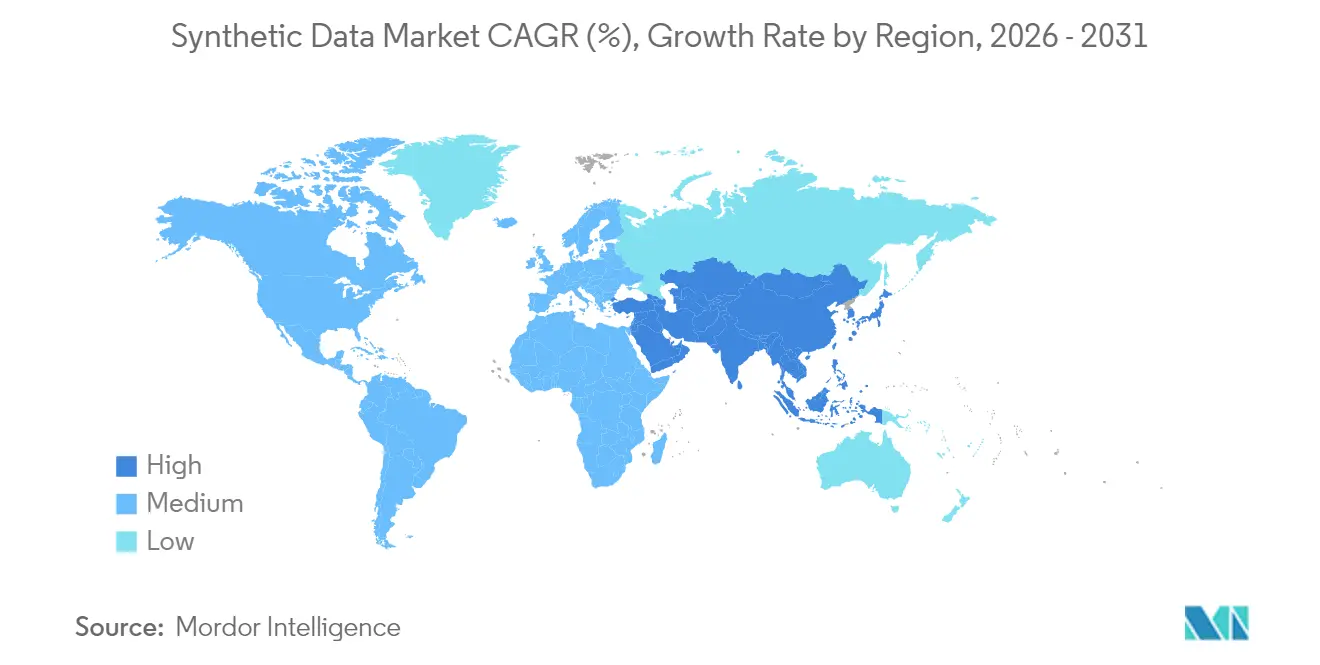
| Fastest Growing Market | Asia Pacific |
| Largest Market | North America |
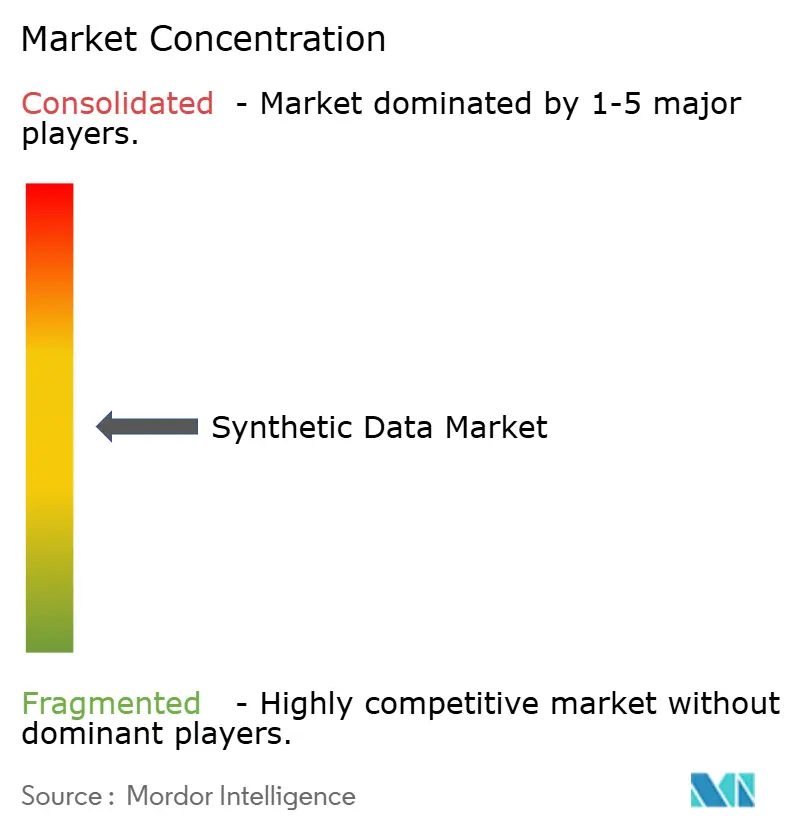
| Market Concentration | Medium |
Major Players *Disclaimer: Major Players sorted in no particular order Image © Mordor Intelligence. Reuse requires attribution under CC BY 4.0. | |
Synthetic Data Market Analysis by Mordor Intelligence
The synthetic data market size in 2026 is estimated at USD 710 million, growing from 2025 value of USD 510 million with 2031 projections showing USD 3.67 billion, growing at 38.96% CAGR over 2026-2031. This growth results from privacy-first regulations, surging generative-AI workloads, and digital-transformation projects that rely on compliant yet statistically faithful datasets. Enterprises are migrating from masking tools to high-utility replicas that keep relationships intact while aligning with the EU AI Act and similar rules. Technology suppliers that combine scalable generation engines with lineage tracking win budget share as governance teams demand auditable outputs. At the same time, new digital-twin deployments in manufacturing and mobility deepen demand for physics-rich simulations powered by synthetic data, and the arrival of open data exchanges expands market reach by lowering sourcing friction.
Key Report Takeaways
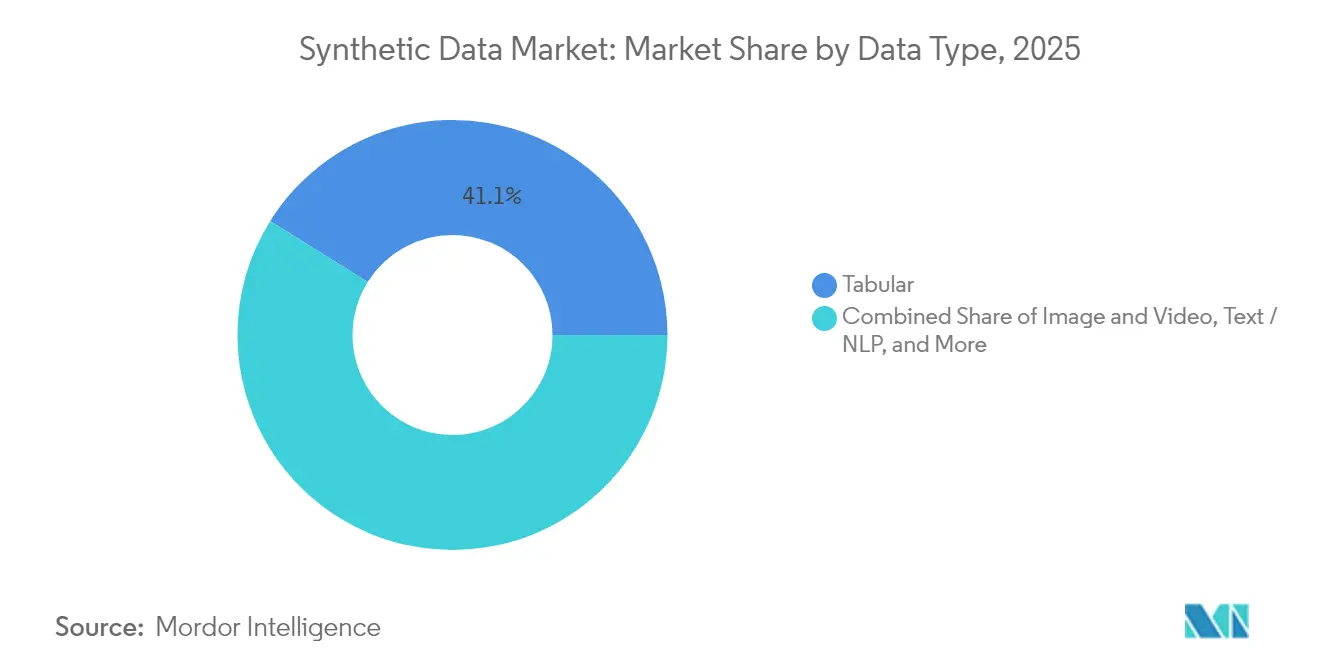
- By data type, tabular content held 41.10% of the synthetic data market share in 2025; image and video synthesis is forecast to expand at a 40.10% CAGR to 2031.
- By offering, fully synthetic solutions commanded 60.55% of the synthetic data market size in 2025 and are advancing at a 34.40% CAGR.
- By technology, Generative Adversarial Networks captured 37.75% revenue in 2025, while Diffusion Models are projected to grow at 46.30% CAGR through 2031.
- By deployment mode, cloud deployment accounted for 66.80% revenue in 2025 and is set to rise at a 28.60% CAGR through 2031.
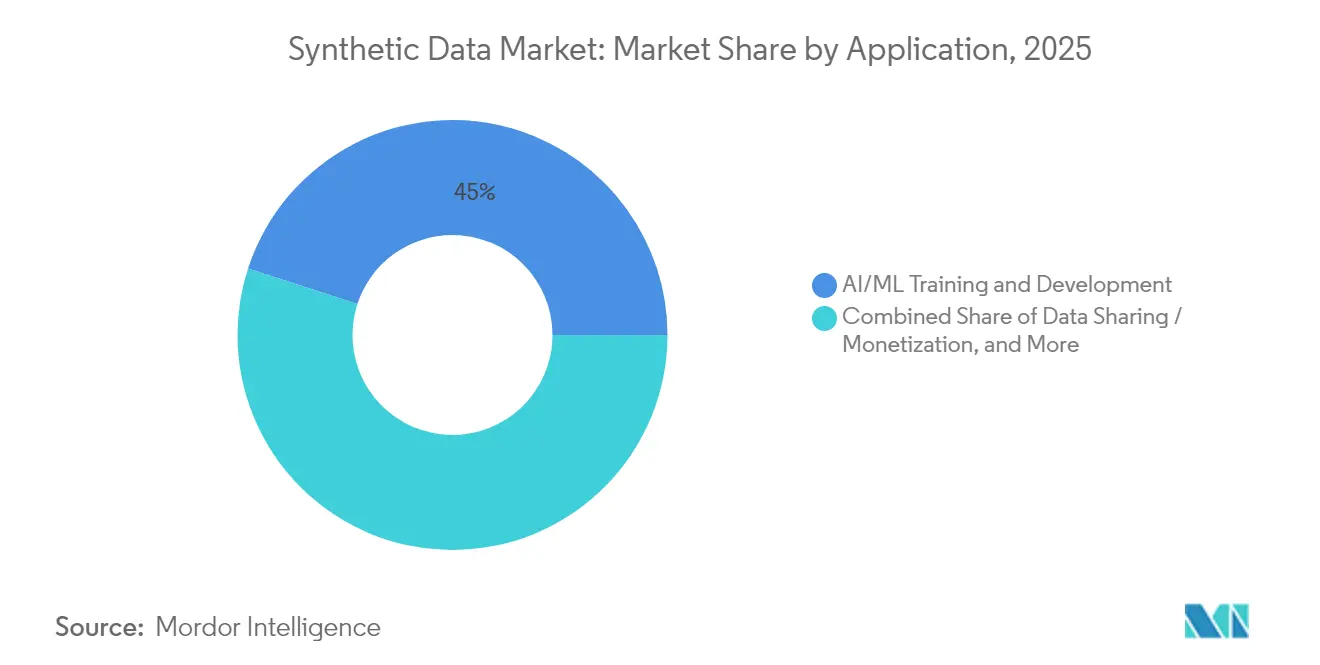
- By application, AI/ML training and development represented 45.00% of 2025 revenue, whereas autonomous-systems simulation is poised for the fastest 44.95% CAGR to 2031.
- By end-user industry, BFSI led with 23.25% of 2025 revenue, while automotive and transportation is projected to surge at a 37.10% CAGR through 2031.
- By geography, North America secured 38.10% revenue in 2025; Asia-Pacific is expected to post the highest 31.10% CAGR over the forecast period.
Note: Market size and forecast figures in this report are generated using Mordor Intelligence’s proprietary estimation framework, updated with the latest available data and insights as of 2026.
Global Synthetic Data Market Trends and Insights
Drivers Impact Analysis*
| Driver | (~) % Impact on CAGR Forecast | Geographic Relevance | Impact Timeline |
|---|---|---|---|
| Regulatory push for privacy-preserving AI and data sharing | +8.5% | Global, with early adoption in EU and North America | Medium term (2-4 years) |
| Generative AI boom demanding scalable low-bias datasets | +12.2% | Global, concentrated in North America and Asia-Pacific | Short term (≤ 2 years) |
| Shift from data masking to high-utility synthetic replicas | +6.8% | North America and EU, expanding to Asia-Pacific | Medium term (2-4 years) |
| Differential privacy and homomorphic encryption integration | +4.3% | Global, led by technology hubs in US and China | Long term (≥ 4 years) |
| Open synthetic data exchanges emerging | +3.7% | North America and EU, pilot programs in Asia-Pacific | Long term (≥ 4 years) |
| Digital twin convergence in Industry 4.0 simulations | +4.5% | Global industrial regions, strong in Germany and Japan | Medium term (2-4 years) |
| Source: Mordor Intelligence | |||
Generative-AI Boom Demanding Scalable Low-Bias Datasets
Large-scale language and vision models require vast, diverse corpora. Analysts estimate that synthetic content will supply 60% of AI-training data by 2024. Hyperscalers are responding: NVIDIA designed the Nemotron-4 340B generator to feed downstream pipelines, reducing data-acquisition costs and bias risks[1]NVIDIA, “Nemotron-4 340B: A Foundation Model for Synthetic Data Generation,” developer.nvidia.com. The boom touches every vertical but is most acute in computer vision and multilingual NLP, where real-world sourcing can be expensive or prohibited by privacy law. Synthetic augmentation expands scenario coverage, trims annotation budgets, and enables quicker experimentation.
Regulatory Push for Privacy-Preserving AI and Data Sharing
The EU AI Act obliges organizations to explore synthetic substitutes before processing personal data . In the United States, the Department of Homeland Security earmarked USD 1.7 million for synthetic-generator pilots, confirming federal interest in compliant data exchange [2]U.S. Department of Homeland Security, “Solicitation 23-DN-004 Synthetic Data Solutions,” dhs.gov. China’s new labeling rules echo similar intent. Firms that operationalize synthetic data early avoid fines and unlock cross-border collaborations. Compliance therefore shifts synthetic data from a nice-to-have to a board-level mandate.
Shift from Data Masking to High-Utility Synthetic Replicas
Traditional anonymization often breaks referential integrity, limiting analytical usefulness. New platforms generate statistically faithful replicas, letting testers run realistic workloads without risking exposure. Synthesized’s embed into Google BigQuery illustrates how generation can live inside mainstream data warehouses. German banks report faster credit-risk analysis after adopting synthetic snapshots that keep inter-table relationships intact. This shift redirects budget from costly access controls to self-service data democratization.
Digital-Twin Convergence in Industry 4.0 Simulations
Industrial firms marry digital-twin engines with synthetic sensor streams to stress-test algorithms for predictive maintenance. Springer research shows ten-fold acceleration in product-development cycles when synthetic telemetry fills data gaps [3]Springer, “Digital Twins and Synthetic Sensor Streams,” link.springer.com. NVIDIA’s Omniverse generates physics-rich scenarios, enabling automotive suppliers and robotics outfits to validate edge cases that would be risky or impossible in the real world. The combination delivers both safety and cost savings.
Restraints Impact Analysis*
| Restraint | (~) % Impact on CAGR Forecast | Geographic Relevance | Impact Timeline |
|---|---|---|---|
| Model-collapse risk from recursively trained data | -4.8% | Global, particularly affecting LLM development | Short term (≤ 2 years) |
| Lack of standard quality metrics across vendors | -3.2% | Global, with standardization efforts in US and EU | Medium term (2-4 years) |
| High compute cost for multi-modal foundation models | -5.1% | Global, most acute in resource-constrained markets | Short term (≤ 2 years) |
| Nascent legal status of "non-personal" synthetic data | -2.9% | Global, with regulatory uncertainty in emerging markets | Long term (≥ 4 years) |
| Source: Mordor Intelligence | |||
Model-Collapse Risk from Recursively Trained Data
Studies warn that repeated training on self-generated content narrows data diversity and amplifies bias. Vendors now blend organic feeds and freeze generator weights to limit feedback loops. Quality audits and active-learning pipelines are emerging safeguards, yet the issue remains a near-term brake on fully synthetic workflows.
High Compute Cost for Multi-Modal Foundation Models
Top-tier diffusion engines require thousands of GPUs and weeks of run-time. Monthly bills can crest six figures for smaller firms, hampering experimentation. Cloud pay-as-you-go services ease entry but do not erase throughput costs. Price pressure may encourage hardware specialization and federated off-loading to client-side chips.
*Our forecasts treat driver/restraint impacts as directional, not additive. The impact forecasts reflect baseline growth, mix effects, and variable interactions.
Segment Analysis
By Data Type: Visual Content Drives Innovation
Image and Video synthesis commands the fastest growth at 40.10% CAGR through 2031, reflecting autonomous vehicle development and computer vision applications demanding photorealistic training datasets. Tabular data maintains market leadership with 41.10% share in 2025, driven by financial services and healthcare applications requiring structured data privacy solutions. Text and NLP applications benefit from large language model advances, while Audio synthesis gains momentum through platforms like Rightsify's Gramosynth for copyright-free music generation. Sensor and Time-series data synthesis addresses IoT and industrial monitoring requirements, particularly valuable for predictive maintenance applications where failure scenarios are rare in real-world datasets.
The emergence of multi-modal foundation models is blurring traditional data type boundaries, with platforms like NVIDIA's Cosmos generating physics-based synthetic data across visual, sensor, and temporal modalities simultaneously. Applied Intuition's USD 15 billion valuation reflects investor confidence in visual synthetic data applications for autonomous systems. This convergence enables more sophisticated simulation environments that capture complex real-world interactions, particularly valuable for robotics and autonomous vehicle development where multiple sensor modalities must be synchronized.


By Offering: Complete Replacement Preferred
Fully synthetic packages dominated 60.55% of 2025 revenue and are growing at a 34.40% CAGR. Enterprises choose total replacement to eliminate residual privacy risk and simplify governance structures. Hybrid alternatives remain for high-fidelity clinical or engineering workflows where minor real-world anchors improve model accuracy. Tonic.ai’s secure lakehouse exemplifies demand for single-pane control across unstructured formats, underscoring market migration toward consolidated toolchains.
The synthetic data market benefits as regulators accept statistical equivalence tests over raw data inspections, shrinking approval timelines. Banking and insurance groups cite double-digit reductions in compliance-review hours after adoption. Vendors that automate lineage, versioning, and differential-privacy checks bundle value-added services, raising switching costs and nudging the industry toward platform consolidation.
By Technology: Diffusion Models Surge
GANs still account for 37.75% of 2025 revenue, but diffusion engines log the fastest 46.30% CAGR. Their ability to produce cleaner, more diverse frames positions them for high-resolution video tasks in entertainment and advanced manufacturing. LLM-based generators prove strong for tabular and text synthesis, retaining column correlations and boosting downstream model F1-scores. Rule-based simulators persist in deterministic industrial control where physics equations trump data-driven randomness.
Academic projects like SiloFuse demonstrate diffusion’s suitability for federated environments, a key selling point in cross-border finance and healthcare. Benchmarks reveal defect-rate reductions of 30% versus legacy pipelines, explaining why OEMs upgrade despite higher compute bills. The synthetic data market exhibits a clear technology-refresh cycle that rewards vendors who decouple orchestration logic from generator architecture.
By Deployment Mode: Cloud Dominance Continues
Cloud deployments seized 66.80% of 2025 revenue and will rise at a 28.60% CAGR through 2031. Enterprises favor elastic GPU pools and managed compliance tooling. AWS Bedrock, Google BigQuery with Synthesized, and NVIDIA’s DGX Cloud host native generation APIs that shorten project start-up times. On-premise installations remain critical for defense, central banking, and utilities governed by strict sovereignty mandates.
Latency-sensitive trading desks experiment with edge-based micro-generators that refresh synthetic market data in under two milliseconds. Meanwhile, confidential-compute enclaves and region-pinning options temper sovereignty concerns in the public cloud. As costs decline and security features improve, the synthetic data market tilts further toward cloud-first deployment, though hybrid footprints endure where bandwidth or policy constraints persist.
By Application: Autonomous Systems Accelerate
AI/ML training commanded 45.00% of 2025 spend, confirming that synthetic augmentation has become a mainstream development input. Autonomous-systems simulation is projected to log the top 44.95% CAGR as regulators demand exhaustive scenario testing before commercial rollout. Software-testing teams exploit synthetic edge cases to discover bugs earlier, and fraud-analytics units replicate rare attack patterns without exposing customer records.
Data-sharing and monetization platforms emerge as new revenue streams. Firms sell anonymized yet useful datasets to partners, unlocking value from previously siloed assets. In robotics, NVIDIA’s Isaac pipeline produces hundreds of thousands of motion trajectories in hours, accelerating model convergence. These dynamics broaden the synthetic data market beyond research and Development into production operations and commercial data products.
By End-User Industry: Automotive Transformation
BFSI held 23.25% of 2025 revenue in the synthetic data market size, leveraging replicas for risk modeling and anti-fraud analytics. Automotive and transportation are predicted to grow at a 37.10% CAGR, driven by the race toward Level 4 autonomy that needs billions of safe-driving miles for validation. Healthcare pilots synthetic patient cohorts to streamline clinical-trial enrollment and protect privacy. Retailers manufacture customer journeys for personalization engines, and telecommunications firms simulate network-fault events to harden reliability. Government agencies craft mission-planning datasets that remove classified characteristics yet maintain strategic utility. The synthetic data market thus penetrates every sector where real-world data is scarce, sensitive, or expensive to collect.
Geography Analysis
North America captured 38.10% of 2025 revenue. Tech giants such as Microsoft and Meta spend tens of billions on AI infrastructure that relies on synthetic pipelines, and federal programs validate the approach for homeland-security use cases. Clusters in California, Texas, and Ontario attract venture capital, providing a dense ecosystem of specialists that feed innovation across finance, health, and defense.
Asia-Pacific shows the fastest 31.10% CAGR. China’s AI-generated-content labeling law encourages enterprises to generate synthetic alternatives instead of real user logs, and robotics leaders in Japan pair synthetic perception data with factory automation. India leverages synthetic patient records to bolster tele-health platforms amid data-localization rules, and South Korea’s semiconductor capacity supports in-region model training. Southeast Asia benefits from fintech upstarts that share privacy-safe credit data to expand financial inclusion.
Europe blends regulatory leadership with commercial momentum. The EU AI Act formalizes a synthetic-first stance, and the European Commission validated the method for digital finance. Germany’s Industrie 4.0 projects combine digital twins and synthetic telemetry to optimize energy usage. The UK capitalizes on regulatory independence to pilot streamlined approval paths. Nordic states invest in green data centers that host carbon-neutral generation clusters, aligning sustainability targets with AI growth. Elsewhere, Middle East smart-city programs integrate synthetic datasets for mobility and security, and African start-ups tap cloud APIs to offset data scarcity while navigating evolving privacy laws.

Competitive Landscape
The synthetic data market remains moderately concentrated yet highly dynamic. NVIDIA’s USD 320 million acquisition of Gretel fuses hardware, model orchestration, and privacy tooling into an end-to-end stack. SAS Institute bought Hazy to embed generation inside analytic suites used by banks and insurers. Applied Intuition raised capital at a USD 15 billion valuation to deliver domain-specific simulation for autonomous driving, underscoring the premium for vertical depth.
Three competitive archetypes emerge. Infrastructure leaders monetize compute at scale and bundle synthetic engines. Vertical specialists tailor domain ontologies and validation metrics. Platform integrators focus on governance layers that connect disparate generators to enterprise data fabrics.
IEEE working groups draft quality standards that could commoditize base-generation functionality and shift rivalry toward compliance automation and real-time observability. Over the forecast period, acquisitions are likely as larger firms seek capability breadth, but open-source diffusion reduces barriers for new entrants, keeping the synthetic data market contestable.
Synthetic Data Industry Leaders
MOSTLY AI Solutions MP GmbH
NVIDIA Corporation
Meta Platforms, Inc.
Amazon.com, Inc.
Microsoft Corporation
- *Disclaimer: Major Players sorted in no particular order

Recent Industry Developments
- April 2025: Tonic.ai purchased Fabricate to deliver natural-language interfaces that let non-technical staff create compliant datasets rapidly.
- March 2025: NVIDIA acquired Gretel for USD 320 million, integrating privacy-preserving generation into its cloud AI services.
- January 2025: NVIDIA released Cosmos World Foundation Model, enabling photorealistic synthetic scenes for autonomous vehicles and robots, with Uber among first users.
- January 2025: NVIDIA expanded Omniverse with generative physical AI, adding Accenture, Microsoft, and Siemens as early adopters.


Research Methodology Framework and Report Scope
Market Definitions and Key Coverage
Our study defines the synthetic data market as all commercial revenue generated by software platforms, cloud services, and APIs that algorithmically create artificial datasets whose statistical patterns replicate real information for AI/ML training, test-data management, privacy preservation, and simulation.
For clarity, we leave out legacy data-masking utilities that merely anonymize existing records rather than generate new, statistically representative data.
Segmentation Overview
- By Data Type
- Tabular
- Text / NLP
- Image and Video
- Audio
- Sensor / Time-series
- By Offering
- Fully Synthetic
- Partially Synthetic / Hybrid
- By Technology
- GANs
- Diffusion Models
- LLM-based Generators
- Rule-based / Agent-based Simulations
- By Deployment Mode
- Cloud
- On-premise
- By Application
- AI/ML Training and Development
- Data Sharing / Monetization
- Software Testing and DevOps
- Autonomous Systems Simulation
- Cyber-security and Fraud Testing
- By End-user Industry
- BFSI
- Healthcare and Life-Sciences
- Retail and E-commerce
- Automotive and Transportation
- Government and Defense
- IT and ITeS
- Industrial and Robotics
- By Geography
- North America
- United States
- Canada
- Mexico
- South America
- Brazil
- Argentina
- Rest of South America
- Europe
- Germany
- United Kingdom
- France
- Italy
- Spain
- Russia
- Rest of Europe
- Asia-Pacific
- China
- Japan
- India
- South Korea
- Australia and New Zealand
- Rest of Asia-Pacific
- Middle East and Africa
- Middle East
- Saudi Arabia
- United Arab Emirates
- Turkey
- Rest of Middle East
- Africa
- South Africa
- Nigeria
- Egypt
- Rest of Africa
- Middle East
- North America
Detailed Research Methodology and Data Validation
Primary Research
Mordor analysts interviewed cloud-AI architects, chief privacy officers in BFSI and healthcare, and procurement leads across North America, Europe, and Asia-Pacific.
Their insights on license pricing tiers, usage ratios, and regulatory bottlenecks let us refine assumptions that secondary data alone could not resolve.
Desk Research
We began by sizing potential demand through open sources such as the OECD AI Policy Observatory, the EU GDPR enforcement tracker, United States Bureau of Economic Analysis software-spend tables, and peer-reviewed journals indexed in IEEE Xplore.
D&B Hoovers and Dow Jones Factiva supplied indicative vendor revenues, while white papers from the ITI Council helped verify adoption signals.
To translate disparate datapoints into comparable metrics, we normalized values to constant 2025 dollars, reconciled currency swings using IMF averages, and archived every reference in an internal repository.
The list above is illustrative; many other secondary inputs informed data collection, validation, and clarification.
Market-Sizing & Forecasting
We applied one top-down and bottom-up blend: enterprise AI software spend formed the demand pool, penetration rates by sector converted it into synthetic-data revenue, and results were cross-checked against sampled vendor roll-ups and average selling price × volume tests.
Key variables include GPU-hour cost curves, regional compliance expenditure, active AI project counts, and synthetic-image volumes per autonomous-vehicle mile.
A multivariate regression projects these drivers through 2030; missing micro-data were interpolated from adjacent indicators and reconciled during review.
Data Validation & Update Cycle
We run anomaly sweeps, multi-stage peer reviews, and variance checks against independent benchmarks before sign-off.
Models refresh each year, with interim updates when events such as new privacy laws materially shift demand.
Why Mordor's Synthetic Data Baseline Commands Reliability
We recognize published estimates often diverge because firms adopt different scopes, assumptions, and refresh cadences.
By focusing strictly on generation-platform revenue and by recalibrating our model annually, Mordor minimizes both over-statement and under-statement.
Benchmark comparison
| Market Size | Anonymized source | Primary gap driver |
|---|---|---|
| USD 0.51 B (2025) | Mordor Intelligence | |
| USD 0.30 B (2023) | Global Consultancy A | Includes anonymization software and proof-of-concept spend |
| USD 0.29 B (2024) | Industry Journal B | Applies uniform CAGR without regional calibration |
These contrasts show that Mordor's disciplined scope selection, variable-driven model, and timely refresh deliver a balanced, transparent baseline that decision-makers can rely on.


Key Questions Answered in the Report
What is the projected growth of the synthetic data market to 2031?
The synthetic data market is forecast to rise from USD 710 million in 2026 to USD 3.67 billion by 2031, reflecting a 38.96% CAGR.
Why are diffusion models gaining share over GANs?
Diffusion engines generate higher-quality and more stable images, driving a 46.30% CAGR that outpaces the growth of GAN-based approaches .
Which deployment mode dominates spending?
Cloud deployment accounts for 66.80% of 2025 revenue and is expanding at 28.60% CAGR thanks to elastic GPU pools and integrated compliance tooling.
How do new regulations influence adoption?
Rules such as the EU AI Act require firms to test synthetic alternatives before processing personal data, making generation platforms a compliance necessity .
Which industry vertical is poised for the fastest growth?
Automotive and transportation is set to grow at a 37.10% CAGR because autonomous-driving programs need extensive synthetic scenario coverage for safety validation.
What is the main hurdle for smaller enterprises?
High compute costs for multi-modal foundation models remain the biggest barrier, with GPU-heavy workloads pushing monthly cloud bills into six-figure territory.
Page last updated on:


