
Market Overview
| Study Period | 2020 - 2031 |
|---|---|
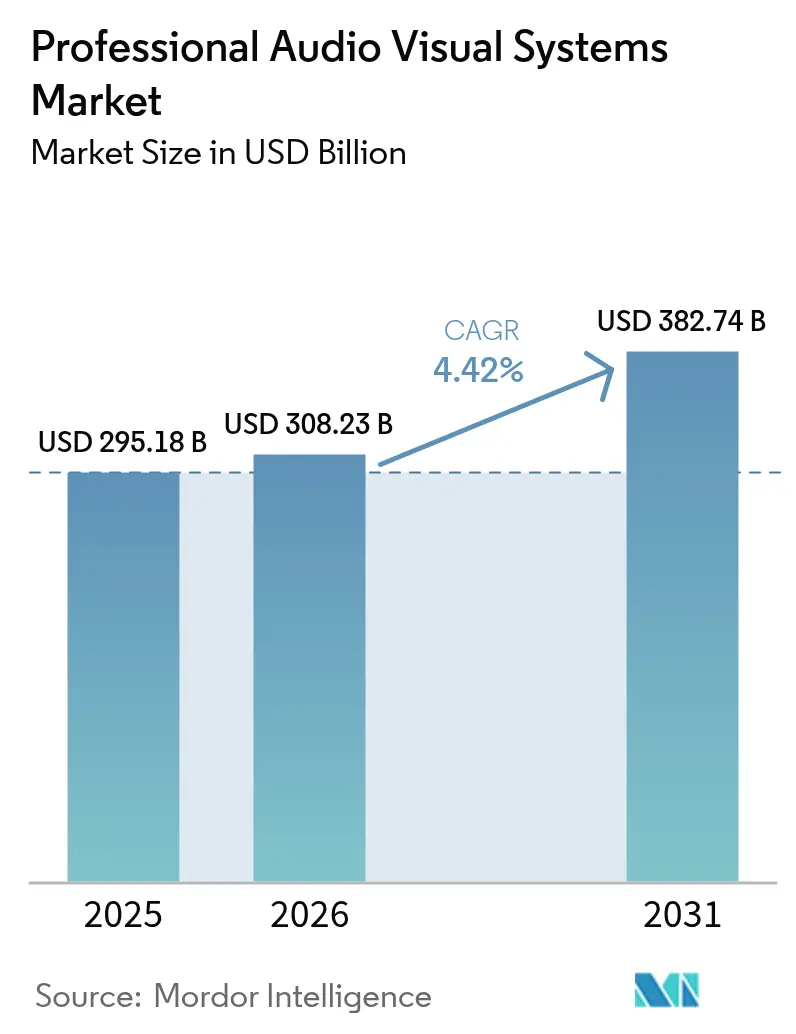
| Market Size (2026) | USD 308.23 Billion |
| Market Size (2031) | USD 382.74 Billion |
| Growth Rate (2026 - 2031) | 4.42 % |
| Fastest Growing Market | Asia Pacific |
| Largest Market | Asia Pacific |
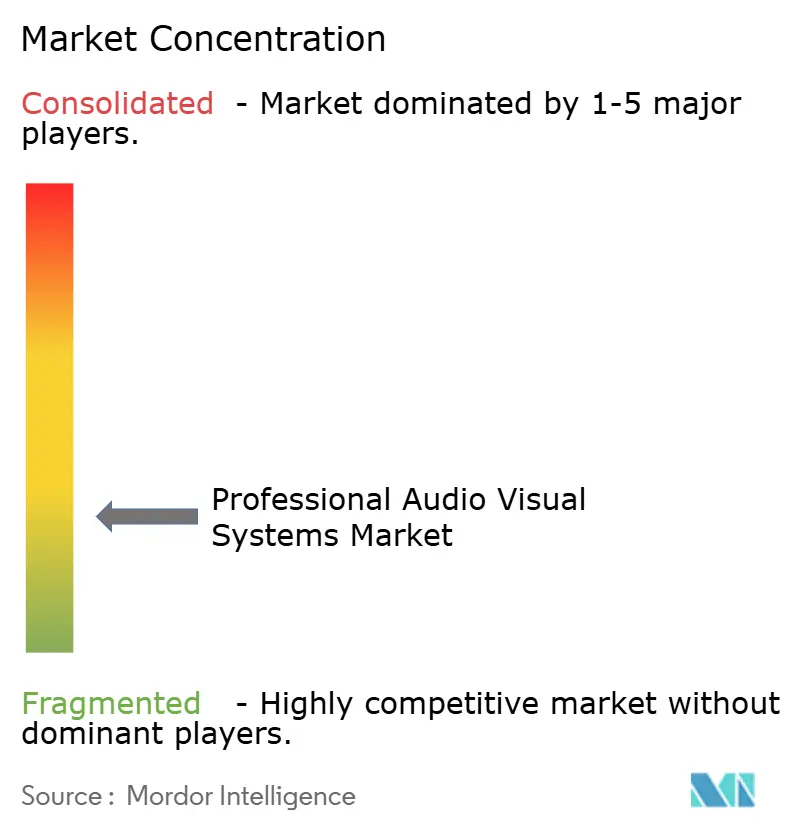
| Market Concentration | Low |
Major Players *Disclaimer: Major Players sorted in no particular order Image © Mordor Intelligence. Reuse requires attribution under CC BY 4.0. | |
Professional Audio Visual Systems Market Analysis by Mordor Intelligence
The professional audio visual system market size was valued at USD 295.18 billion in 2025 and estimated to grow from USD 308.23 billion in 2026 to reach USD 382.74 billion by 2031, at a CAGR of 4.42% during the forecast period (2026-2031). Hybrid work requirements, investment in digital signage, and the migration of AV processing to cloud and IP networks drive demand resilience. Spending momentum is visible in enterprise collaboration suites, large-format LED displays, and AI-enabled audio that supports inclusive meetings. Vendor competition is intensifying as software-centric newcomers challenge traditional integrators with subscription models and remote device management. Supply-chain pressures related to semiconductors remain a headwind, yet regulatory mandates on accessibility and energy efficiency are opening new revenue avenues for compliance-ready platforms.
Key Report Takeaways
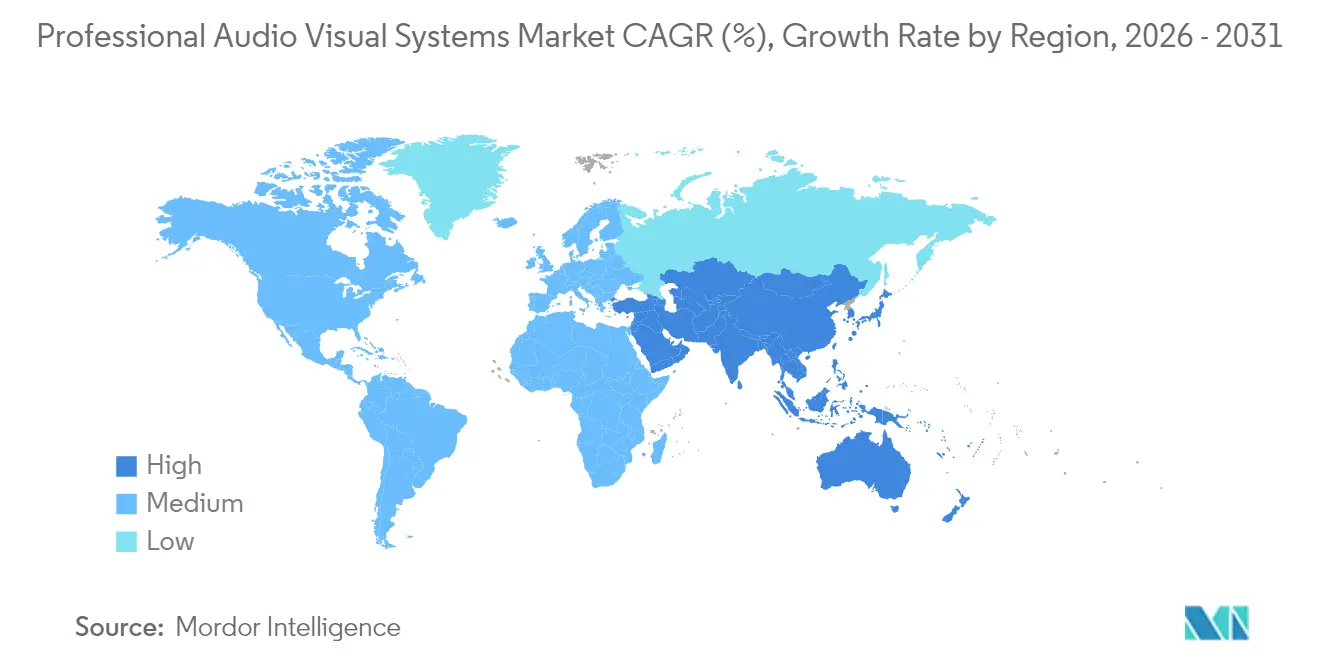
- By geography, Asia-Pacific led with 29.55% professional audio visual system market share in 2025, while the region is also forecast to post a 5.78% CAGR to 2031.
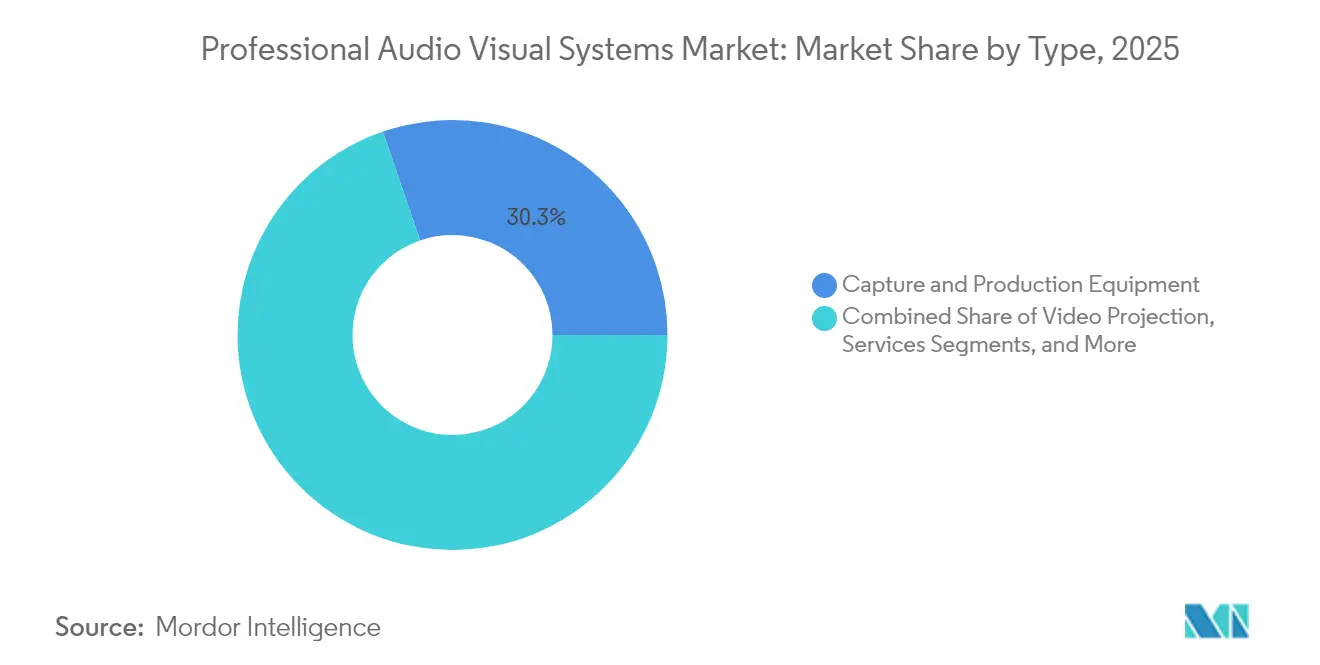
- By type, Capture and Production Equipment held a 30.25% revenue share in 2025; Streaming Media, Storage, and Distribution is projected to advance at a 5.33% CAGR through 2031.
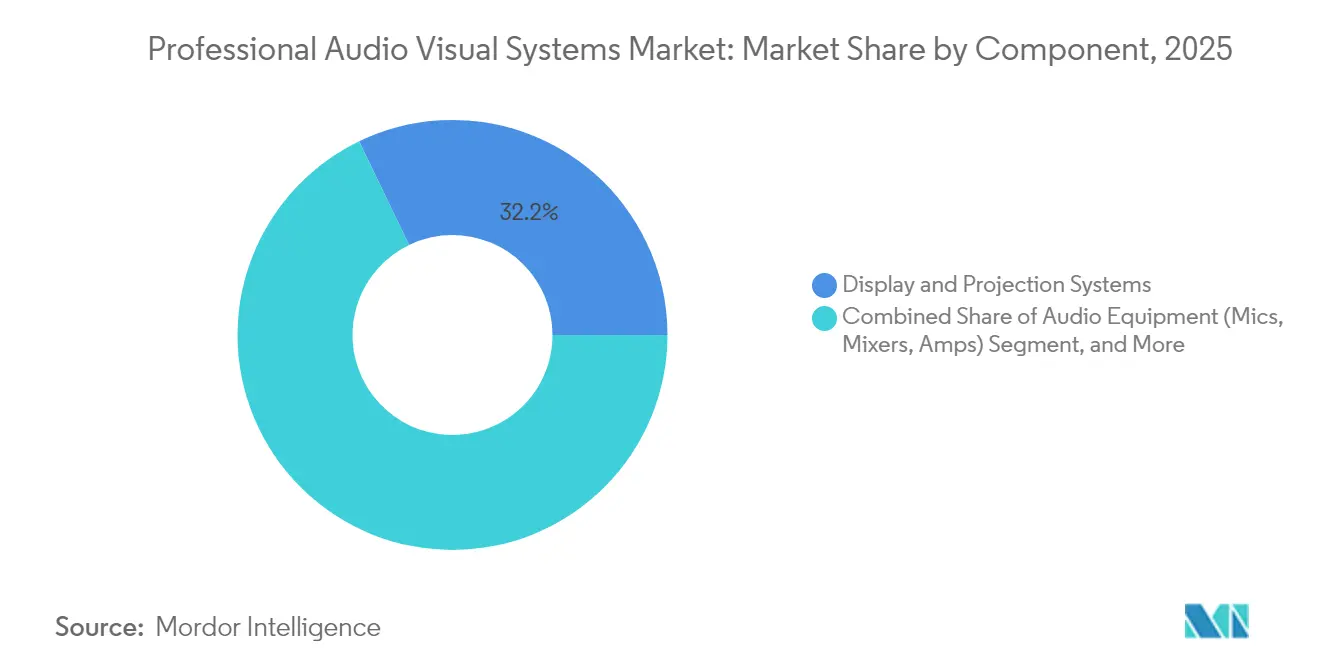
- By component, Display and Projection Systems contributed 32.15% of 2025 revenue; Audio Equipment is set to rise at a 5.03% CAGR during the forecast period.
- By end-user vertical, Corporate accounted for 32.62% of spending in 2025, while Retail is poised for the fastest 4.71% CAGR to 2031.
Note: Market size and forecast figures in this report are generated using Mordor Intelligence’s proprietary estimation framework, updated with the latest available data and insights as of 2026.
Market Trends and Insights
Driver Imapct Analysis of Professional Audio Visual Systems Market*
| DRIVER | (~) % IMPACT ON CAGR FORECAST | GEOGRAPHIC RELEVANCE | IMPACT TIMELINE |
|---|---|---|---|
| Hybrid work and learning surge | +1.2% | Global, strongest in North America and Europe | Short term (≤ 2 years) |
| Experiential retail and public-venue LED rollouts | +0.8% | Core in Asia-Pacific, follow-on in North America | Medium term (2-4 years) |
| Live and hybrid events rebound post-pandemic | +0.7% | Global, metro clusters | Short term (≤ 2 years) |
| Migration to AV-over-IP architectures | +0.9% | North America and Europe lead, Asia-Pacific follows | Long term (≥ 4 years) |
| AI-driven real-time accessibility solutions | +0.5% | Global, regulatory driven in developed markets | Medium term (2-4 years) |
| Decarbonization mandates for energy-efficient AV | +0.4% | Europe and North America, expanding to Asia-Pacific | Long term (≥ 4 years) |
| Source: Mordor Intelligence | |||
Hybrid Work and Learning Surge
Corporate spending shifted from isolated conference-room upgrades to enterprise-wide ecosystems that deliver equitable experiences for on-site and remote staff. Investments span spatial audio arrays, multi-camera tracking, and automated content framing that integrate with leading collaboration platforms.[1] Education is mirroring this demand with lecture capture, campus streaming, and device management that support blended classrooms. The professional audio visual system market benefits because enterprises prefer certified, fully managed solutions that plug into existing IT policies. Rapid refresh cycles are fueled by employee experience benchmarks, leading to multiyear procurement roadmaps. As a result, platform interoperability and cloud dashboards have emerged as critical vendor differentiators.
Experiential Retail and Public-Venue LED Rollouts
Retail chains are turning stores into immersive media venues where fine-pitch LEDs deliver branded storytelling, wayfinding, and real-time promotions. Scheels’ USD 11 million national signage rollout underscores capital intensity and scale.[2] Public buildings and transport hubs are installing similar displays to manage passenger flow and safety messaging. Central content management lets operators synchronize campaigns across regions while tailoring local language and offers. The professional audio visual system market is bolstered because display hardware now ships with embedded analytics that feed retailers’ CRM tools. Rising foot-traffic expectations keep LED demand elevated despite cyclical retail spending.
Live and Hybrid Events Rebound Post-Pandemic
Trade shows, concerts, and corporate town halls now serve simultaneous in-person and virtual audiences, requiring broadcast-grade cameras, mixing consoles, and low-latency streaming encoders. Attendance at NAB 2025 surpassed 55,000, signaling renewed exhibitor confidence.[3] Permanent installs replace rental gear as venues hedge against future disruptions. Event organizers prioritize flexible infrastructures that reconfigure between full-capacity shows and small hybrid seminars. Consequently, the professional audio visual system market sees sustained orders for scalable production switchers and cloud content delivery.
Migration to AV-over-IP Architectures
Enterprises are moving from point-to-point cabling toward Ethernet-based audio and video transport that rides on existing switches.[4]Standards such as IPMX and Dante accelerate multivendor interoperability, reducing lock-in and enabling phased upgrades. Benefits include dynamic routing, remote monitoring, and simplified adds-moves-changes that cut the total cost of ownership over system life. The switch favors suppliers with network engineering expertise and secure firmware roadmaps. Long term, software licenses and analytics subscriptions attached to AV-over-IP endpoints are expected to outpace pure hardware margins across the professional audio visual system market.
Restraints Impact Analysis of Professional Audio Visual Systems Market*
| RESTRAINTS | (~) % IMPACT ON CAGR FORECAST | GEOGRAPHIC RELEVANCE | IMPACT TIMELINE |
|---|---|---|---|
| High TCO and compliance costs | -0.8% | Global, intense in regulated industries | Medium term (2-4 years) |
| Semiconductor and display supply-chain volatility | -0.6% | Global, production centered in Asia-Pacific | Short term (≤ 2 years) |
| Cyber-insurance premiums on networked AV | -0.3% | North America and Europe, expanding worldwide | Medium term (2-4 years) |
| Skilled-labor shortages and wage inflation | -0.7% | Global, severe in developed economies | Long term (≥ 4 years) |
| Source: Mordor Intelligence | |||
High TCO and Compliance Costs
Accessibility, cybersecurity, and energy mandates have transformed procurement math. The FCC rules, effective January 2027, require captioning, sign-language support, and accessible user interfaces within video-conferencing platforms. Parallel energy standards push manufacturers to redesign enclosures and power supplies with higher-efficiency components. Compliance adds testing, certification, and frequent software updates, doubling lifecycle spending for complex deployments. Organizations underestimate ongoing training, monitoring, and audit documentation, leading to budget overruns that temper near-term orders in the professional audio visual system market.
Skilled-Labor Shortages and Wage Inflation
Installation and service teams must now blend AV design, network engineering, and cybersecurity. The talent pool has not kept pace; average U.S. AV technician wages climbed to USD 59,260 in 2024, outpacing broader occupational averages. Project timelines extend while integrators search for Dante-certified programmers and IT-savvy field engineers. Firms invest in internal academies and vendor-sponsored certifications, but ramp-up periods stretch delivery schedules. Persistent scarcity restricts rollout velocity, slowing revenue recognition across the professional audio visual system market despite healthy demand.
*Our forecasts treat driver/restraint impacts as directional, not additive. The impact forecasts reflect baseline growth, mix effects, and variable interactions.
Professional Audio Visual Systems Market Segment Analysis
By Type:
Content Capture Dominance Meets Streaming MomentumThe professional audio visual system market recorded Capture and Production Equipment at a leading 30.25% share in 2025, underscoring the premium placed on high-quality source content. Camera systems, PTZ controllers, and production switchers move down-market as corporate and educational studios replicate broadcast workflows. Bundled subscription models that wrap hardware, software, and remote support increase annual recurring revenue for vendors. Streaming Media, Storage, and Distribution, the fastest-growing slice at a 5.33% CAGR, reflects demand for scalable cloud encoders and on-demand content libraries. Edge caching reduces latency for globally dispersed viewers, turning media servers into strategic nodes in the professional audio visual system market size discussions.
Traditional Video Projection retains relevance for auditoriums and houses of worship but yields share to direct-view LED in high-brightness settings. Services, including design, monitoring, and break-fix contracts, climb as customers outsource lifecycle management. Emerging types such as holographic displays and spatial computing remain niche yet capture innovation budgets for premium venues. Every sub-segment illustrates a shift where value creation migrates from isolated hardware to integrated ecosystems that monetize analytics and content workflows.

By Component:
Displays Lead While Intelligent Audio AcceleratesDisplay and Projection Systems commanded 32.15% of revenue in 2025 as enterprises replaced lamp-based projectors with fine-pitch LED tiles and interactive flat panels. The professional audio visual system market size for this component is forecast to keep pace with venue expansions, but margin pressure grows due to commoditization. In response, manufacturers bundle calibration software and energy dashboards. Audio Equipment displays the strongest 5.03% CAGR because intelligible speech is decisive for meeting equity. Advances in beamforming microphones, spatial audio processors, and AI noise suppression reshape acoustic design norms.
Control and Processing units form the digital nervous system, orchestrating sources, displays, lighting, and building management. Open APIs allow integrators to embed AV data into enterprise dashboards that track room utilization and energy consumption. Storage and Distribution Hardware evolves toward hyper-converged nodes that perform decoding, recording, and analytics at the edge. Component convergence means that future professional audio visual system market share milestones will rely less on unit shipments and more on software attach rates.
By End-User Vertical:
Corporate Scale Faces Retail AgilityCorporate buyers retained a 32.62% revenue contribution in 2025 as hybrid work shifted from pilot to permanent. Multizone audio, wide-angle cameras, and occupancy sensors transform meeting equity into a procurement baseline. Finance and legal sectors demand stringent encryption and failover architectures, nudging average deal sizes upward. In parallel, Retail delivers the quickest 4.71% CAGR thanks to dynamic pricing labels, smart shelves, and shopper analytics that improve basket conversion.
Venues and Events allocate capital toward permanent 4K switchers and cloud streaming to hedge against travel disruptions. Education invests in lecture-capture suites, while Healthcare purchases telemedicine carts integrated with EMR systems. Government mandates on emergency communications stimulate municipal spending on outdoor LED and mass-notification audio horns. Segment diversification safeguards the professional audio visual system market against single-industry slowdowns while rewarding integrators that master domain-specific compliance.
Geography Analysis
APAC Professional Audio Visual Systems Market
Asia-Pacific holds the largest 29.55% share and a leading 5.78% CAGR, propelled by mega-projects in transportation, hospitality, and smart cities. National digitization policies funnel funds into campus networks and immersive classrooms in China, India, and Indonesia. Local manufacturing clusters compress lead times and cost structures, allowing rapid adoption of next-generation LED and AI processing. Japan and South Korea supplement volume with research and development breakthroughs in micro-LED packaging and voice AI, enhancing export competitiveness. Mature integrators forge joint ventures to navigate regional procurement and language diversity, a tactic that expands the professional audio visual system market footprint.
North America Professional Audio Visual Systems Market
North America posts steady upgrades anchored by accessibility mandates and hybrid work normalization. The FCC captioning rule multiplies demand for AI transcription engines and adaptive UI elements. Enterprises revisit refresh cycles every three to five years to maintain parity between in-office and remote experiences. Canada boosts market momentum through investments in broadcast studios and distance-learning infrastructure across dispersed territories. Mexico’s maquiladora centers adopt AV-over-IP to coordinate cross-border supply chains, keeping the region integral to the professional audio visual system market.
Europe Professional Audio Visual Systems Market
Europe advances on the back of sustainability legislation requiring lower energy consumption and circular-economy design. Germany and France prioritize passive cooling enclosures and firmware that schedules low-power modes. The United Kingdom accelerates the adoption of AI analytics in transport hubs to manage passenger density. Eastern European countries allocate recovery funds to upgrade civic theatres and regional universities. Pan-European data-privacy laws elevate secure cloud control as a competitive edge among vendors, shaping procurement policies across the professional audio visual system market.
Regulatory Landscape
Professional AV systems sold into enterprise, education, retail, and venues must comply with product safety and electromagnetic compatibility (EMC) requirements across major markets. For safety, IEC 62368-1 is a core reference for audio/video and ICT equipment risk-based design, shaping certification testing and documentation for OEMs and private-label brands. For EMC, EU market access continues to be governed by the EMC Directive (2014/30/EU), while Great Britain maintains parallel requirements under the Electromagnetic Compatibility Regulations 2016. Updates in multimedia emission standards, including prEN IEC 55032:2026 and related IEC EMC publications, reinforce the need for compliant shielding, filtering, and firmware design practices for networked endpoints.
Policy is also steering procurement toward accessibility, security, and sustainability. In the United States, the FCC set an August 17, 2026 compliance date for closed captioning display settings requirements, raising the bar for readily accessible captioning controls in conferencing and display workflows used in professional environments. The FCC also tightened Equipment Authorization pathways tied to communications supply chain security, including limits on using Supplier's Declaration of Conformity for certain equipment as of December 2025, with additional guidance released in January 2026. In Europe, the Ecodesign for Sustainable Products Regulation (EU) 2024/1781 expands the framework for durability, repairability, and product information, and the European Commission outlined transition provisions through December 31, 2026 for multiple product groups previously covered under the Ecodesign Directive. This pushes AV vendors to formalize circularity and energy-related compliance roadmaps alongside performance upgrades.
Value Chain Analysis
The professional AV value chain begins with upstream components, including semiconductors, sensors, optics, connectors and cabling, power supplies, and LED/LCD display elements, before moving into OEM/ODM manufacturing and software development for control, collaboration, and device management. Distribution typically runs through authorized distributors and specialized resellers, while system integrators (for example, AVI-SPL, Diversified, and AVI Systems) serve as the primary route to market for enterprise, education, retail, and venues through design, installation, commissioning, and ongoing support. Across the study period, value has shifted toward software-defined control, AV-over-IP transport, analytics, and remote operations, which increases the importance of interoperability certifications and secure firmware lifecycle management.
Midstream and downstream dynamics are being reshaped through ecosystem partnerships and cloud-managed services. Multi-vendor alliances and certified room bundles link displays, audio, cameras, and collaboration workflows, including PPDS with Shure, and Barco expanding certified bundles with partners such as Sennheiser, Logitech, and Huddly. Infrastructure partnerships also support AV-over-IP deployments, such as NETGEAR with Riedel aligning switching and processing. Cloud platforms are pulling hardware portfolios into unified monitoring and subscription operations, illustrated by Legrand AV expanding connections of brands such as Vaddio, Luxul, Da-Lite, and C2G to the Xyte cloud platform. On the constraint side, the chain remains exposed to component availability and trade actions, including 2025 tariff-related cost and lead-time pressures on displays, projectors, audio processors, and connectivity. This has accelerated second-sourcing, encouraged inventory buffering where feasible, and supported geographic diversification of assembly and procurement.
Competitive Landscape
Competition is moderate and trending toward consolidation. Acuity Brands finalized a USD 1.215 billion acquisition of QSC in January 2025, aiming to fuse lighting, controls, and the Q-SYS cloud platform into a unified smart-building offering. Scale allows cost leverage in silicon sourcing and accelerates roadmap execution. Large integrators such as AVI-SPL and Diversified broaden global reach through regional takeovers, expanding managed-service annuities, and strengthening relationships with multinational clients.
Differentiation is shifting from proprietary hardware toward software extensibility, cybersecurity compliance, and AI-driven diagnostics. Vendors embed machine-learning algorithms that predict amplifier failures or microphone misuse, cutting downtime and service calls. Suppliers able to prove low total emissions during product life cycles gain traction in Europe and parts of Asia-Pacific as sustainability reporting tightens. The professional audio visual system market favors brand portfolios that span capture, processing, display, and analytics, enabling single-vendor fulfillment for complex bids.
Niche disruptors exploit cloud-native architectures and subscription pricing that replace capex with opex. Their platforms integrate APIs for facility management and IoT sensors, converting AV endpoints into data storytellers. Established manufacturers respond with open SDKs and marketplace ecosystems, signaling a shift toward collaborative innovation. Over the medium term, software revenue share is expected to rise faster than hardware, altering valuation metrics for publicly listed firms in the professional audio visual system industry.
Professional Audio Visual Systems Industry Leaders
-
AVI-SPL Inc.
-
Diversified
-
AVI Systems Inc.
-
Solotech Inc.
-
Kinly BV
- *Disclaimer: Major Players sorted in no particular order
Professional Audio Visual Systems Market Companies Covered in this Report
- AVI-SPL Inc.
- Diversified
- AVI Systems Inc.
- Ford Audio-Video LLC
- CCS Presentation Systems Inc.
- Solutionz Inc.
- Electrosonic Group
- Solotech Inc.
- Conference Technologies Inc.
- Vistacom Inc.
- Kinly BV
- Vega Global
- IDNS Ltd.
- Ricoh USA Inc.
- Midwich Group plc
- Wesco Anixter Inc.
- Audinate Group Ltd.
- NMK Electronics Enterprises
- Qvest Group
- ACTLD SA
- Almo Professional A/V (Exertis Almo)
- ClearOne Inc.
- Kramer Electronics Ltd.
Market Opportunities and Future Outlook
A large whitespace remains in standards-led interoperability and the practical rollout of AV-over-IP across multi-vendor environments, particularly where buyers want to avoid single-ecosystem lock-in. In June 2026, AIMS formally launched IPMX as a certifiable standard for any-vendor interoperability at ISE 2026, which established a clearer certification pathway for manufacturers and a more modular design basis for integrators building networked video distribution, control, and collaboration systems. That direction supports opportunities for vendors packaging IPMX-aligned endpoints with security-hardened management, and for integrators standardizing deployment templates across sites while retaining flexible vendor choice.
Services-led operations and AI-enabled accessibility also provide a monetization lane tied to compliance requirements and hybrid work governance by IT. The FCC accessibility deadline for closed captioning display settings (August 17, 2026) and the ongoing migration of AV processing to cloud and IP networks increase demand for software features such as transcription/captioning controls, policy-based room configurations, and centralized device monitoring. Market activity around these themes is visible in industry convenings, including AVIXA reporting that InfoComm 2026 in Las Vegas drew 28,132 verified attendees from 94 countries, with programming centered on AI-powered collaboration and workplace transformation. This reinforces buyer focus on usable AI features and managed operations. For vendors and integrators, it supports attaching recurring revenue through remote management, cybersecurity-aligned update services, and outcome-based workplace experience frameworks that extend beyond one-time hardware refresh cycles.
Recent Industry Developments in Professional Audio Visual Systems Market
- June 2026: AVI-SPL launched expanded Enterprise Managed Services spanning collaboration platforms, voice services, meeting spaces, and digital signage. The move strengthens recurring revenue and positions the integrator for enterprise customers standardizing global collaboration and signage operations under IT-managed service models.
- April 2026: Diversified announced a strategic collaboration with Comcast Technology Solutions to support the expansion of a global Broadcast Operations Center at Comcast's Dry Creek facility in Colorado, built around SMPTE ST 2110 IP infrastructure. The project underscores the convergence of broadcast engineering and professional AV integration, elevating demand for IP-based design, commissioning, and ongoing operational support capabilities.
- January 2025: Acuity Brands completed its USD 1.215 billion acquisition of QSC, adding Q-SYS cloud-manageable audio, video, and control to its Intelligent Spaces Group. The combination expands smart-building platform depth and increases competitive pressure on integrators and OEMs to deliver unified control, analytics, and lifecycle software across AV, lighting, and building systems.
Professional Audio Visual Systems Market Report Scope and Research Methodology
Market Definition and Coverage
This market covers professional audio-visual systems sold and deployed for business and institutional use, where audio, video, control, and distribution equipment work together to present, communicate, or stream content in venues and facilities.
Scope exclusions: We exclude consumer-only AV devices meant primarily for home entertainment use and informal personal use cases.
Segments Covered in This Report
- By Type
- Capture and Production Equipment
- Video Projection
- Streaming Media, Storage and Distribution
- Services
- Other Types
- By Component
- Audio Equipment (mics, mixers, amps)
- Display and Projection Systems
- Control and Processing
- Storage and Distribution Hardware
- By End-user Vertical
- Corporate
- Venues and Events
- Retail
- Media and Entertainment
- Education
- Government
- Healthcare
- Other End-user Verticals
- By Geography
- North America
- United States
- Canada
- Mexico
- South America
- Brazil
- Argentina
- Rest of South America
- Europe
- Germany
- United Kingdom
- France
- Rest of Europe
- Asia-Pacific
- China
- Japan
- India
- South Korea
- South-East Asia
- Rest of Asia-Pacific
- Middle East and Africa
- Middle East
- Saudi Arabia
- United Arab Emirates
- Rest of Middle East
- Africa
- South Africa
- Egypt
- Rest of Africa
- Middle East
- North America
Data Sources, Market Sizing, and Validation
Desk Research
Desk research starts by mapping the product and deployment boundaries, and then collecting public signals that show where demand is coming from. We rely on US Census Bureau and Bureau of Labor Statistics datasets, International Telecommunication Union indicators, World Bank macro series, and UN Comtrade trade statistics for relevant electronics categories.
To keep the market model realistic, we also review company annual reports, investor presentations, earnings transcripts, and credible press coverage that describe project pipelines, order timing, and pricing moves. Patent databases and standards-related references are used to understand which technology shifts are commercialized faster (for example, newer conferencing and signage workflows). Where needed, paid subscriptions for company financials and intelligence, news and financials, and patent databases are used to cross-check revenue splits and product mix assumptions. These sources are illustrative, and other public references were also used for data collection, validation, and clarification.
Primary Interviews and Surveys
Primary work is used to test the desk assumptions that drive the total most, especially deployment cycles, pricing direction, and what buyers count as a complete professional AV system versus adjacent IT spend. We speak with a mix of OEM and component side experts, distributors and integrators, and end users across corporate, education, healthcare, retail, and venues, and we validate patterns across APAC, EMEA, and the Americas.
Distribution of primary research fieldwork respondents
| Company type | Respondent position | Region |
|---|---|---|
| Top tier: 28% | CXOs: 21% | APAC: 41% |
| Mid tier: 50% | Functional/Unit leaders: 28% | EMEA: 36% |
| Smaller Players: 22% | Managers: 51% | Americas: 23% |
Market-Sizing & Forecasting
Sizing is built using a top-down approach where macro demand pools are reconstructed from professional deployment activity, and then filtered into AV-relevant spend using penetration and mix factors. To reduce overcounting, the totals are corroborated with selective bottom-up checks such as sampled average selling prices times unit volumes for key equipment lines, alongside channel checks with integrators and distributors.
Inputs are chosen because they link closely to purchase triggers in this market, and they can be tracked consistently over time. The model uses indicators such as new and retrofit commercial floor space activity, corporate collaboration adoption intensity (meeting rooms and training spaces), event and venue upgrade cycles, education and government facility modernization budgets, and technology shift variables such as display and projector mix and typical refresh intervals. Where coverage gaps appear in supplier roll ups, we apply conservative uplift factors that are then tested in interviews before they are allowed into the final total.
For forecasting, scenario analysis is applied around a central view, and it is supported by simple multivariate regression on the strongest demand drivers so that yearly changes stay tied to real activity. Assumptions on pricing progression and mix shifts are refreshed with expert inputs so the forecast reflects expected movement in services share, control and processing value, and conferencing and signage deployments.
Data Validation & Update Cycle
Validation is done by comparing the model output against multiple independent signals, and then checking whether the direction makes sense at a regional level. When the market total moves faster than expected, the drivers are traced back to the variables that changed, and the assumptions are reviewed in a second analyst pass before sign-off.
If a large variance is found, follow-up calls are triggered with the most relevant respondent group, such as integrators for project timing or end users for refresh behavior. Reports are refreshed annually, and interim updates are completed when material events occur that can shift demand or pricing. Before delivery, a fresh update pass is performed so clients receive the latest view aligned to the current data cut.
Mordor Intelligence's Professional Audio Visual Systems Market Sizing Compared With Other Published Estimates
Different published market sizes for professional audio visual systems do not always mean the demand picture changed, because studies can count different product bundles, use different year cuts, or mix services and hardware in different ways. The benchmark table helps show how these scope and timing choices create visible spreads in the numbers.
Key differences usually come from what is treated as a professional AV system versus adjacent IT and consumer equipment, and from how pricing and mix changes are handled as adoption shifts toward newer conferencing, signage, and control workflows. Currency conversion timing, the use of an aggressive versus a base case scenario, and how often assumptions are refreshed can also change the stated market size for the same year.
Benchmark comparison
| Source | Market Size | Gaps in Research Methodology |
|---|---|---|
| Mordor Intelligence | USD 308.23 B (2026) | |
| Global Consultancy A | USD 282.60 B (2024) | Uses an earlier base year and a longer forecast window, and its scope description suggests broader bundling of software platforms and conferencing tools that can overlap with general enterprise IT spend. |
| Industry Publisher B | USD 253.54 B (2024) | Presents a 2024 view and groups hardware, software, and services together with technology and resolution lenses, which can shift value between AV systems and surrounding networking and compute purchases depending on what is counted. |
The table points to a year-cut and scope effect more than a disagreement on demand direction, and in Mordor Intelligence's model the counted value is tied to professional deployments across display and projection, audio, control and processing, and distribution components rather than wider enterprise IT stacks. With checks that link estimates back to deployment cycles, mix, and realistic pricing movement, the final total stays easier to trace and repeat when the model is updated.
Key Questions Answered in the Report
How large is the professional audio visual system market in 2026?
The professional audio visual system market size is USD 308.23 billion in 2026.
What is the expected growth rate through 2031?
Aggregate revenue is projected to advance at a 4.42% CAGR, reaching USD 382.74 billion by 2031.
Which region leads spending on professional AV solutions?
Asia-Pacific holds the highest spending share at 29.55% and also records the fastest 5.78% CAGR.
Which product type commands the most revenue?
Capture and Production Equipment leads with 30.25% revenue share, reflecting the boom in content creation.