Visualization Instruments For MIS Market Size and Share
Market Overview
| Study Period | 2020 - 2031 |
|---|---|
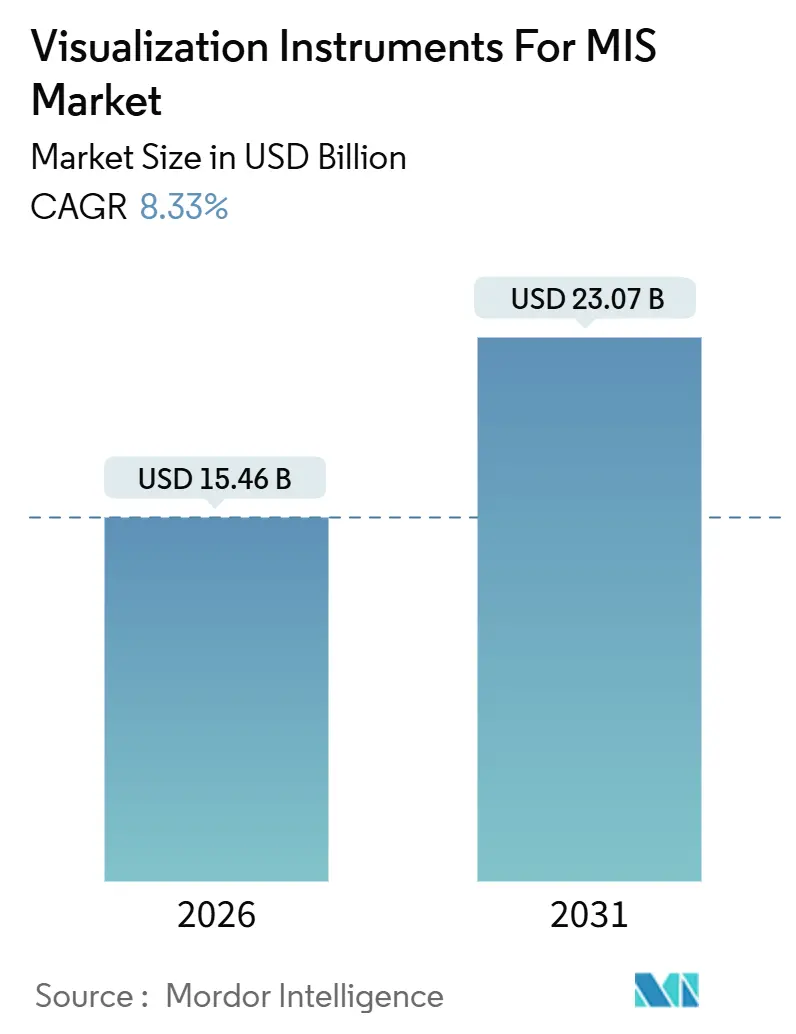
| Market Size (2026) | USD 15.46 Billion |
| Market Size (2031) | USD 23.07 Billion |
| Growth Rate (2026 - 2031) | 8.33% CAGR |
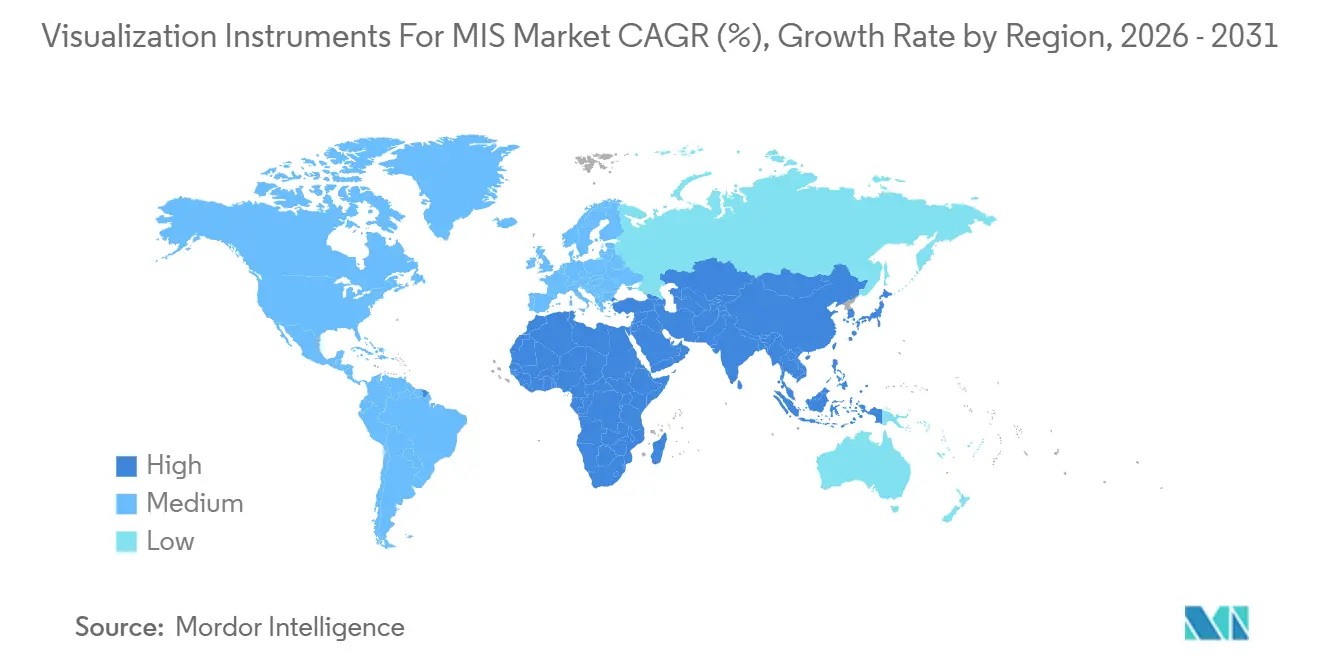
| Fastest Growing Market | Asia Pacific |
| Largest Market | North America |
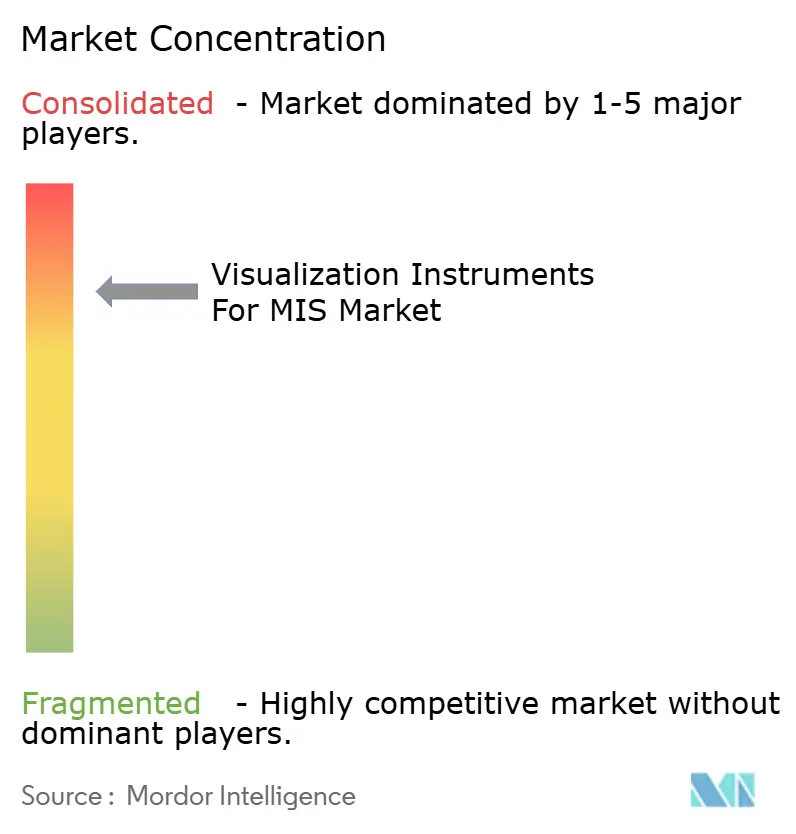
| Market Concentration | High |
Major Players *Disclaimer: Major Players sorted in no particular order Image © Mordor Intelligence. Reuse requires attribution under CC BY 4.0. | |
Visualization Instruments For MIS Market Analysis by Mordor Intelligence
The Visualization Instruments For MIS Market size is estimated at USD 15.46 billion in 2026, and is expected to reach USD 23.07 billion by 2031, at a CAGR of 8.33% during the forecast period (2026-2031).
The underlining robust demand for upgraded optical platforms, single-use scopes, and robotic vision add-ons. Hospital operating rooms that retire legacy HD stacks in favor of 4 K and 8 K systems realise shorter case times, smoother turnover, and higher imaging precision, while ambulatory surgery centers (ASCs) lean on disposable scopes to bypass reprocessing backlogs and infection-control risk. A growing installed base of more than 9,000 da Vinci robots by end-2025 locks providers into proprietary camera heads, vision carts, and light sources that carry attractive margin profiles for vendors.[1]U.S. Food and Drug Administration, “FDA Clears Intuitive Surgical's da Vinci 5 Surgical System,” U.S. FDA, fda.gov Modular challengers such as Hugo and Versius supply open-architecture consoles but still generate ancillary pull-through for imaging modules. Simultaneously, a wave of FDA clearances for AI-assisted analytics—led by GI Genius and Paradigm—creates a parallel software income stream that cushions hardware commoditization.
Key Report Takeaways
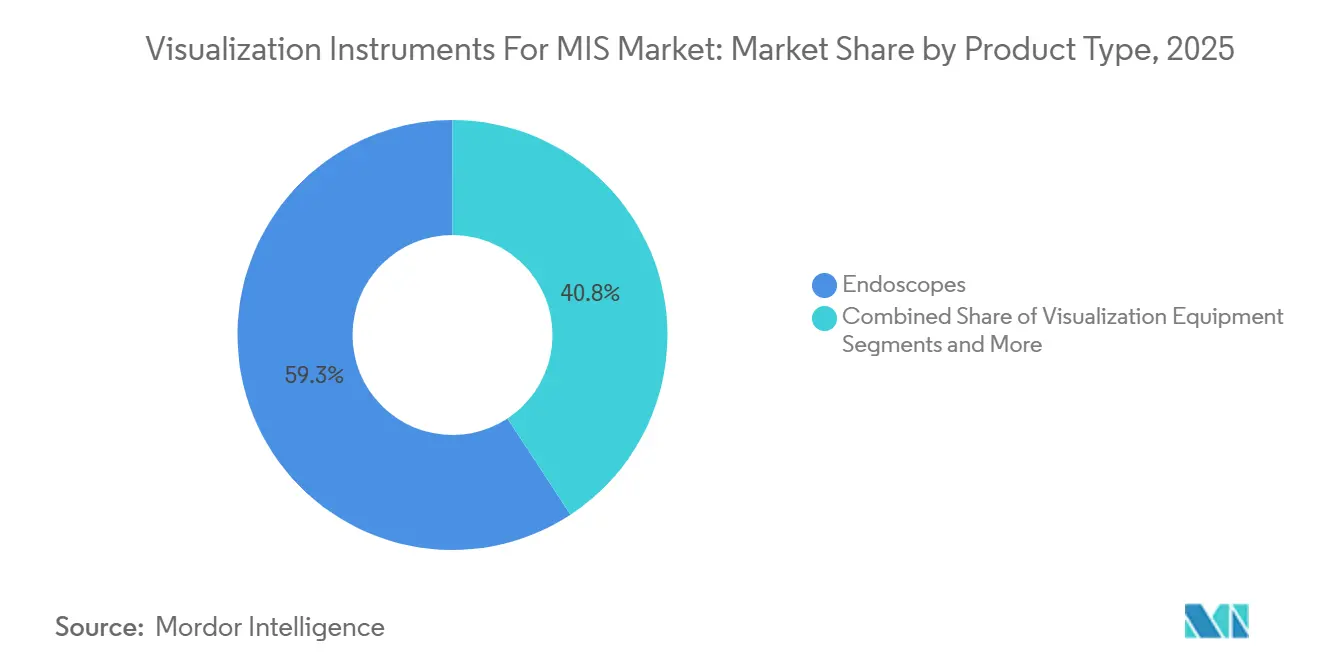
- By product type, endoscopes accounted for 59.25% of visualization instruments for MIS market share in 2025, while robotic vision modules are forecast to expand at a 12.52% CAGR through 2031.
- By technology, HD systems led with 51.43% of visualization instruments for MIS market share in 2025, whereas AI-assisted image analytics is projected to grow at a 12.67% CAGR to 2031.
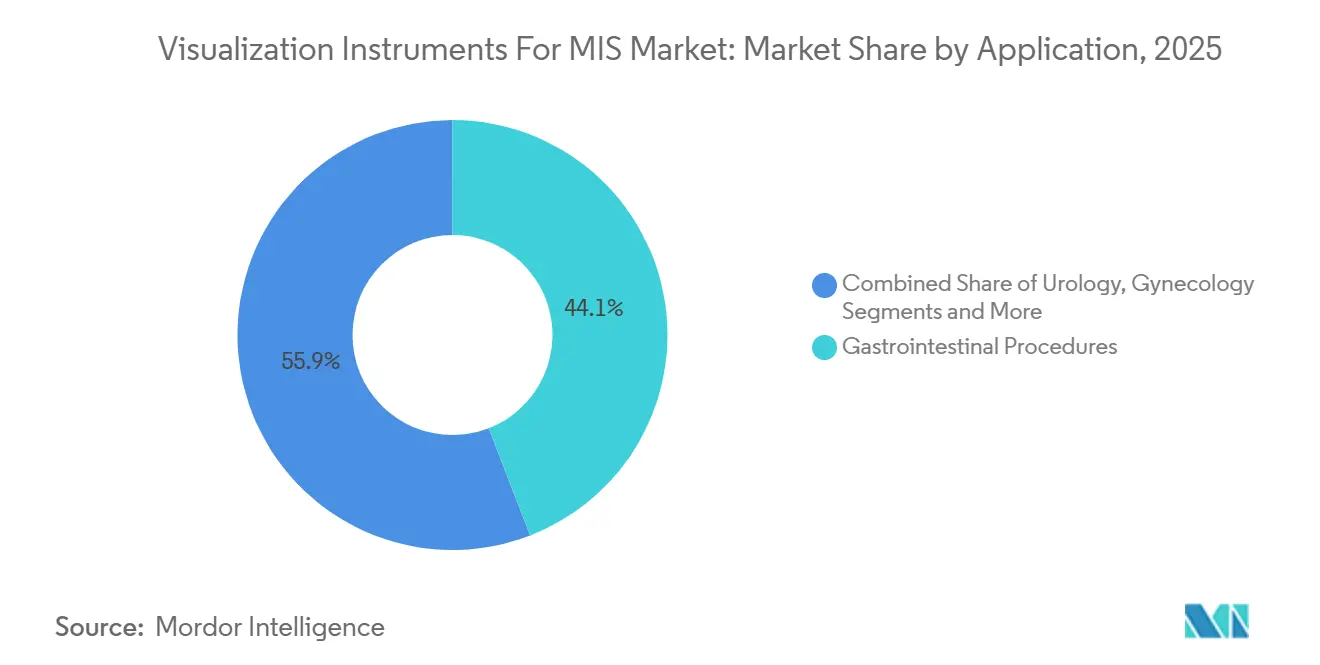
- By application, gastrointestinal procedures held 44.11% revenue share of the visualization instruments for MIS market size in 2025; pulmonology and bronchoscopy are advancing at an 11.43% CAGR through 2031.
- By end-user, hospitals retained 59.63% revenue share in 2025, whereas ASCs are projected to grow at a 10.34% CAGR to 2031.
- By geography, North America commanded 34.68% of visualization instruments for MIS market share in 2025, but Asia–Pacific is set to post the fastest CAGR at 10.57% during the forecast period.
Note: Market size and forecast figures in this report are generated using Mordor Intelligence’s proprietary estimation framework, updated with the latest available data and insights as of January 2026.
Global Visualization Instruments For MIS Market Trends and Insights
Drivers Impact Analysis*
| Driver | (~) % Impact on CAGR Forecast | Geographic Relevance | Impact Timeline |
|---|---|---|---|
| AI-Enhanced Image-Guided Surgery Adoption Surge | +1.8% | North America & Europe, early APAC metros | Medium term (2-4 years) |
| Widespread Shift to Single-Use Visualization Scopes | +1.5% | Global, led by North America & Western Europe | Short term (≤2 years) |
| 4 K/8 K & 3-D Video Processor Upgrades Across OR Suites | +1.2% | North America, Europe, GCC, Australia | Medium term (2-4 years) |
| Ambulatory Surgery Center Boom in High-Income Countries | +1.4% | United States, Canada, Germany, United Kingdom | Long term (≥4 years) |
| Growing Robotic MIS Installed Base Drives Vision Module Pull-Through | +1.6% | Global, concentration in North America & APAC | Long term (≥4 years) |
| XR Platforms for Intra-Op Navigation & Remote Proctoring | +0.9% | North America & Europe, pilot APAC rollouts | Long term (≥4 years) |
| Source: Mordor Intelligence | |||
AI-Enhanced Image-Guided Surgery Adoption Surge
Real-time overlays that delineate tumor margins, vasculature, and instrument trajectory shave 12%-18% off median case time, a benefit that resonates with ASC business models tied to fixed reimbursements.[2]Medtronic plc, “Medtronic Receives FDA Clearance for GI Genius,” Medtronic, news.medtronic.com The Paradigm system secured 510(k) clearance for spine and cranial procedures in April 2025, marking the first AI-enabled stereoscopic guidance tool in neurosurgery.[3]Proprio Inc., “Paradigm Surgical Navigation Clearance,” AccessWire, accesswire.com Intuitive’s da Vinci 5 added automated instrument tracking in October 2025, giving credentialing committees quantitative skill metrics. Continuous-learning algorithms must navigate ISO 13485 and IEC 62304 compliance, yet the lack of separate CPT codes means hospitals absorb USD 50,000–USD 150,000 annual license fees. The premium is often offset by lower complication rates that reduce readmissions over three-year quality-reporting cycles.
Widespread Shift to Single-Use Visualization Scopes
Disposable scopes eradicate cross-contamination risk and become economical once per-cycle reprocessing costs top USD 150. aScope 5 garnered 18% of U.S. bronchoscopy volume by 2025, while Exalt Model D duodenoscopes reached 320 hospitals within a year of FDA clearance. Medicare still pays USD 1,200 for a colonoscopy regardless of scope type, leaving ASCs to shoulder the USD 80-USD 200 premium, but improved turnover helps recoup the delta in high-volume centers. Each disposable scope adds 0.8 kg of medical waste, prompting the European Union to draft extended-producer-responsibility rules slated for 2028 that will require manufacturers to fund recycling. Vendors are already piloting closed-loop take-back programs to blunt environmental criticism and secure procurement contracts with green-procurement-oriented health systems.
4 K/8 K & 3-D Video Processor Upgrades Across OR Suites
Ultra-high-definition cameras deliver 8.3 megapixels per frame, enabling surgeons to discern nerve bundles and lymphatic channels that HD video blurs. Olympus installed 4,200 VISERA 4 K stacks by 2025, and Stryker placed 1,800 of its 1688 platforms, often bundled with Mako robotic arms for orthopedics. KARL STORZ showcased an 8 K prototype at MEDICA 2024 but hinges commercial release on display-panel supply from LG and Samsung. Three-dimensional optics trim laparoscopic suturing errors by 22%, though some surgeons report eyestrain with polarized glasses, slowing adoption. Hospitals that upgraded from HD to 4 K between 2023 and 2025 lowered median OR time in complex GI and urology cases by 9%, boosting room throughput to 1.2 additional cases per day.
Ambulatory Surgery Center Boom in High-Income Countries
ASCs performed 68% of U.S. outpatient surgeries in 2025, up from 54% in 2019, catalyzed by CMS expansion of the ASC-covered list to include total knee arthroplasty and spine fusion. Private-equity funds poured USD 12.3 billion into ASC acquisitions during 2024, forming buying groups that negotiate equipment volume discounts. SCA Health standardised 4 K visualization across 180 of its 320 facilities under a five-year, USD 240 million contract with Stryker. Germany’s statutory insurers approved reimbursement for 42 outpatient procedures from January 2025, driving a 14% rise in ASC openings. The United Kingdom invested GBP 1.8 billion (USD 2.3 billion) in community diagnostic hubs that integrate endoscopy rooms with single-use scopes to curb infection overhead.
Restraints Impact Analysis*
| Restraint | (~) % Impact on CAGR Forecast | Geographic Relevance | Impact Timeline |
|---|---|---|---|
| High Capital Outlay & Payback-Period Uncertainty | -0.8% | Global, acute in mid-tier hospitals & rural ASCs | Short term (≤2 years) |
| Margin Squeeze from Import Tariffs on Optical Electronics | -0.6% | North America, Europe (post-Brexit UK) | Medium term (2-4 years) |
| Fragmented Regulatory Pathways for AI Vision Algorithms | -0.5% | Global, pronounced in EU & emerging APAC | Medium term (2-4 years) |
| Looming Global Shortage of Sterile Processing Technicians | -0.7% | United States, Canada, Western Europe, Australia | Long term (≥4 years) |
| Source: Mordor Intelligence | |||
High Capital Outlay & Payback-Period Uncertainty
A fully configured 4 K stack—camera head, light source, processor, twin 55-inch monitors, and integration software—costs USD 450,000–USD 650,000. Community hospitals operating on 2%-3% margins postponed USD 4.2 billion in equipment orders during 2024, prioritizing staffing and EHR upgrades. Medicare cut screening-colonoscopy fees by 3.8% in the 2025 fee schedule, lengthening capital payback schedules. Leasing spreads cost over 72 months but locks facilities into technology that might be eclipsed by 8 K or AI-native systems mid-term. Vendor usage-based models charge USD 150-USD 300 per procedure and shift risk to manufacturers, compressing vendor margin by 6-9 points.
Margin Squeeze from Import Tariffs on Optical Electronics
Section 301 tariffs of 7.5%-25% on Chinese CMOS sensors, LEDs, and fiber-optic cables inflated landed costs for mid-tier vendors. CONMED absorbed USD 18 million in tariff expense during 2024, dropping gross margin from 58.2% to 55.7%. Stryker and Olympus rerouted final assembly to Mexico and Vietnam, but tooling transfers added 9-12 months to product launches and 4%-6% to per-unit cost. Post-Brexit customs duties averaging 3.2% forced KARL STORZ to open a Birmingham warehouse in 2024, lifting annual distribution overhead by GBP 2.4 million (USD 3.1 million).
*Our forecasts treat driver/restraint impacts as directional, not additive. The impact forecasts reflect baseline growth, mix effects, and variable interactions.
Segment Analysis
By Product Type: Advancing Mix of Reusable and Robotic Optics
Endoscopes generated 59.25% of the visualization instruments for MIS market in 2025, powered by high-volume GI and bronchoscopy suites. Single-use variants now displace reusable duodenoscopes in infection-prone ERCP, and disposable bronchoscopes have grown to 18% U.S. share. Robotic vision modules hold a smaller current slice, yet they are the fastest-moving component, on track for a 12.52% CAGR and poised to lift overall visualization instruments for MIS market size over the forecast window. Visualization equipment—camera heads, light sources, processors, and monitors—rides the wave of mandated 4 K upgrades, with Olympus placing 4,200 VISERA 4 K systems by end-2025. Fluorescence-enabled technology such as Firefly and SPY-PHI now ships on 32% of robotic and laparoscopic platforms, improving perfusion assessment in colorectal and bariatric surgery. Image-management software is nascent but gaining traction as hospitals consolidate multiple video feeds into AI-ready archives. Large-format 55-inch 4 K monitors from Barco and Sony posted USD 1.8 billion in revenue during 2026, reflecting synchronized refresh cycles with camera heads.


By Technology: AI and Ultra-High-Definition Outpace Legacy HD
HD systems at ≤1080 p still held 51.43% share in 2025, illustrating the weight of legacy fleets purchased between 2015 and 2020. Even so, every capital cycle increasingly favors 4 K, 8 K, and AI-assisted platforms, moving the visualization instruments for MIS market toward higher resolution baselines. AI-powered analytics are projected to grow 12.67% CAGR through 2031 as modules like GI Genius and Paradigm convert FDA clearance into broad hospital uptake. Three-dimensional optics occupy 22% of laparoscopic installations but face headwinds from surgeon discomfort and USD 80,000 camera premiums. Fluorescence and narrow-band imaging add real-time tissue discrimination, and Fujifilm’s ELUXEO 8000 platform launched in October 2025 with a unified processor-light source design. XR-enabled navigation remains <3% of visualization instruments for MIS industry revenue, yet strategic acquisitions—Stryker’s USD 3 billion Vocera deal—signal future integration between AR headsets and communication platforms.
By Application: Pulmonology Sprints Ahead of GI Dominance
Gastrointestinal cases provided 44.11% of 2025 revenue, anchored by routine colonoscopy and upper-GI endoscopy volumes. However, pulmonology and bronchoscopy promise an 11.43% CAGR as the U.S. Preventive Services Task Force widened lung-cancer screening eligibility to adults aged 50-80. Robotic bronchoscopy surpassed 100,000 procedures by mid-2025, and new reimbursement pathways are under review. Urology, gynecology, and orthopedics continue to benefit from rising robot penetrations and ASC shifts. Neurosurgery claims premium device pricing—USD 850,000 per Paradigm console—given the need for AI-guided stereoscopy in skull-base tumors.
By End-User: Leasing and Disposable Scopes Redefine Procurement
Hospitals retained 59.63% share in 2025, but visualization instruments for MIS market size gains increasingly come from ASCs expanding at 10.34% CAGR. Medicare’s enlarged ASC list unlocked USD 8.2 billion in annual reimbursements, and 62% of ASC visualization platforms were financed via operating leases in 2025. Specialty GI and pulmonology clinics adopt disposable scopes to avoid staffing sterile-processing rooms, while academic centers purchase AR/VR systems for resident training. FDA quality-system rules push facilities toward vendors that bundle equipment with service contracts, a model embraced by Olympus and Stryker.
Geography Analysis
North America commanded 34.68% of global revenue in 2025. Although Medicare trimmed screening-colonoscopy fees by 3.8%, USD 12.3 billion in private-equity funding buoyed ASC equipment demand. Canada allotted CAD 2.1 billion (USD 1.6 billion) in 2024 to reduce surgical backlogs, purchasing endoscopy suites fitted with single-use scopes. Mexico’s IMSS tendered 420 endoscopy systems in 2025, stipulating Spanish-language interfaces and local service coverage. Section 301 tariffs on Chinese optical parts compressed vendor margins, prompting supply-chain shifts to Mexico and Vietnam.
Asia–Pacific is the fastest-growing region at a 10.57% CAGR. China’s Healthy China 2030 earmarked CNY 1.2 trillion (USD 165 billion) for hospital upgrades through 2030 and cleared 18 domestic endoscope models in 2025. Olympus opened a Shanghai plant in 2024 to localize manufacturing. India’s Ayushman Bharat extended coverage for laparoscopic gall-bladder and hernia surgery, spurring demand for visualization systems under USD 150,000. South Korea mandated 4 K endoscopy in tertiary hospitals by 2027, and Australia granted fast-track approval for AI navigation in 2025.
In Europe, Germany’s statutory insurers added 42 ASC-eligible procedures in January 2025, fostering a 14% rise in outpatient centers. The United Kingdom invested GBP 1.8 billion in community diagnostic hubs featuring disposable-scope endoscopy rooms. France shortened AI-device approval timelines to 18 months via new ANSM guidelines issued June 2025. Post-Brexit customs duties motivated KARL STORZ to establish a Birmingham warehouse, lifting overhead costs but safeguarding service response times. GCC countries budgeted USD 18 billion for turnkey OR builds between 2024 and 2028, prioritizing 4 K bundles with Arabic user interfaces.

Competitive Landscape
The visualization instruments for the MIS market are moderately concentrated. Intuitive links every robot to a USD 550,000 vision cart. Olympus controls its own CMOS sensor fabrication in Aizu, insulating margins against tariff swings. Stryker leverages bundled contracts with ASC chains such as SCA Health to place 4 K vision and negotiate multi-year service at scale. Ambu’s single-use portfolio posted EUR 890 million (USD 970 million) in fiscal-2025 revenue, up 22% year-over-year, underscoring disposable adoption. Patent applications in fluorescence imaging and AI polyp detection grew 34% from 2023 to 2025, highlighting intensifying R&D competition. Emerging players like Proprio and Augmedics tap white-space niches in AI and XR navigation, positioning themselves as acquisition targets for larger strategics.
Visualization Instruments For MIS Industry Leaders
Olympus Corp.
Stryker Corp.
Johnson & Johnson (ETHICON)
KARL STORZ
Boston Scientific Corporation
- *Disclaimer: Major Players sorted in no particular order

Recent Industry Developments
- January 2026: Intuitive received FDA clearance for the da Vinci 5 system in selected cardiac procedures, including mitral valve repair.
- October 2025: Fujifilm launched the ELUXEO 8000 imaging system, an integrated processor–light-source platform targeting high-volume endoscopy suites.
- May 2025: Olympus obtained 510(k) clearance for EZ1500 gastroscopes and colonoscopes featuring Extended Depth-of-Field optics.


Global Visualization Instruments For MIS Market Report Scope
Visualization instruments for minimally invasive surgery (MIS) are imaging tools, such as endoscopes, laparoscopes, and cameras, designed to provide high-definition, magnified views of internal organs through small incisions, aiding in diagnosis and treatment.
The Visualization Instruments for MIS Market Report is segmented by Product Type, Technology, Application, End User, and Geography. By Product Type, the market is segmented into Endoscopes, Visualization Equipment, Robotic Vision Modules, and AR/VR/XR Platforms. By Technology, the market is segmented into HD, 3-D, 4K/8K Ultra-HD, Fluorescence & Spectral Imaging, AI-Assisted Image Analytics, and XR-Enabled Navigation. By Application, the market is segmented into Gastrointestinal (GI), Urology, Gynecology, Pulmonology, Orthopedics, General & Bariatric Surgery, ENT, Neurosurgery, and Cardiology. By End User, the market is segmented into Hospitals, ASCs, and Specialty Clinics. By Geography, the market is segmented into North America, Europe, Asia-Pacific, Middle East & Africa, and South America. The market report also covers the estimated market sizes and trends for 17 countries across major regions globally. Market Forecasts are Provided in Terms of Value (USD).
| Endoscopes | Rigid Endoscopes |
| Flexible Re-usable Endoscopes | |
| Single-Use/Disposable Endoscopes | |
| Visualization Equipment | High-Definition Camera Systems |
| Light Sources & Imaging Modules | |
| Video Processors & Recorders | |
| Displays & Monitors (2-D, 3-D, 4K/8K) | |
| Fluorescence / NBI / NIR Add-ons | |
| Image-Management & OR Integration Software | |
| Robotic Vision Modules | |
| AR/VR/XR Visualization Platforms |
| HD |
| 3-D |
| 4K / 8K Ultra-HD |
| Fluorescence & Spectral Imaging |
| AI-Assisted Image Analytics |
| XR-Enabled Navigation |
| Gastrointestinal Procedures |
| Urology |
| Gynecology |
| Pulmonology / Bronchoscopy |
| Orthopedics / Arthroscopy |
| General & Bariatric Surgery |
| ENT & Head-and-Neck |
| Neurosurgery & Spine |
| Cardiology / Structural Heart |
| Hospitals |
| Ambulatory Surgical Centers |
| Specialty Clinics |
| North America | United States |
| Canada | |
| Mexico | |
| Europe | Germany |
| France | |
| United Kingdom | |
| Italy | |
| Spain | |
| Rest of Europe | |
| Asia-Pacific | China |
| Japan | |
| India | |
| South Korea | |
| Australia | |
| Rest of Asia-Pacific | |
| Middle East & Africa | GCC |
| South Africa | |
| Rest of Middle East & Africa | |
| South America | Brazil |
| Argentina | |
| Rest of South America |
| By Product Type | Endoscopes | Rigid Endoscopes |
| Flexible Re-usable Endoscopes | ||
| Single-Use/Disposable Endoscopes | ||
| Visualization Equipment | High-Definition Camera Systems | |
| Light Sources & Imaging Modules | ||
| Video Processors & Recorders | ||
| Displays & Monitors (2-D, 3-D, 4K/8K) | ||
| Fluorescence / NBI / NIR Add-ons | ||
| Image-Management & OR Integration Software | ||
| Robotic Vision Modules | ||
| AR/VR/XR Visualization Platforms | ||
| By Technology | HD | |
| 3-D | ||
| 4K / 8K Ultra-HD | ||
| Fluorescence & Spectral Imaging | ||
| AI-Assisted Image Analytics | ||
| XR-Enabled Navigation | ||
| By Application | Gastrointestinal Procedures | |
| Urology | ||
| Gynecology | ||
| Pulmonology / Bronchoscopy | ||
| Orthopedics / Arthroscopy | ||
| General & Bariatric Surgery | ||
| ENT & Head-and-Neck | ||
| Neurosurgery & Spine | ||
| Cardiology / Structural Heart | ||
| By End-User | Hospitals | |
| Ambulatory Surgical Centers | ||
| Specialty Clinics | ||
| By Geography | North America | United States |
| Canada | ||
| Mexico | ||
| Europe | Germany | |
| France | ||
| United Kingdom | ||
| Italy | ||
| Spain | ||
| Rest of Europe | ||
| Asia-Pacific | China | |
| Japan | ||
| India | ||
| South Korea | ||
| Australia | ||
| Rest of Asia-Pacific | ||
| Middle East & Africa | GCC | |
| South Africa | ||
| Rest of Middle East & Africa | ||
| South America | Brazil | |
| Argentina | ||
| Rest of South America | ||


Key Questions Answered in the Report
What is the current valuation of the visualization instruments for MIS market?
The market stands at USD 15.46 billion in 2026 and is projected to reach USD 23.07 billion by 2031, yielding an 8.33% CAGR.
Which product line leads revenue today?
Endoscopes hold the largest share at 59.25% in 2025, reflecting high-volume GI and bronchoscopy usage.
Which segment will grow the fastest?
Robotic vision modules are forecast to post a 12.52% CAGR through 2031 as compact surgical robots gain traction.
Why are ASCs critical to future growth?
ASCs are expected to expand at a 10.34% CAGR because private-equity-backed chains invest in capital-light orthopedic and GI suites that prefer disposable scopes and leased 4 K systems.
Which region shows the highest growth potential?
Asia–Pacific is slated for a 10.57% CAGR, fueled by China’s hospital-upgrade program and Japan’s aging population calling for minimally invasive approaches.
Page last updated on:


