Printed Rigid Packaging Market Size and Share
Market Overview
| Study Period | 2019 - 2030 |
|---|---|
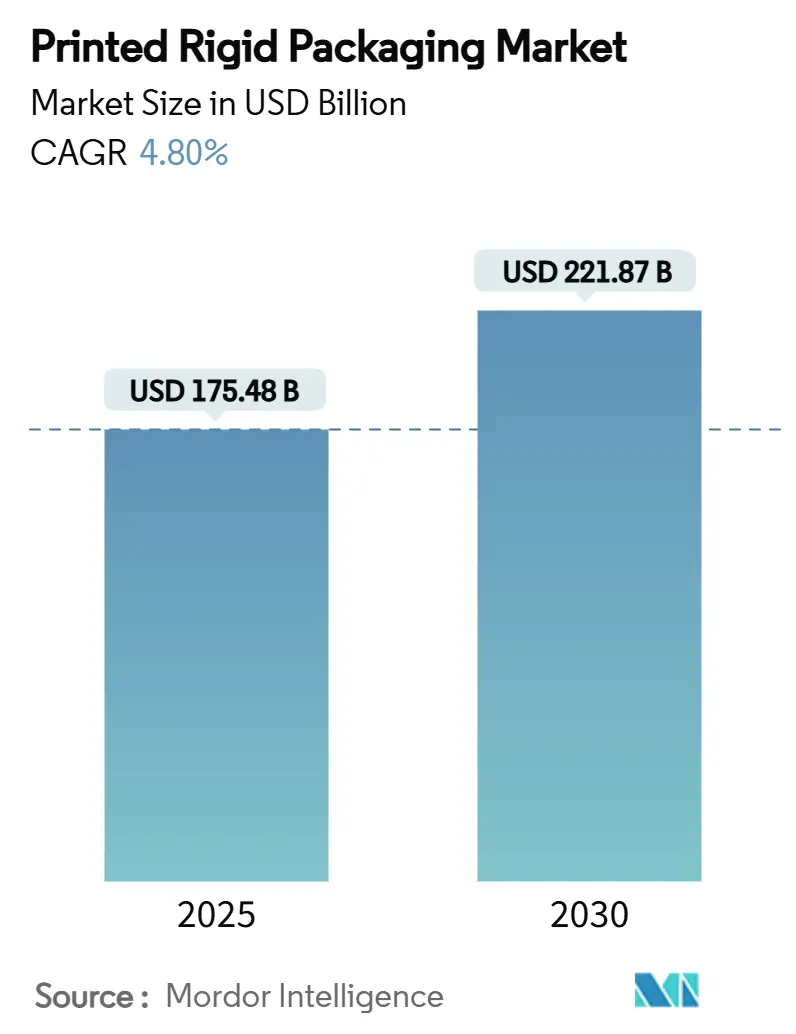
| Market Size (2025) | USD 175.48 Billion |
| Market Size (2030) | USD 221.87 Billion |
| Growth Rate (2025 - 2030) | 4.80% CAGR |
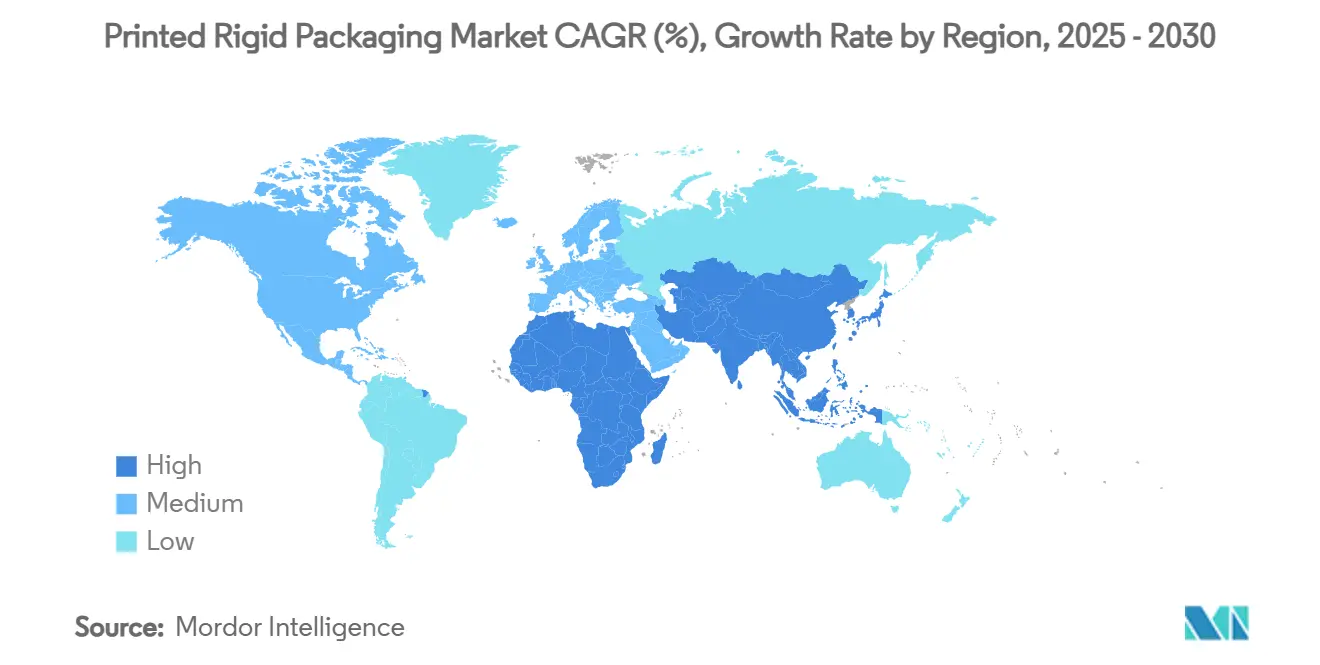
| Fastest Growing Market | Middle East and Africa |
| Largest Market | Asia Pacific |
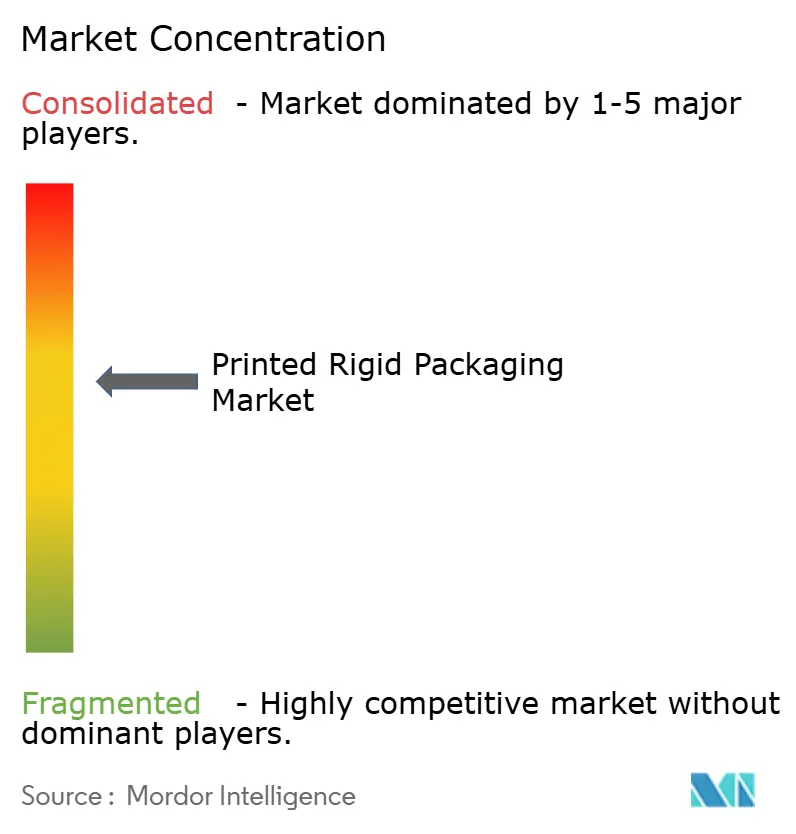
| Market Concentration | Medium |
Major Players *Disclaimer: Major Players sorted in no particular order Image © Mordor Intelligence. Reuse requires attribution under CC BY 4.0. | |
Printed Rigid Packaging Market Analysis by Mordor Intelligence
The printed rigid packaging market size stands at USD 175.48 billion in 2025 and is forecast to reach USD 221.87 billion by 2030, advancing at a 4.80% CAGR. Growth is propelled by e-commerce fulfilment pressures, digital print upgrades that cut waste, and regulations mandating recyclable formats. Robust cartons able to carry bold graphics now travel through automated distribution hubs without damage, while Europe’s new circular-economy rules force migration toward fibre-based solutions. Asia-Pacific remains the largest consumption hub, yet the Middle East and Africa provides the fastest runway. Competitive intensity is rising as global majors blend mergers, sustainable substrates, and AI-driven colour control to widen operating margins and unlock new premium applications.
Key Report Takeaways
- By material, the printed rigid packaging market for the bioplastics and plant-based fibres segment is projected to grow at 6.05% CAGR between 2025-2030.
- By printing technology, flexography segment captured 35.85% share of the printed rigid packaging market in 2024.
- By packaging format, the printed rigid packaging market for the rigid boxes segment is projected to grow at 5.96% CAGR between 2025-2030.
- By end-use industry, food and beverages captured 54.69% share of the printed rigid packaging market in 2024.
- By geography, the printed rigid packaging market for the Middle East and Africa region is projected to grow at 6.26% CAGR between 2025-2030.
Global Printed Rigid Packaging Market Trends and Insights
Drivers Impact Analysis*
| Driver | (~) % Impact on CAGR Forecast | Geographic Relevance | Impact Timeline |
|---|---|---|---|
| Surge in e-commerce boosting demand for robust, high-graphic cartons | +1.5% | Global (North America and Asia-Pacific focus) | Medium term (2-4 years) |
| Brand differentiation needs for photo-realistic rigid packs | +0.8% | North America and Europe, expanding to Asia-Pacific | Short term (≤ 2 years) |
| Regulatory push toward recyclable fibre-based rigid formats | +0.6% | Europe and North America, spillover to Asia-Pacific | Long term (≥ 4 years) |
| Direct-to-shape digital print enabling micro-runs and influencer campaigns | +0.5% | Global, early adoption in North America and Europe | Medium term (2-4 years) |
| Pharma cold-chain fibre shippers expanding rapidly | +0.4% | Developed markets globally | Long term (≥ 4 years) |
| AI-driven real-time colour control slashing makeready waste | +0.3% | North America and Europe, expanding globally | Short term (≤ 2 years) |
| Source: Mordor Intelligence | |||
Surge in E-commerce Boosting Demand for Robust, High-Graphic Cartons
E-commerce distribution adds multiple handling points, pushing converters to engineer cartons with higher compression strength while preserving graphics that serve as brand billboards on doorsteps. Crown Holdings recorded a 24% uplift in beverage-can income in Q1 2025, mirroring broader packaging demand tied to on-line retail volume gains.[1]Crown Holdings, “Q1 2025 Earnings Release,” crowncork.com Smart labels and IoT tracking embedded into rigid packs now feed logistics data back to brand owners, ensuring delivery integrity across Asia-Pacific where parcel volumes surge. AI-enabled press controls help retain colour fidelity despite corrugated flute variation, reinforcing consumer trust and repeat purchases.
Brand Differentiation Needs for Photo-Realistic Rigid Packs
Variable data print lets consumer-goods firms personalise packs for regional events and influencer tie-ins without adding inventory risk. Graphic Packaging’s new insulated cold cups and refillable detergent containers employ high-resolution digital images that elevate shelf impact while cutting setup waste by up to 40%.[2] Pharma lines adopt similar techniques to meet FDA tamper-evidence mandates and to ensure legible, durable codes across cold-chain extremes.[3]U.S. Food and Drug Administration, “Container Closure Systems Guidance,” fda.gov
Regulatory Push Toward Recyclable Fibre-Based Rigid Formats
The EU Packaging and Packaging Waste Regulation obliges all packs to be recyclable by 2030, with recycled-content floors rising to 65% by 2040. International Paper’s USD 5.9 billion Q1 2025 revenue after acquiring DS Smith shows strategic repositioning to fibre-based leadership. USDA researchers are enhancing starch-coated boards to resist moisture yet compost post-use, speeding regulatory compliance.
Direct-to-Shape Digital Print Enabling Micro-Runs and Influencer Campaigns
Inkjet heads mounted on bottle carousels now deliver 360-degree imagery in a single pass, cutting time-to-market for limited-edition drops. ISO/TC 130 quality norms assure repeatability across plants, letting global brands replicate design intent worldwide. Stora Enso’s new Finnish board line adds flexible capacity for such micro-runs, underpinning its 9% Q1 2025 sales gain.
Restraints Impact Analysis*
| Restraint | (~) % Impact on CAGR Forecast | Geographic Relevance | Impact Timeline |
|---|---|---|---|
| Volatile paperboard and resin input prices | -0.7% | Global (high in North America and Europe) | Short term (≤ 2 years) |
| Stricter VOC limits on solvent inks in EU/NA | -0.4% | Europe and North America | Medium term (2-4 years) |
| Cyber-security risk in networked digital print lines | -0.3% | Digitally advanced markets globally | Long term (≥ 4 years) |
| Refill/reuse models reducing single-use rigid volumes | -0.2% | Europe and North America, expanding to Asia-Pacific | Long term (≥ 4 years) |
| Source: Mordor Intelligence | |||
Volatile Paperboard and Resin Input Prices
Fibre and resin trades face swings tied to energy costs and geopolitical frictions. Crown Holdings offsets such fluctuations by locking in tariff pass-through clauses in supply contracts. Silgan Holdings leverages efficiency programs and bolt-on deals to keep its USD 6.0 billion 2023 top line resilient. Recycled-content mandates now add premium costs for qualified fibres.
Stricter VOC Limits on Solvent Inks in EU/NA
Updated EPA aerosol-coating standards compel converters to shift toward water-based or UV-curable chemistries, pending capital outlays for new dryers and ventilation. Parallel EU rules ban PFAS in food packs by 2026, tightening formulation windows and prompting accelerated R&D into bio-based binders.
*Our forecasts treat driver/restraint impacts as directional, not additive. The impact forecasts reflect baseline growth, mix effects, and variable interactions.
Segment Analysis
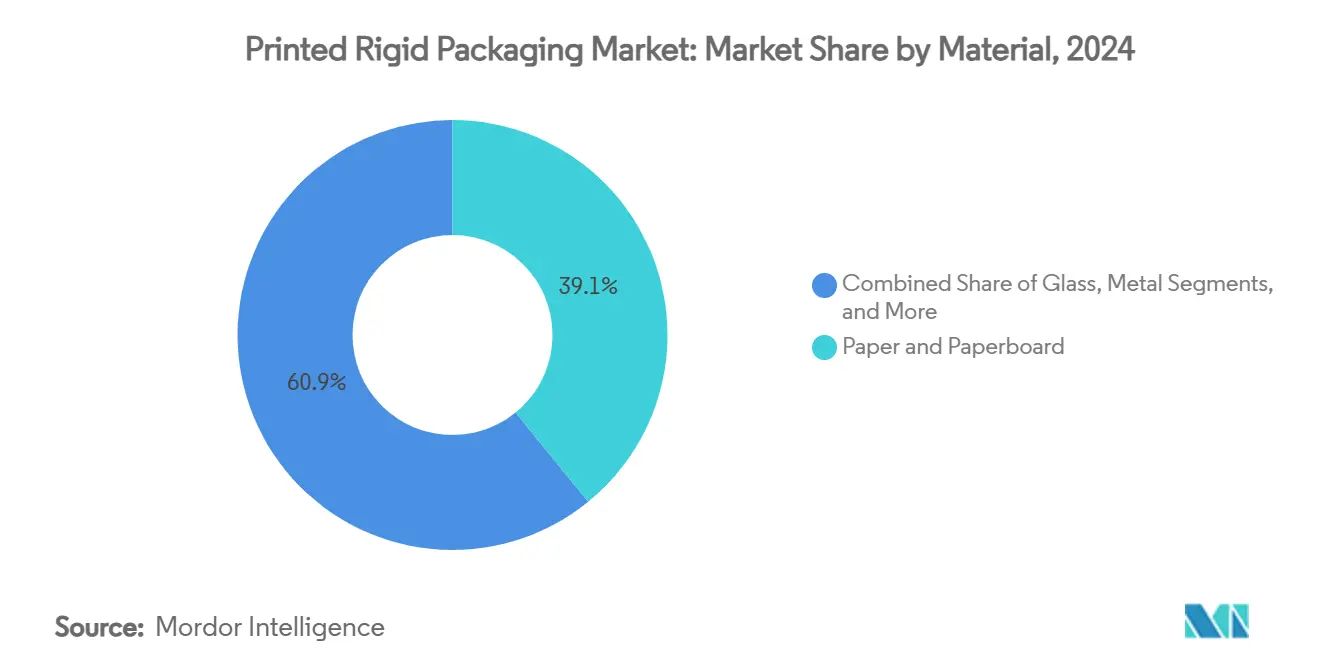
By Material: Sustainable Alternatives Gain Momentum
Paper and paperboard retained 39.13% share of the printed rigid packaging market in 2024, capitalising on established recycling loops and regulatory preference for fibre substrates. Plastics still address barrier-intensive SKUs, glass supports premium branding, and metal cans deliver unmatched closed-loop recyclability. The printed rigid packaging market size tied to bioplastics and plant-based fibres is forecast to grow at 6.05% CAGR through 2030, underpinned by USDA-backed starch coatings that combine moisture resistance with compostability. Corporates use BioPreferred labelling to flag fibre-plus-biofilm hybrids that cut petrochemical content.[4]United States Department of Agriculture Rural Development, “BioPreferred Program Report,” rd.usda.gov
Innovation in fibre chemistry continues as mills integrate lignin-rich pulps for added strength, letting converters down-gauge board calipers without sacrificing compression strength. Meanwhile, PET thermoformers test enzymatic depolymerisation to meet 30% recycled-content thresholds, narrowing the performance gap between clear plastics and coated boards. The printed rigid packaging market now sees procurement teams bundle fibre and bio-polymer volumes to hedge raw-material risk while fulfilling brand carbon pledges.


By Printing Technology: Digital Revolution Accelerates
Flexography’s 35.85% share in 2024 stems from its high-speed suitability for long runs of food and beverage cartons. Nevertheless, a 6.17% CAGR for digital presses signals a structural shift. The printed rigid packaging market size allocated to inkjet and electrophotography equipment continues to climb as AI inspection closes quality gaps with offset, encouraging adoption on mid-length runs. Variable-data capability also feeds omnichannel commerce where SKUs proliferate.
Print-service providers blend hybrid lines where flexo white layers under-pin digital CMYK to maximise opacity while preserving agility. ISO/TC 130 colour standards assure brand managers of global consistency, letting them synchronise launches across continents. Embedded analytics now benchmark press uptime and ink utilisation, reducing total cost of ownership and enabling pricing models based on square-metre output rather than impressions.
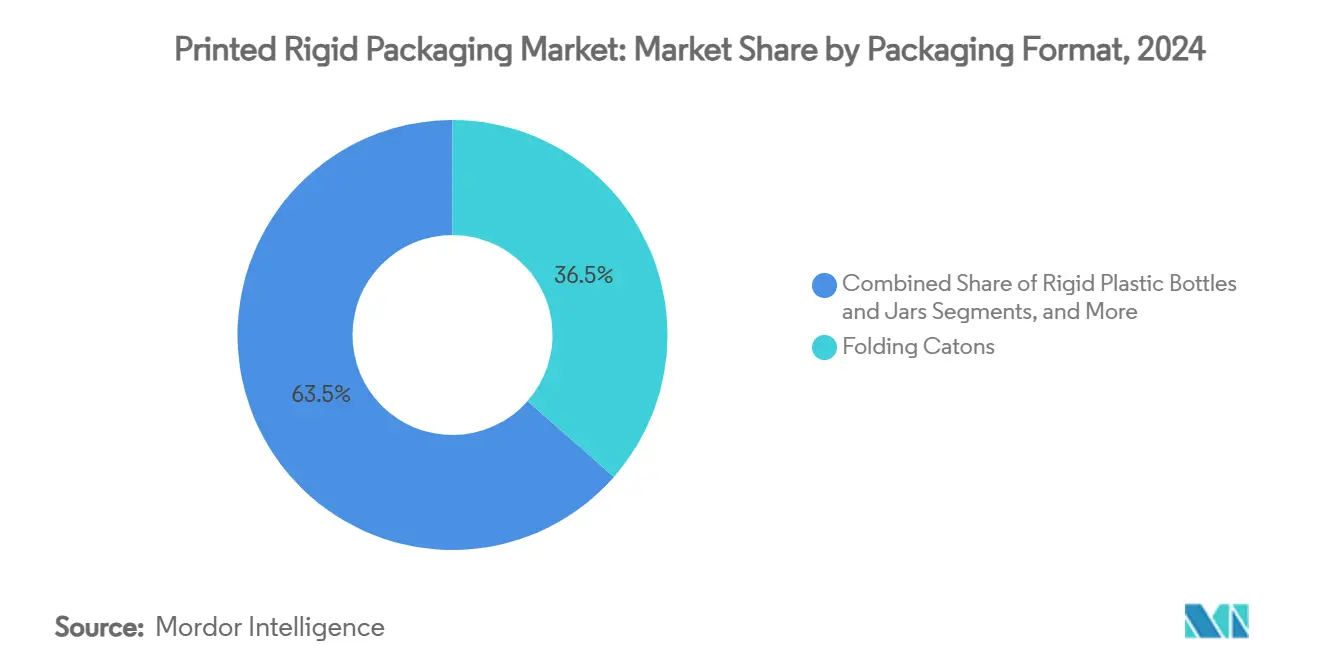
By Packaging Format: Luxury Segments Drive Innovation
Folding cartons controlled 36.48% share of the printed rigid packaging market in 2024, valued for automatic erecting and high ink acceptance. Corrugated variants with E-flute micro-profiles blur lines between shipper and shelf pack, meeting omnichannel needs. Rigid boxes enjoy a 5.96% CAGR through 2030 as cosmetics, spirits, and electronics brands tap unboxing theatre to forge emotional connections. Smart NFC tags embedded in box walls unlock interactive care guides and loyalty rewards.
Metal cans maintain strength thanks to Crown Holdings’ new lightweight aluminium alloys that cut gram weight yet extend pressure resistance in energy-drink formats. Glass jar suppliers target carbon cuts via oxy-fuel furnaces fed by bio-gas, aligning with zero-emission roadmaps. Converters of corrugated rigid containers integrate water-based inks and quick-set coatings to serve e-commerce subscription services seeking vivid exterior prints without over-packaging.
By End-Use Industry: Healthcare Drives Specialized Demand
Food and beverages contributed 54.69% of 2024 revenue, supported by population growth and convenience eating habits. Pharma packs gain share as biologic therapies requiring cold-chain integrity expand, prompting use of foil-laminated boards with printed temperature indicators. The printed rigid packaging market share attached to personal care and cosmetics is projected to rise at 5.89% CAGR as upscale skin-care lines request renewable rigid jars and photographic deco.
Electronics brands move toward moulded-pulp clamshells that cradle devices while signalling sustainability commitments, reducing reliance on thermoformed PET. Household chemical producers trial mono-material PET jars with digital-printed shrink sleeves carrying in-app recycling cues, driving consumer compliance with curbside programs. Across sectors, laser-etched serialisation meets traceability mandates and thwarts grey-market diversion.
Geography Analysis
Asia-Pacific held 48.36% of global value in 2024, fuelled by China’s vast pulp output and India’s double-digit packaging expansion. Regional governments subsidise high-speed corrugators and digital presses to lift manufacturing productivity while enforcing producer-responsibility fees that favour recyclable fibre. Japan’s upgraded Food Safety Law aligns migration-limit testing for inks, prompting converters to certify low-VOC chemistries.
The Middle East and Africa clocks the fastest 6.26% CAGR for 2025-2030. GCC supermarket chains scale private-label ranges that need standout graphics and Arabic-English bilingual print. Saudi Arabia’s USD 70 billion food-processing pipeline under Vision 2030 amplifies demand for rigid fibre and metal formats. Local converters invest in UV-LED presses to curb energy costs, pairing them with regional paper mills to shorten supply routes.
Europe and North America stay mature yet innovation-led. The EU market will rise from EUR 153 billion (USD 165 billion) in 2024 to EUR 186 billion (USD 201 billion) by 2029 as circular-economy rules stimulate redesign toward mono-material board wraps. WestRock recycles 4.7 million tons of fibre annually, feeding its carton plants and underscoring closed-loop credentials. In the United States, OEMs retrofit presses with carbon-capture units to meet state VOC caps, while Canadian brands pilot refill stations that test willingness to trade rigid single-use packs for rotating crates.

Competitive Landscape
Industry structure is moderately consolidated. WestRock, Amcor, Crown Holdings, and International Paper leverage global scale, multi-substrate portfolios, and integrated recycling to preserve margins. The July 2024 shareholder approval of Smurfit Kappa’s combination with WestRock forms a USD 21 billion revenue champion spanning containerboard mills and high-graphic converting plants across 42 countries.[5]Smurfit Kappa, “Smurfit WestRock Merger Announcement,” smurfitkappa.com Amcor’s announced merger with Berry Global seeks USD 650 million in synergies through resin purchasing power and shared R&D labs.
Technological differentiation intensifies. Crown Holdings advances its Twenty by 30 program to cut Scope 3 emissions and increase recycled aluminium, boosting brand alignment with climate goals. International Paper channels DS Smith’s display-ready expertise into North America, targeting premium shelf wins. Smaller specialists exploit digital-only plants to handle micro-runs in 72 hours, winning influencer campaigns that larger incumbents deem uneconomic. Venture-funded start-ups focus on mycelium-based rigid inserts, challenging foam and pulp incumbents.
Supply chains adapt to cyber-risk as presses link to cloud dashboards; converters partner with cyber-security firms to ring-fence Intellectual Property on unreleased product artwork. Investors monitor ESG metrics closely, penalising laggards in VOC and carbon disclosures. Overall, suppliers able to harmonise sustainability, digital responsiveness, and competitive cost positions retain pricing power.
Printed Rigid Packaging Industry Leaders
Smurfit Westrock plc
Amcor plc
Mondi Group
Huhtamaki Oyj
Crown Holdings Inc.
- *Disclaimer: Major Players sorted in no particular order

Recent Industry Developments
- April 2025: International Paper reported Q1 2025 net sales of USD 5.9 billion after acquiring DS Smith, aiming for USD 1.1 billion commercial improvements by 2027.
- April 2025: Crown Holdings posted diluted EPS of USD 1.65 and raised FY guidance on strong beverage-can sales in Brazil and Europe.
- February 2025: EU Packaging and Packaging Waste Regulation took effect, mandating recyclability by 2030 and recycled-content floors of 30% by 2030 and 65% by 2040.
- February 2025: Stora Enso recorded 9% Q1 sales growth to EUR 2,362 million and started up a consumer-board line in Oulu, Finland.


Global Printed Rigid Packaging Market Report Scope
| Paper and Paperboard |
| Plastics (PET, PP, PS, Others) |
| Glass |
| Metal |
| Others (Bioplastics / Plant-based Fibre) |
| Offset Lithography |
| Flexography |
| Gravure |
| Digital (Inkjet, Electrophotography) |
| Screen Printing |
| Folding Cartons |
| Rigid Boxes (Set-up, Luxury) |
| Rigid Plastic Bottles and Jars |
| Metal Cans |
| Corrugated Rigid Containers |
| Rigid IBCs / Drums |
| Food and Beverages |
| Pharmaceuticals and Healthcare |
| Personal Care and Cosmetics |
| Household and Industrial Chemicals |
| Electronics and Appliances |
| North America | United States | |
| Canada | ||
| Mexico | ||
| South America | Brazil | |
| Argentina | ||
| Rest of South America | ||
| Europe | Germany | |
| United Kingdom | ||
| France | ||
| Italy | ||
| Spain | ||
| Russia | ||
| Rest of Europe | ||
| Asia-Pacific | China | |
| Japan | ||
| India | ||
| South Korea | ||
| Australia | ||
| Thailand | ||
| Indonesia | ||
| Rest of Asia-Pacific | ||
| Middle East and Africa | Middle East | Saudi Arabia |
| United Arab Emirates | ||
| Turkey | ||
| Rest of Middle East | ||
| Africa | South Africa | |
| Nigeria | ||
| Egypt | ||
| Rest of Africa | ||
| By Material | Paper and Paperboard | ||
| Plastics (PET, PP, PS, Others) | |||
| Glass | |||
| Metal | |||
| Others (Bioplastics / Plant-based Fibre) | |||
| By Printing Technology | Offset Lithography | ||
| Flexography | |||
| Gravure | |||
| Digital (Inkjet, Electrophotography) | |||
| Screen Printing | |||
| By Packaging Format | Folding Cartons | ||
| Rigid Boxes (Set-up, Luxury) | |||
| Rigid Plastic Bottles and Jars | |||
| Metal Cans | |||
| Corrugated Rigid Containers | |||
| Rigid IBCs / Drums | |||
| By End-Use Industry | Food and Beverages | ||
| Pharmaceuticals and Healthcare | |||
| Personal Care and Cosmetics | |||
| Household and Industrial Chemicals | |||
| Electronics and Appliances | |||
| By Geography | North America | United States | |
| Canada | |||
| Mexico | |||
| South America | Brazil | ||
| Argentina | |||
| Rest of South America | |||
| Europe | Germany | ||
| United Kingdom | |||
| France | |||
| Italy | |||
| Spain | |||
| Russia | |||
| Rest of Europe | |||
| Asia-Pacific | China | ||
| Japan | |||
| India | |||
| South Korea | |||
| Australia | |||
| Thailand | |||
| Indonesia | |||
| Rest of Asia-Pacific | |||
| Middle East and Africa | Middle East | Saudi Arabia | |
| United Arab Emirates | |||
| Turkey | |||
| Rest of Middle East | |||
| Africa | South Africa | ||
| Nigeria | |||
| Egypt | |||
| Rest of Africa | |||


Key Questions Answered in the Report
What is the current size of the printed rigid packaging market?
The printed rigid packaging market size is USD 175.48 billion in 2025.
Which region leads the printed rigid packaging market?
Asia-Pacific holds the largest share at 48.36% of global value in 2024.
Which printing technology is growing fastest?
Digital printing posts the highest growth, advancing at a 6.17% CAGR between 2025-2030.
How do EU regulations affect printed rigid packaging?
The EU Packaging and Packaging Waste Regulation requires all packs to be recyclable by 2030 and enforces rising recycled-content quotas, accelerating the shift toward fibre-based rigid formats.
Which end-use segment is expanding most rapidly?
Personal care and cosmetics is the fastest-growing end-use, projected at a 5.89% CAGR through 2030.
Page last updated on:


