
Metal Print Packaging Market Size and Share
Market Overview
| Study Period | 2020 - 2031 |
|---|---|
| Market Size (2026) | USD 124.70 Billion |
| Market Size (2031) | USD 160.33 Billion |
| Growth Rate (2026 - 2031) | 5.15 % |
| Fastest Growing Market | Asia Pacific |
| Largest Market | North America |
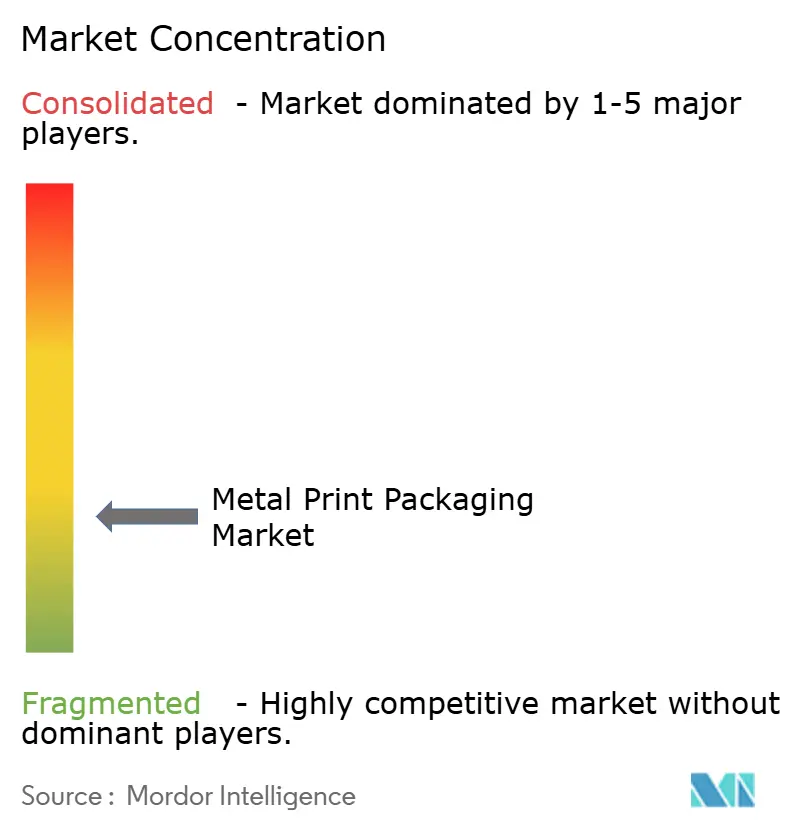
| Market Concentration | Low |
Major Players *Disclaimer: Major Players sorted in no particular order Image © Mordor Intelligence. Reuse requires attribution under CC BY 4.0. | |
Metal Print Packaging Market Analysis by Mordor Intelligence
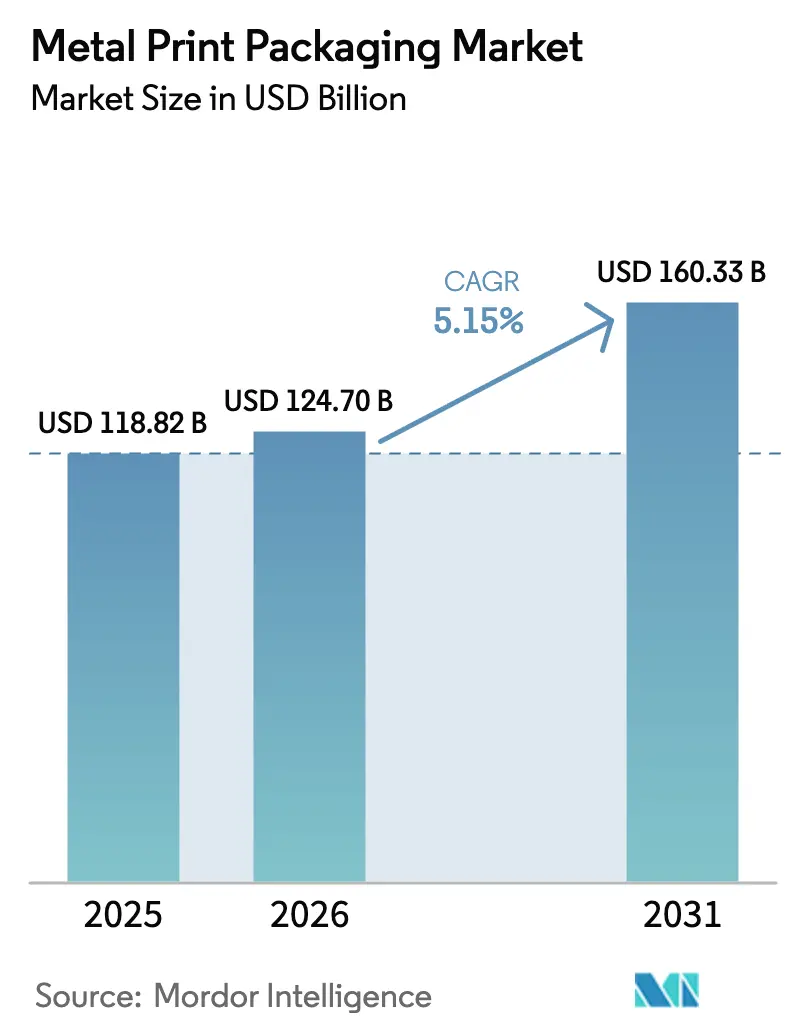
The metal print packaging market size was valued at USD 118.82 billion in 2025 and is estimated to grow from USD 124.70 billion in 2026 to reach USD 160.33 billion by 2031, at a CAGR of 5.15% during the forecast period (2026-2031). Demand is rising as direct-to-can digital presses remove minimum-order barriers for craft beverage producers, while the European Union Carbon Border Adjustment Mechanism (CBAM) rewards low-carbon local production. Beverage brands are also adopting AI-enabled inline vision systems that cut defect waste below 0.5% at speeds above 2,000 cans per minute, improving line economics. Rapid adoption of infinitely recyclable aluminium, coupled with lightweighting programs that trim average can weight to 12.8 g, positions the substrate as the market’s value growth engine. Competitive strategies now focus on vertically integrating recycled-aluminium supply and deploying digital print capacity close to demand hubs to serve sub-10,000-unit runs profitably.
Key Report Takeaways
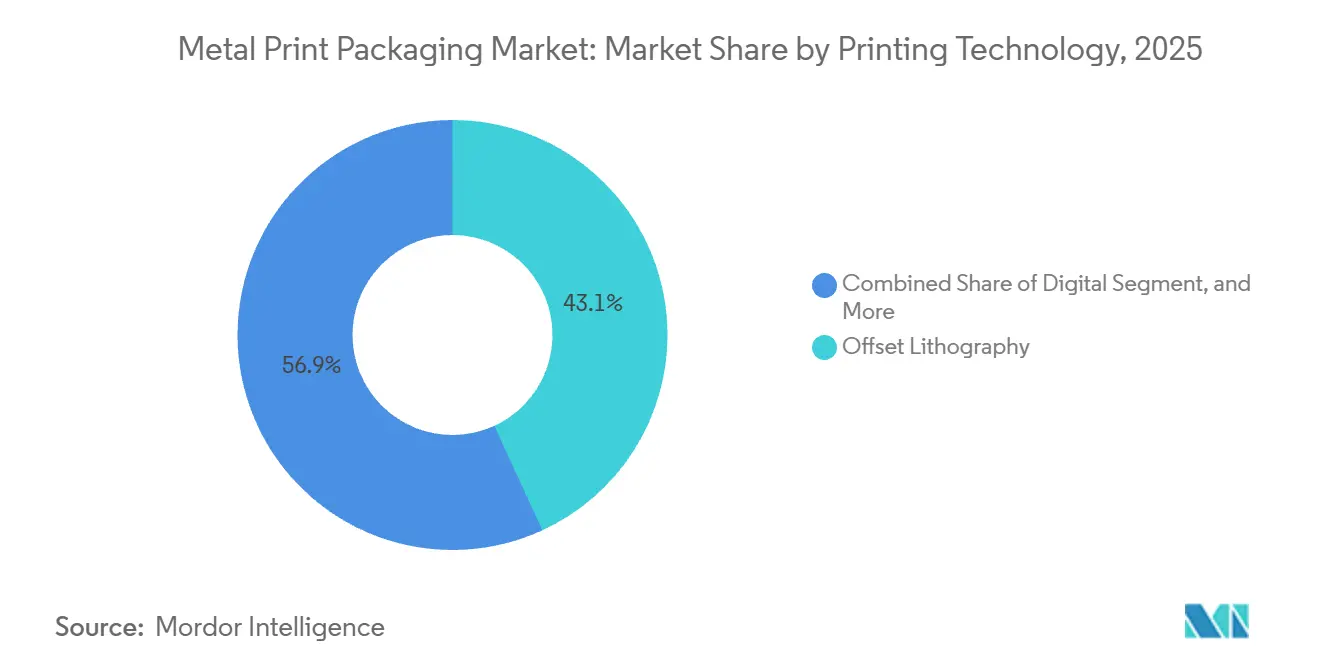
- By printing technology, offset lithography led with 43.14% of market share in 2025, while digital printing is set to advance at a 6.12% CAGR through 2031.
- By substrate material, aluminium accounted for 45.32% of the metal print packaging market share in 2025 and is forecast to expand at a 6.38% CAGR to 2031.
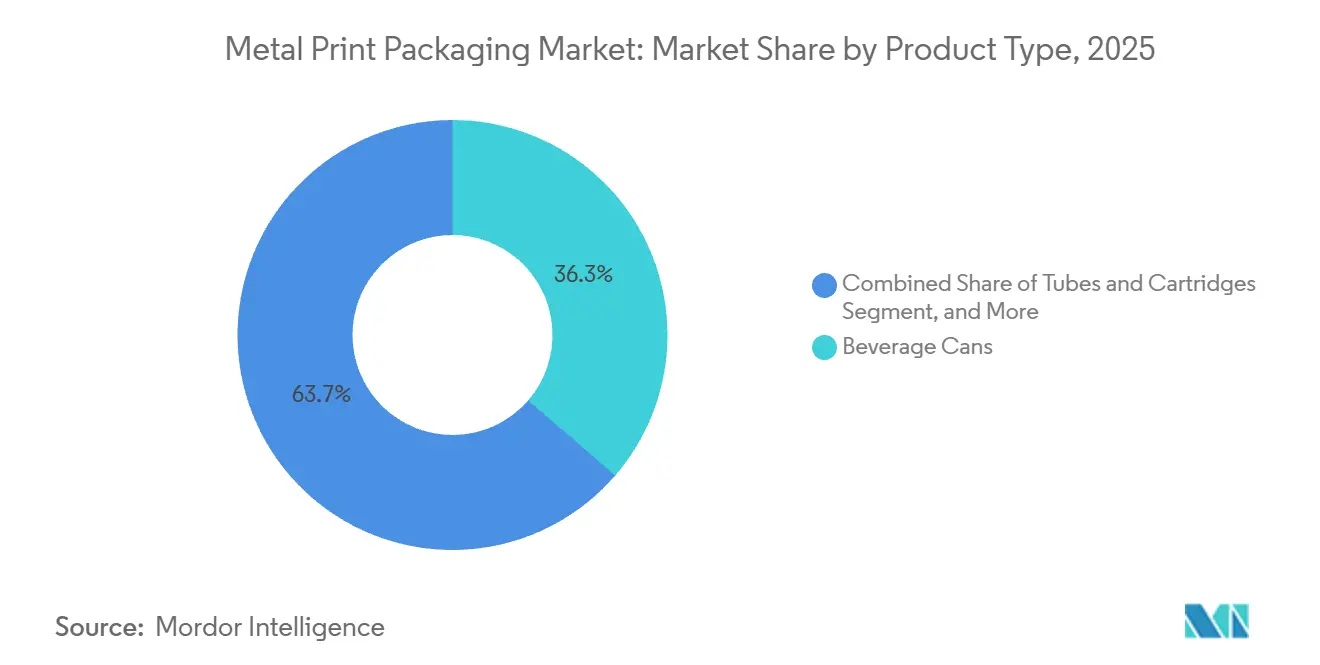
- By product type, beverage cans comprised 36.34% of market share in 2025, whereas tubes and cartridges are projected to post the fastest 6.46% CAGR to 2031.
- By end-use application, food and beverage held 40.42% market share in 2025, yet personal care and cosmetics will accelerate at a 7.19% CAGR through 2031.
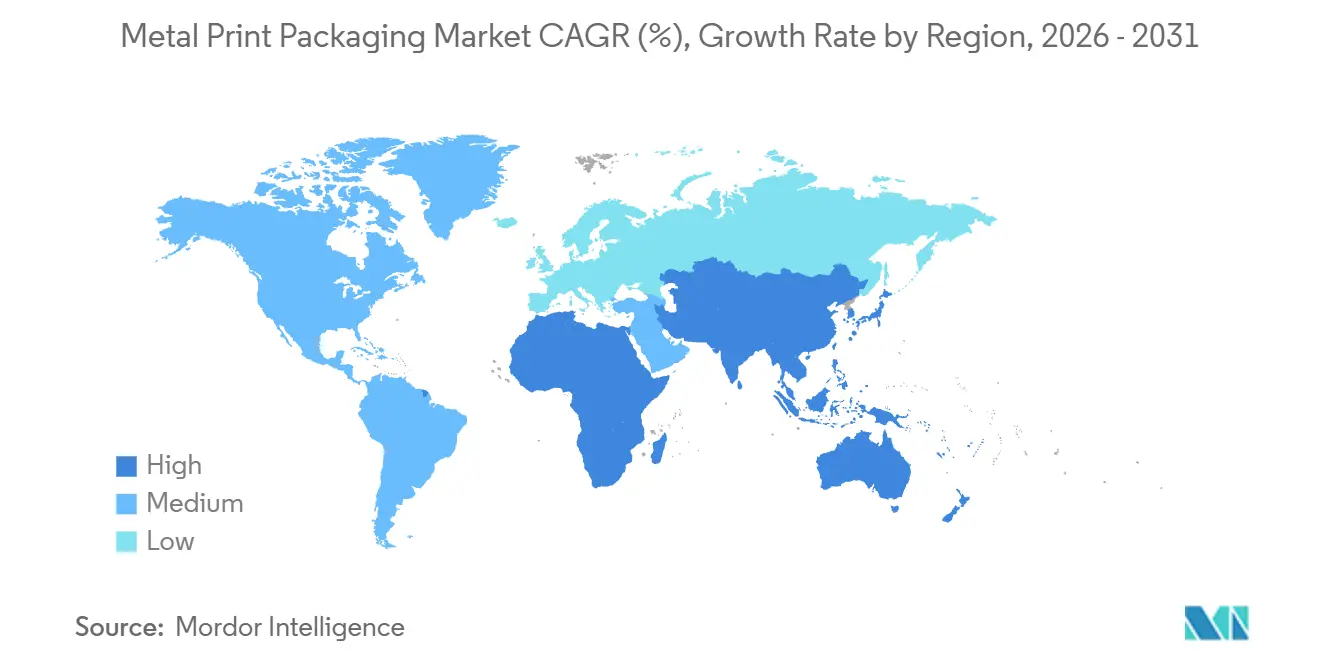
- By geography, North America generated 39.31% of market share in 2025, but Asia-Pacific is positioned for the highest 7.08% CAGR between 2026-2031.
Note: Market size and forecast figures in this report are generated using Mordor Intelligence’s proprietary estimation framework, updated with the latest available data and insights as of January 2026.
Market Trends and Insights
Drivers Impact Analysis of Metal Print Packaging Market*
| Driver | (~) % Impact on CAGR Forecast | Geographic Relevance | Impact Timeline |
|---|---|---|---|
| Rapid Evolution of Digital Print Technology | +0.8% | Global, with early adoption in North America and Europe | Medium term (2-4 years) |
| Growth in Canned Beverage Consumption (Beer, Energy Drinks) | +1.2% | Global, strongest in Asia-Pacific and North America | Short term (≤ 2 years) |
| Sustainability-Driven Demand for Infinitely Recyclable Metal | +1.0% | Europe and North America, expanding to Asia-Pacific | Long term (≥ 4 years) |
| Direct-to-Can High-Resolution Inkjet Unlocking SKU Proliferation | +0.7% | North America and Europe, craft beverage segment | Medium term (2-4 years) |
| AI-Driven Inline Vision Systems Cutting Defect Waste | +0.5% | Global, led by Europe and Asia-Pacific manufacturing hubs | Medium term (2-4 years) |
| EU CBAM Favouring Low-Carbon Domestic Can Production | +0.6% | Europe, with spillover to Middle East and Africa | Long term (≥ 4 years) |
| Source: Mordor Intelligence | |||


Rapid Evolution of Digital Print Technology
Digital presses eliminate the USD 8,000-12,000 plate cost that long made offset uneconomic for small jobs, enabling converters to profit on 2,500-unit lots. Koenig and Bauer’s 600-dpi MetJET ONE delivers production-line color accuracy with inline spectrophotometry, pairing agility with premium graphics.[1]Koenig and Bauer, “MetJET ONE Direct-to-Can System,” koenig-bauer.com Craft brewers now launch twelve seasonal SKUs per year instead of four, compressing design-to-shelf cycles to 48 hours and boosting portfolio freshness. European service NOMOQ prices runs of 204 cans at USD 0.267 each, undercutting shrink sleeves and extending experimentation budgets. Crown Holdings leverages Velox inkjet lines across six sites, positioning the metal print packaging market for deeper penetration of digital economics in personal-care and RTD coffee channels.
Growth in Canned Beverage Consumption
Energy drinks in the United States expanded 8.2% by volume in 2024, aided by slim 16-oz cans commanding USD 0.15 higher retail margins than standard formats. India’s per-capita aluminium-can use reached six units in 2025 and is projected to double by 2031 as tier-2 cities gain cold-chain access. China produced 42 billion beverage cans in 2024, with baijiu-cocktail RTDs and imported-beer premiumization driving 9% output growth.[2]MIIT China, “Domestic Can Production,” miit.gov.cn Brazil’s Ambev will source 100% domestic aluminium cans by 2027, adding 2 billion units of local demand and spurring South America capacity investments .[3]Ambev, “Domestic Aluminium-Can Sourcing Commitment,” ambev.com.br These dynamics diversify the metal print packaging market beyond saturated North American volumes and reinforce medium-term expansion.
Sustainability-Driven Demand for Infinitely Recyclable Metal
The EU achieved a 23.4% circular material-use rate for aluminium in 2023, yet scrap deficits still approach 1.2 million t annually. Novelis’ USD 2.5 billion Bay Minette mill delivers 600,000 t of 90% recycled can-stock per year, tightening the scrap loop. Germany’s deposit-return scheme collects 98.5% of beverage cans, assuring high-purity alloy 3104 feed to converters. Ball’s Real Alloy integration secures recycled supply and lets European brand owners avoid CBAM penalties. Combined, these actions elevate aluminium’s role and keep the metal print packaging market aligned with corporate Scope 3 emission targets.
Direct-to-Can High-Resolution Inkjet Unlocking SKU Proliferation
Onpack Australia saves 1.1 t of shrink-sleeve film per million digitally printed cans, helping retailers meet plastic-reduction pledges. Nevertheless, ALNA Packaging notes humidity-driven dot-gain and gloss loss, mandating inline color correction to preserve brand standards. Print Design Academy finds 12% lower gloss and 8% weaker scratch resistance than offset, acceptable for limited editions but not for core SKUs. DigiCan’s 260 million-can annual capacity sits at 65% utilization, reflecting mixed customer confidence. Crown addresses finish gaps by layering digital base coats under offset overprints, blending flexibility with high-impact metallic visuals.
Restraints Impact Analysis of Metal Print Packaging Market*
| Restraint | (~) % Impact on CAGR Forecast | Geographic Relevance | Impact Timeline |
|---|---|---|---|
| Volatility in Metal and Ink Input Prices | -0.9% | Global, acute in regions dependent on imported aluminium | Short term (≤ 2 years) |
| Competition from Alternative Packaging Substrates | -0.6% | Global, strongest in Asia-Pacific flexible-packaging markets | Medium term (2-4 years) |
| Emerging PFAS Bans Disrupting Fluoropolymer Can Coatings | -0.7% | North America and Europe, regulatory spillover to Asia-Pacific | Medium term (2-4 years) |
| Scarcity of High-Purity Recycled Aluminium Feedstock | -0.5% | Global, most acute in Europe and North America | Long term (≥ 4 years) |
| Source: Mordor Intelligence | |||
Volatility in Metal and Ink Input Prices
Aluminium three-month futures ranged from USD 2,340-2,760 /t in 2025, stressing converters locked into fixed-price supply contracts. Titanium dioxide hit USD 3,850 /t after Chinese plant shutdowns, forcing formulators to use heavier-coat, lower-opacity grades. A 10% Congolese cobalt export levy lifted UV-ink drier costs by USD 0.008 per can in Europe. Regional converters without hedging saw margin erosion exceeding 150 basis points, curbing capital spending. Integrated producers mitigate exposure via tolling deals, yet smaller firms in South America and Southeast Asia remain vulnerable, tempering metal print packaging market investment.
Emerging PFAS Bans Disrupting Fluoropolymer Can Coatings
U.S. FDA rules terminate PFAS in food-contact paper by 2026, and ECHA proposes extending restrictions to metal substrates by 2027. Sherwin-Williams’ fluoropolymer-free epoxy-phenolic formulas add USD 0.02-0.04 per can and cut throughput 5-8% during cure cycles. Food-safety tests reveal 10% higher oxygen ingress versus legacy coatings, shortening shelf life for nitrogenated coffee and fruit juice. Aerosol formats using propane-butane propellants face even stricter chemical-resistance hurdles, lengthening validation times. Staggered global timelines create compliance complexity that diverts engineering resources and slows new-line installations within the metal print packaging market.
*Our forecasts treat driver/restraint impacts as directional, not additive. The impact forecasts reflect baseline growth, mix effects, and variable interactions.
Metal Print Packaging Market Segment Analysis
By Printing Technology:
Offset Dominance Meets Digital DisruptionOffset lithography contributed 43.14% of market share in 2025, capitalizing on mature presses that drop per-can costs under USD 0.05 once runs exceed 500,000 units. Digital systems, advancing at 6.12% CAGR, thrive on short-run agility, helping the metal print packaging market serve craft brewers, boutique skincare lines, and seasonal energy drinks. Gravure and flexography continue in luxury spirits and aerosols, yet VOC regulations and cylinder-engraving fees erode their competitiveness. Pad printing and hot stamping occupy ultra-premium niches, representing less than 3% of market revenue but commanding high margins through embossed metallic effects. AI-enabled registration control on new offset lines keeps waste low, stretching the installed base’s relevance while digital press count rises.
Velox-equipped Crown facilities now satisfy 18,000 new U.S. craft-beer SKUs launched during 2024, showing digital’s role as a growth lever. Koenig and Bauer’s MetalStar 3 with inline defect detection brings offset waste below 0.5%, narrowing digital’s sustainability edge. Hybrid workflows that print digital undercoats and offset top layers balance flexibility with premium gloss, accelerating technology convergence. Equipment suppliers bundle software subscriptions with hardware, moving the revenue model toward service-based uptime guarantees. Overall, printing-technology mix shifts reinforce the evolution of the metal print packaging market toward mass customisation without abandoning high-speed legacy assets.


By Substrate Material:
Aluminium Leads Value And VelocityAluminium secured 45.32% of market share in 2025 and is expanding at a 6.38% CAGR, driven by recyclability, lighter transport weight, and CBAM-linked demand for low-carbon packaging. Tinplate remains entrenched in soups, tomatoes, and pet food, where internal pressure resistance outweighs the 15% weight penalty, but its carbon footprint is 40% higher than aluminium, pressuring European food brands to seek alternatives. Tin-free steel offers USD 80-100/t savings but suffers reduced formability, limiting its adoption in necked beverage cans. Hybrid bi-metal designs have a share of less than 2% because seam integrity between dissimilar metals complicates high-speed filling. Lifecycle studies consistently show recycled-content aluminium cutting greenhouse-gas emissions by 95%, solidifying its place in the metal print packaging market’s growth story.
Baosteel Packaging’s 2025 decision to pivot tinplate lines toward aluminium beverage-can stock underscores the trend toward lighter substrates. Novelis, Ball, and Trivium collectively commissioned over 1.5 million t of new aluminium rolling and can-sheet capacity between 2024-2026, anchoring supply for ready-to-drink expansions. Lightweighting continues, with average can walls thinning from 0.097 mm in 2020 to 0.088 mm in 2025 while maintaining buckle strength through alloy optimisation. These advances allow converters to achieve the metal print packaging market size targets without proportionally increasing primary metal demand. Circularity commitments from global brands keep aluminium investment pipelines strong despite commodity-price headwinds.
By Product Type:
Beverage Cans Scale, Tubes AccelerateBeverage cans captured 36.34% of market share in 2025 as energy-drink and hard-seltzer brands value cold-chain efficiency and premium metallic appearance. Personal-care tubes and cartridges will post the fastest 6.46% CAGR through 2031, benefiting from airless aluminium designs that protect oxygen-sensitive serums and eliminate propellants. Aerosol containers hold steady as aluminium’s compatibility with hydrocarbon gases supports deodorant and household cleaner lines, though new eco-propellant blends call for updated liner chemistries. Bottles and growlers remain a niche due to glass’s dominance in on-premise channels, but metal options gain interest for outdoor events where shatter resistance matters. Industrial pails and paint cans compete on price and account for less than 5% of the metal print packaging market.
Silgan’s 2025 Amplify pump-on-tube lets viscous formulations dispense without build-up, attracting premium skincare launches. CCL Industries added 150 million aerosol units in Mexico to meet a USD 2.7 billion U.S. body-spray market that now leans 70% aluminium. Regulatory pushes for plastic-reduction in Europe and Canada accelerate tube conversions away from laminate to collapsible metal. Beverage cans see incremental lightweighting that offsets material cost, preserving their share even as unit prices climb. Together, these shifts keep product-mix evolution central to the expansion of the metal print packaging market.
By End-Use Application:
Personal Care Outpaces Food And BeverageFood and beverage accounted for 40.42% of market share in 2025 on the strength of 320 billion aluminium beverage cans consumed globally. Personal care and cosmetics will advance at a 7.19% CAGR through 2031 as luxury fragrance, hair-care, and skincare brands adopt embossed tubes and anodised aerosols to signal premium positioning. Pharmaceuticals gain from aluminium ointment tubes that resist moisture ingress and ensure dose accuracy, yet stringent FDA 21 CFR 211 validation slows substitution cycles. Industrial chemicals continue to rely on tinplate aerosols for cost efficiency, though aluminium variants make inroads where solvent compatibility and lightweight shipping offset higher unit price. Other uses, including confectionery tins and gift boxes, stay below 8% share but benefit from seasonal demand spikes that exploit digital print’s agility.
L’Oréal’s 2024 pledge to shift half of its skincare packaging to aluminium or glass by 2028 intensifies momentum. Nielsen data show millennials and Gen Z paying 23% more for sustainable packaging, translating into price elasticity that absorbs aluminium’s premium. Unilever’s Dove aluminium deodorant sticks, launched in 2025 with 85% recycled content, set a precedent for other beauty majors. Deposit-return infrastructure growth in Asia promises higher post-consumer scrap availability, lowering cost spreads versus plastic. Altogether, evolving consumer preferences guarantee that end-use mix will continue reshaping the metal print packaging market landscape.
Geography Analysis
North America Metal Print Packaging Market
North America produced 100 billion beverage cans in 2025 and retained 39.31% of market share in 2025, thanks to mature deposit-return laws in ten U.S. states and every Canadian province. Craft breweries contribute high-margin short runs that digital decorators capitalize on, and AI-enabled inspection rollouts across 12 U.S. lines lowered scrap costs by USD 4.2 million annually. Recycling infrastructure delivers 75% recovery of aluminium cans, feeding domestic remelt furnaces and reducing reliance on imported primary metal. Nevertheless, labour shortages elevate operating costs, prompting converters to automate palletisation and logistics. Incremental capacity expansions by CANPACK and Ball in New York and Georgia maintain regional supply-demand balance and reinforce North America’s contribution to the metal print packaging market.
APAC Metal Print Packaging Market
Asia-Pacific will post a 7.08% CAGR through 2031, driven by India’s projected rise to 12 cans per capita and China’s 2024 production footprint of 42 billion units. Government incentives in Guangdong and Jiangsu support state-backed can-line expansions that target RTD cocktails, energy drinks, and imported craft beers. Toyo Seikan’s 500 million-unit Guangdong joint venture offsets Japanese export declines and supplies premium offset-decorated cans to domestic breweries. Southeast Asian nations such as Vietnam and Indonesia register double-digit canned coffee growth, while Australia’s craft beer boom fuels demand for digital runs that Onpack’s Rocklea line now fulfills. Rising middle-class purchasing power and rapid cold-chain rollout ensure that Asia-Pacific remains pivotal to the long-term growth of the metal print packaging market.
EMEA Metal Print Packaging Market
Europe represents a mature yet transforming landscape where CBAM’s phased tariffs spur re-shoring of can-sheet sourcing. Germany, France, and the United Kingdom consumed 35 billion beverage cans in 2024, but new investments focus on carbon-optimized furnaces powered by wind and solar. Ardagh and Crown both committed to 50% Scope 1 and 2 cuts by 2030, aligning with corporate buyer emissions targets. Eastern Europe sees capacity growth in Poland and Romania as converters seek lower-cost labour while remaining inside the EU carbon-trade perimeter. Middle East and Africa, though currently the smallest regional contributor, accelerates with Saudi Arabia’s Vision 2030 incentives and South Africa’s 62% first-year can recovery rate, setting the stage for future aluminium-centric plant announcements that will broaden the geographic reach of the metal print packaging market.

Regulatory Landscape
Regulation is tightening across recyclability, traceability, and chemical safety, which is feeding directly into how inks, coatings, and labeling are formulated for metal print packaging. In the European Union, Regulation (EU) 2025/40 (Packaging and Packaging Waste Regulation, PPWR) replaces Directive 94/62/EC and enters full application on 12 August 2026, shifting requirements from guidance to binding obligations for economic operators. The PPWR framework raises design-for-recycling expectations for packaging placed on the EU market and reinforces operator reporting and system requirements for collection and reuse-related logistics, increasing compliance workload for converters and brand owners managing multi-country supply chains.
For food-contact applications, the United States continues to regulate new food-contact substances through the FDA Food Contact Notification (FCN) process under 21 CFR, requiring authorization before marketing new food-contact resins, additives, and coatings. During 01 March 2026 to 31 May 2026, the FDA recorded 15 new effective FCNs, reflecting ongoing reformulation and qualification activity relevant to can liners, varnishes, and printed layers used in food and beverage packaging. Alongside the market shift away from legacy fluoropolymer chemistries under emerging PFAS restrictions referenced in the market context, these frameworks elevate the need for documented safety dossiers, conformity evidence, and disciplined change control across printing and coating systems.
Value Chain Analysis
The metal print packaging value chain starts with raw materials (primary metal and recycled feedstock) moving into metal production and rolling, then into converting operations that form containers and apply decoration, before reaching filling and seaming, distribution, consumption, and recycling systems that return scrap into remelt loops. Upstream, suppliers such as Novelis influence can-sheet availability and specifications, while converters such as Ball, Crown, and Ardagh convert metal into finished packaging using high-speed forming and decorating assets. Equipment and process ecosystems, including Koenig and Bauer MetalPrint and direct-to-shape digital inkjet platform providers, support productivity and quality through capabilities such as multi-color rotary printing, UV-LED curing, and short-run digital decoration.
Key conversion inputs include specialized inks (including UV-LED systems), internal liners aligned with food-contact requirements (including BPA-free and evolving PFAS-free approaches), and process aids such as food-grade lubricants. Bottlenecks are concentrated around cupping and line throughput, as well as coating and ink adhesion performance, with tight necking and flanging tolerances needed for reliable hermetic sealing at high speeds. Downstream, brand owners and fillers are pushing for shorter lead times and higher SKU counts, reinforcing hybrid workflows (digital for short runs and offset for scale) and pulling recycled-metal traceability deeper into procurement and production planning.
Competitive Landscape
The Market is fragmented with players like Ball Corporation, Crown Holdings, Ardagh Metal Packaging and Others. Ball’s 2026 Real Alloy integration raised recycled content to 90%, allowing European customers to avoid virgin-metal EPR surcharges and pay USD 0.03-0.05 premiums for low-carbon cans. Crown partnered with Velox to field six direct-to-shape inkjet lines, targeting sub-5,000-unit craft runs priced at EUR 0.25 (USD 0.27) per can and undercutting shrink sleeves by USD 0.15. Ardagh’s decarbonization roadmap centers on renewable-powered furnaces and closed-loop water systems, with a USD 180 million Huizhou plant commissioned in 2025 delivering a 45% Scope 1 cut.
Regional challengers such as CANPACK, Envases Universales, and Toyo Seikan defend share through proximity to fillers and rapid artwork turnaround. CANPACK’s USD 200 million Nichols, New York expansion added 1.2 billion cans and integrated AI vision, trimming defect waste to 0.5% while serving Northeastern craft brewers. Envases Universales grew tinplate food-can capacity in Monterrey to tap South America's ready-meal demand, balancing its aluminium exposure. Toyo Seikan’s Guangdong venture fuses Japanese print quality with Chinese market access, capturing premium RTD beverage accounts that demand 600-line-per-inch resolution. These moves illustrate how local responsiveness tempers the global consolidation of the metal print packaging market.
Upstream and downstream partners also influence competition. Novelis’ 600,000 t Bay Minette rolling mill and Sun Chemical’s 60% lower-energy GREENLEAF UV-LED inks shift cost curves in favour of integrated players. Krones’ AI inspection subscriptions create ecosystems where converters pay for performance improvements rather than one-time capital, tying plant upgrades to vendor service contracts. Digital disruptors NOMOQ and DigiCan challenge incumbents by quoting per-can prices that enable hobby-scale runs, though utilization challenges persist. Collectively, these strategic vectors keep the competitive intensity of the metal print packaging market moderate yet dynamic, sustaining innovation across substrates, coatings, and press technology.
Metal Print Packaging Industry Leaders
Crown Holdings, Inc.
Ball Corporation
Ardagh Metal Packaging S.A.
CCL Industries Inc.
Toyo Seikan Group Holdings, Ltd.
- *Disclaimer: Major Players sorted in no particular order
Metal Print Packaging Market Companies Covered in this Report
- Ball Corporation
- Crown Holdings Inc.
- Ardagh Metal Packaging S.A.
- CANPACK S.A.
- Silgan Holdings Inc.
- Toyo Seikan Group Holdings Ltd.
- CCL Industries Inc.
- Envases Universales de México S.A. de C.V.
- Trivium Packaging B.V.
- Showa Aluminum Can Corporation
- Orora Packaging Australia Pty Ltd
- CPMC Holdings Limited
- Massilly Holding SAS
- Nampak Limited
- Can-Pack India Private Limited
- Independent Can Company
- Envases CMF S.A.
- Jiangsu Baosteel Metal Products Co., Ltd.
- Guangzhou Pacific Tinplate Co., Ltd.
- Shanghai Baosteel Packaging Co., Ltd.

Market Opportunities and Future Outlook
Compliance-led reformulation and decarbonization programs are creating room for differentiated ink and coating options, along with low-carbon metal solutions, while aiming to preserve line speed and shelf performance. In March 2026, Hubergroup launched a global rollout of its PFAS-free Tinkredible MGA metal decoration ink system for monobloc and three-piece cans, which points to near-term substitution activity as converters and brands align decoration chemistries with emerging restriction pathways. Also in March 2026, Henkel transitioned European tinplate can packaging for adhesive solutions to bluemint steel in collaboration with thyssenkrupp Rasselstein and Pirlo, reporting a 62% CO2 reduction, illustrating how lower-carbon steel and aluminum value propositions can be supported through procurement-driven packaging changes.
Capacity and footprint moves in high-growth geographies, combined with wider digital decoration adoption, broaden addressable demand for equipment, prepress, and localized service models. In April 2026, Crown Holdings announced plans for a two-line beverage can facility in Northern India with 2.2 billion cans per year of capacity, reinforcing investment momentum around Asia demand hubs and creating follow-on needs for local decorating capability, coating qualification, and recycled-content supply alignment. Parallel investments such as CCL Container’s announced July 2026 expansion in Pennsylvania, adding a new line and doubling capacity, also indicate that converters continue allocating capital to scale. At the same time, shifting technology roadmaps, including LED-UV drying and hydrogen-ready thermal oven burners cited in industry discussions, are shaping upgrade pathways for plants balancing throughput, energy use, and evolving regulatory requirements.
Recent Industry Developments in Metal Print Packaging Market
- April 2026: Crown Holdings, Inc. announced plans to establish a two-line, state-of-the-art beverage can manufacturing facility in Northern India with 2.2 billion cans per year of capacity, with operations slated for the second half of 2027. The move expands Crown's manufacturing footprint into a high-growth demand center and strengthens its ability to serve regional beverage brands with shorter lead times and local supply. It also increases the pull-through for modern decorating and inspection capabilities aligned with premium graphics and sustainability claims.
- February 2026: Ball Corporation completed the acquisition of an 80% stake in European beverage can manufacturer Benepack, adding two production facilities in Belgium and Hungary. The transaction expands Ball's European operating base and consolidates capacity closer to large beverage filling hubs that rely on high-volume printed can supply. With more in-region production, Ball can better integrate recycled-content sourcing and decoration capabilities across its European network.
- May 2025: Crown Holdings, Inc. announced the addition of a third high-speed production line to its beverage can plant in Ponta Grossa, Brazil, with commercial production targeted for the third quarter of 2026. Adding a line at an existing site increases incremental output without the time and permitting burden of a greenfield build, supporting faster response to beverage can demand swings. The project also creates a platform to deploy newer printing, coating, and quality-control upgrades across Latin American operations.


Metal Print Packaging Market Report Scope and Research Methodology
Market Definition and Coverage
For this study, the market covers printed metal packaging used to contain and present products, where printing is applied directly on metal substrates such as aluminum and steel based formats for branding, compliance, and decoration.
Scope exclusions: We exclude non-metal printed packaging (paper, plastics, and glass) and decorative metal printing used for signage or non-packaging uses.
Segments Covered in This Report
- By Printing Technology
- Offset Lithography
- Gravure
- Flexography
- Digital
- Other Printing Technologies
- By Substrate Material
- Aluminium
- Steel (Tinplate)
- Tin-free Steel
- Other Substrate Materials
- By Product Type
- Beverage Cans
- Aerosol Containers
- Bottles and Growlers
- Tubes and Cartridges
- Other Product Types
- By End-Use Application
- Food and Beverage
- Personal Care and Cosmetics
- Pharmaceuticals and Healthcare
- Industrial and Household Chemicals
- Other End-use Applications
- By Geography
- North America
- United States
- Canada
- Mexico
- South America
- Brazil
- Argentina
- Chile
- Rest of South America
- Europe
- Germany
- United Kingdom
- France
- Italy
- Spain
- Rest of Europe
- Asia-Pacific
- China
- Japan
- India
- South Korea
- Australia
- Rest of Asia-Pacific
- Middle East and Africa
- Middle East
- Saudi Arabia
- United Arab Emirates
- Turkey
- Rest of Middle East
- Africa
- South Africa
- Nigeria
- Kenya
- Rest of Africa
- Middle East
- North America
Data Sources, Market Sizing, and Validation
Desk Research
Desk work started with mapping the demand pool for printed metal packs by linking packaging output to end-use consumption and pack format trends. Public sources were used to ground the model, including UN Comtrade trade data for metal containers, US Census Bureau manufacturing statistics, Eurostat structural business statistics, and FAO food processing indicators, plus industry recycling facts from Aluminum Association and Can Manufacturers Institute.
We then reviewed company annual reports, investor presentations, sustainability reports, and reputable trade-press articles to understand capacity additions, technology shifts (for example, digital direct-to-can lines), and price movement for aluminum and steel. Where required, we also cross-checked select company financials and shipment-level import-export records to validate major flows and timing. The sources listed here are illustrative and not exhaustive, since other references were used to collect data, clarify assumptions, and validate outcomes.
Primary Interviews and Surveys
Primary work focused on confirming what is actually sold and paid for across printed metal packaging, including printing method choices, typical order mixes, and how customers switch between can sizes and other formats. Interviews covered packaging suppliers, converters, printing equipment ecosystem participants, and large end users, with coverage across APAC, EMEA, and the Americas to reflect regional differences in beverage can demand and industrial pack usage.
Distribution of primary research fieldwork respondents
| Company type | Respondent position | Region |
|---|---|---|
| Top tier: 39% | CXOs: 18% | APAC: 51% |
| Mid tier: 41% | Functional/Unit leaders: 39% | EMEA: 30% |
| Smaller Players: 20% | Managers: 43% | Americas: 19% |
Market-Sizing & Forecasting
Sizing began with a top-down build that reconstructs printed metal packaging value from pack output indicators by major end uses, then applies mix shares for printed metal formats and typical pricing ranges by substrate and print process. To keep totals realistic, we corroborated them with selective bottom-up checks such as sample supplier roll-ups, channel discussions on run rates, and sampled ASP multiplied by estimated volumes for common formats.
Model inputs include beverage can consumption trends, aluminum and steel packaging material price direction, observed adoption of digital direct-to-can printing versus traditional lithography, lightweighting effects on metal used per unit, and changes in brand compliance needs that increase or reduce print complexity. Forecasts were produced using scenario analysis, where the base case is guided by end-use growth and capacity utilization expectations gathered from interviews, then stress-tested for material price swings and demand softness in discretionary categories. When a bottom-up datapoint was missing for a country or format, we used proxy ratios from similar markets and re-checked the implied per-capita pack demand with experts.
Data Validation & Update Cycle
Outputs were reviewed through multiple checks so totals stayed consistent with real-world signals. We compared implied market values against independent indicators like metal packaging shipment direction, trade movement, and end-use production trends, then flagged outliers for follow-up.
Variance checks were run across regions and key formats to ensure mix shifts did not create unrealistic year-over-year jumps. If a large mismatch appeared, assumptions were revisited and, when needed, respondents were re-contacted to confirm the driver. Reports are refreshed annually, with interim updates when major events occur, and a final pre-delivery review is completed so clients receive the latest view.
Mordor Intelligence's Metal Print Packaging Market Estimate Compared With Other Published Estimates
Published market values for metal print packaging often differ because each publisher draws the line around what counts as printed packaging, and they may also use different starting years, price assumptions, and conversion timing.
The main gap comes from whether plain metal packaging is counted alongside value-added printing services. Mordor Intelligence treats the market as printed metal packaging formats only, then adjusts pricing using substrate mix and print-process adoption checks gathered during annual refreshes.
Benchmark comparison
| Source | Market Size | Gaps in Research Methodology |
|---|---|---|
| Mordor Intelligence | USD 124.70 B (2026) | |
| Trade Publisher A | USD 57.42 B (2024) | Uses an earlier base year and appears to emphasize a narrower definition closer to print-related packaging value, which can undercount total printed metal pack demand when format expansion is strong. |
| Industry Portal B | USD 57.82 B (2025) | Likely applies a different scope and pricing approach, including a tighter set of printed formats and a slower ASP progression, which can reduce the stated total versus a format-and-substrate mix model. |
The spread across estimates is mostly explained by what is included as printed metal packaging and how pricing is carried forward as the mix shifts between lithography and newer digital lines. By tying the total to clear demand signals and then checking it with supplier and buyer feedback, the final number stays easy to trace and repeat over time.


Key Questions Answered in the Report
What is the projected value of global metal print packaging by 2031?
It is forecast to reach USD 160.33 billion, reflecting a 5.15% CAGR between 2026-2031.
Which substrate is expanding fastest in metal print formats?
Aluminium leads with a 6.38% CAGR, buoyed by lightweighting, high recycled-content targets, and CBAM incentives.
How does digital direct-to-can printing benefit brand owners?
Eliminating plate costs lets converters profit from 2,500-unit runs, cutting lead times to days and supporting rapid SKU launches.
Why is Asia-Pacific considered the highest-growth region?
Rising per-capita beverage-can use in India and large-scale capacity additions in China drive a 7.08% CAGR through 2031.
What impact will PFAS bans have on can coatings?
U.S. and EU restrictions compel a switch to fluoropolymer-free epoxy-phenolic systems, adding up to USD 0.04 per can and reducing line speed by as much as 8%.
How are leading suppliers securing recycled aluminium feedstock?
Strategies include Ball’s Real Alloy vertical integration, Crown’s multi-year scrap contracts, and Novelis’ 600,000 t Bay Minette rolling mill focused on 90% recycled content.
Page last updated on:


 Your data is secure and never sold or shared.


