Printed Flexible Sensor Market Size and Share
Market Overview
| Study Period | 2020 - 2031 |
|---|---|
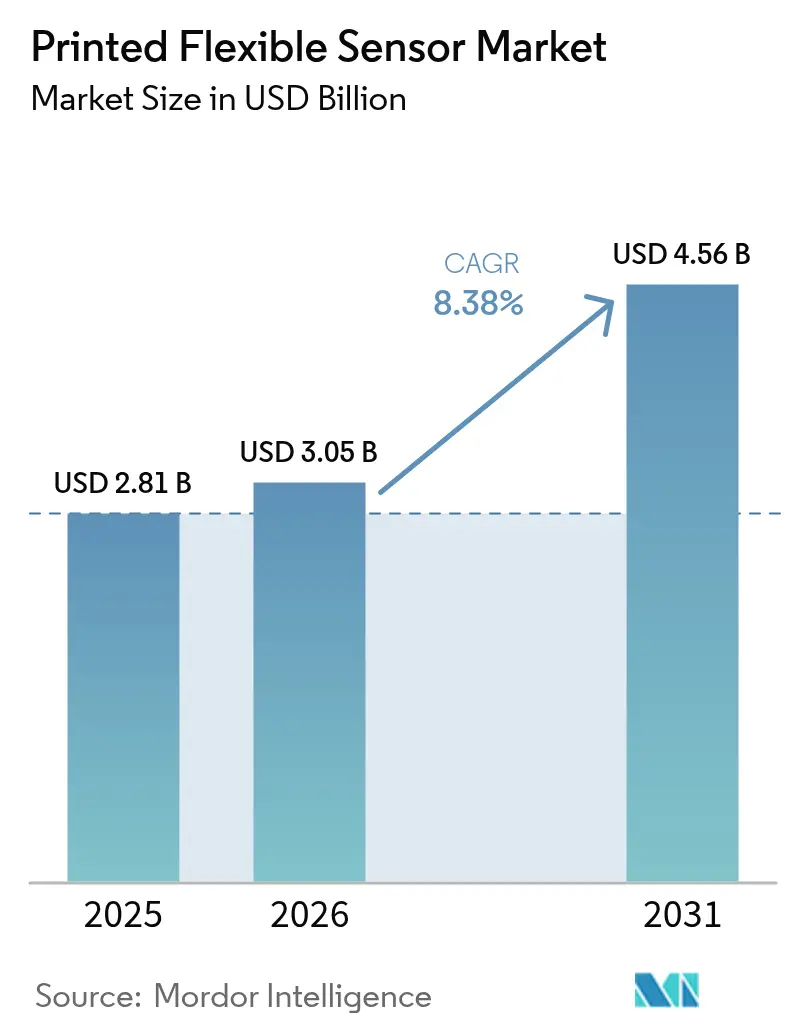
| Market Size (2026) | USD 3.05 Billion |
| Market Size (2031) | USD 4.56 Billion |
| Growth Rate (2026 - 2031) | 8.38% CAGR |
| Fastest Growing Market | Middle East |
| Largest Market | North America |
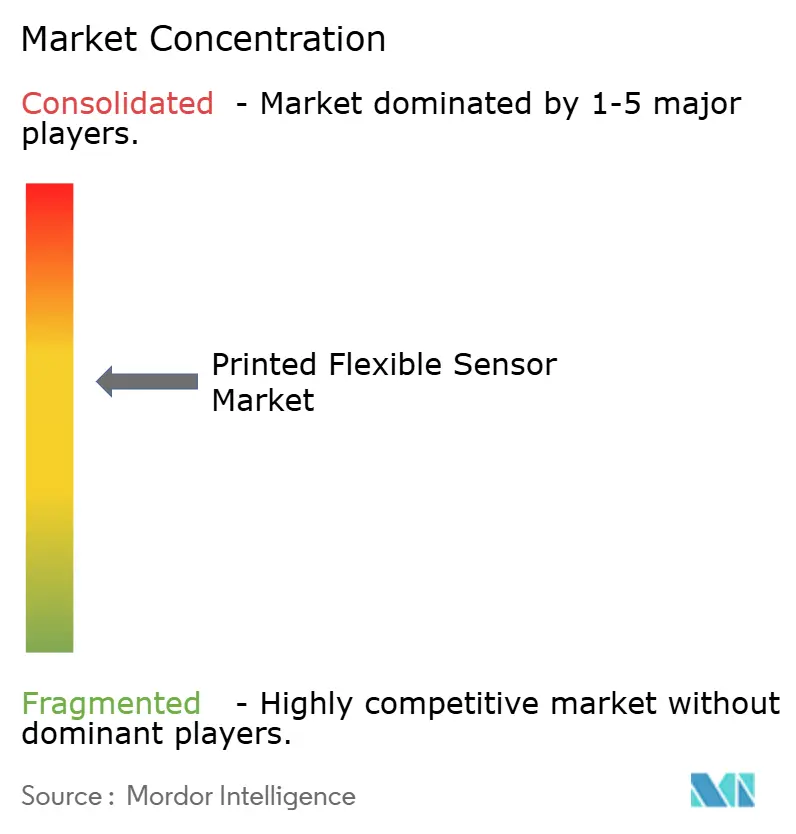
| Market Concentration | Medium |
Major Players *Disclaimer: Major Players sorted in no particular order Image © Mordor Intelligence. Reuse requires attribution under CC BY 4.0. | |
Printed Flexible Sensor Market Analysis by Mordor Intelligence
The printed flexible sensor market size is projected to expand from USD 2.81 billion in 2025 and USD 3.05 billion in 2026 to USD 4.56 billion by 2031, registering a CAGR of 8.38% between 2026 and 2031. Persistent capital-expenditure reductions delivered by roll-to-roll additive manufacturing, together with surging demand for ultra-thin, energy-efficient electronics, are steering procurement away from rigid silicon toward flexible form factors. North American defense procurement and European eco-design mandates are stimulating early, large-volume deployments, while regional manufacturing hubs in Asia-Pacific are repositioning existing touch-panel capacity toward higher-margin biosensing and automotive programs. At the same time, volatility in silver nanoparticle ink pricing and unresolved accuracy gaps versus silicon impose cost and performance ceilings that confine printed devices to use-cases where disposability, weight, or conformability yield clear system-level benefits.
Key Report Takeaways
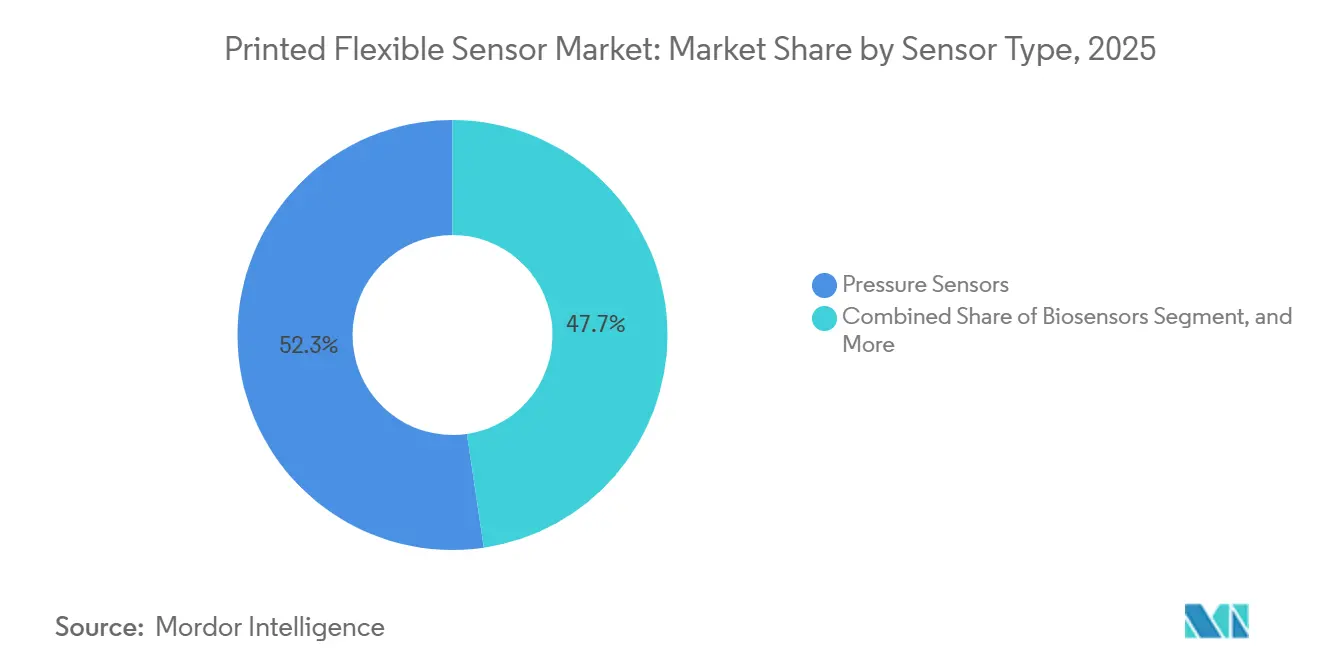
- By sensor type, pressure sensors captured 52.32% of the printed flexible sensor market share in 2025, whereas gas sensor is forecast to expand at an 8.91% CAGR through 2031.
- By printing technology, flexographic processes accounted for 37.63% of the printed flexible sensor market in 2025, while screen printing is projected to grow at a 9.12% CAGR to 2031.
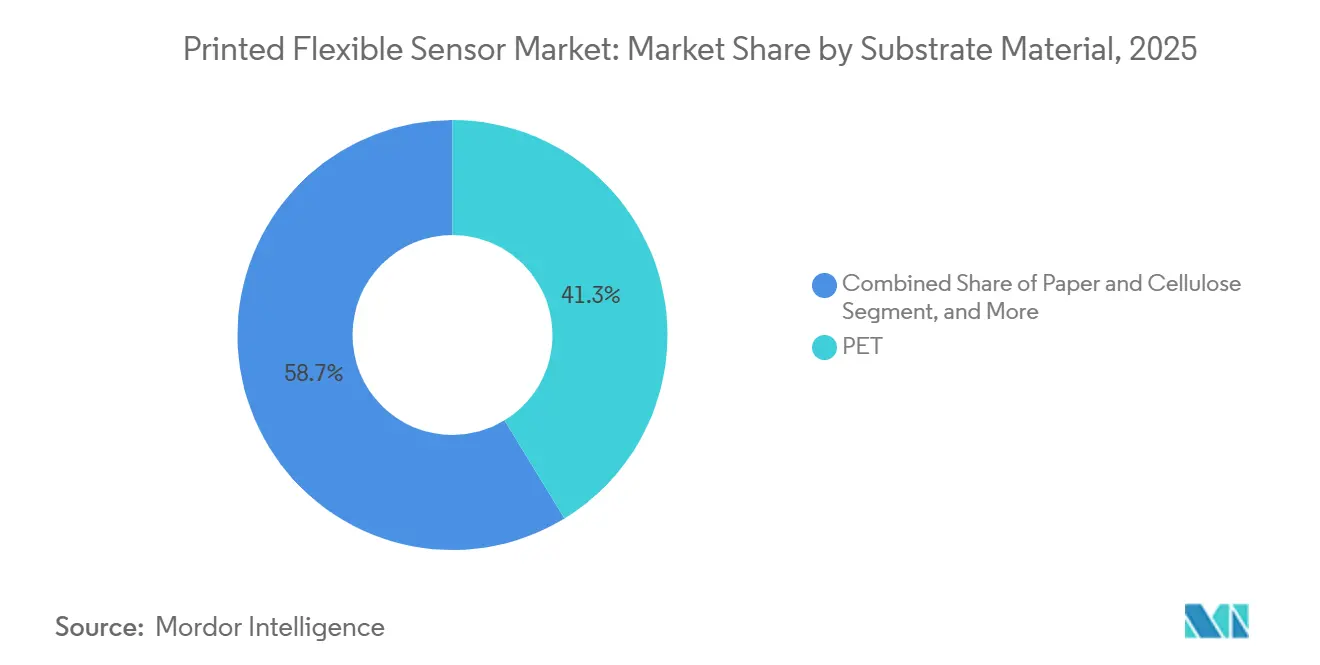
- By substrate material, polyethylene terephthalate retained 41.28% of revenue in 2025, but paper and cellulose substrate is advancing at a 9.64% CAGR through 2031.
- By end-user industry, consumer electronics led with a 33.66% revenue share in 2025, whereas the medical and healthcare application is poised to grow at a 10.06% CAGR between 2026 and 2031.
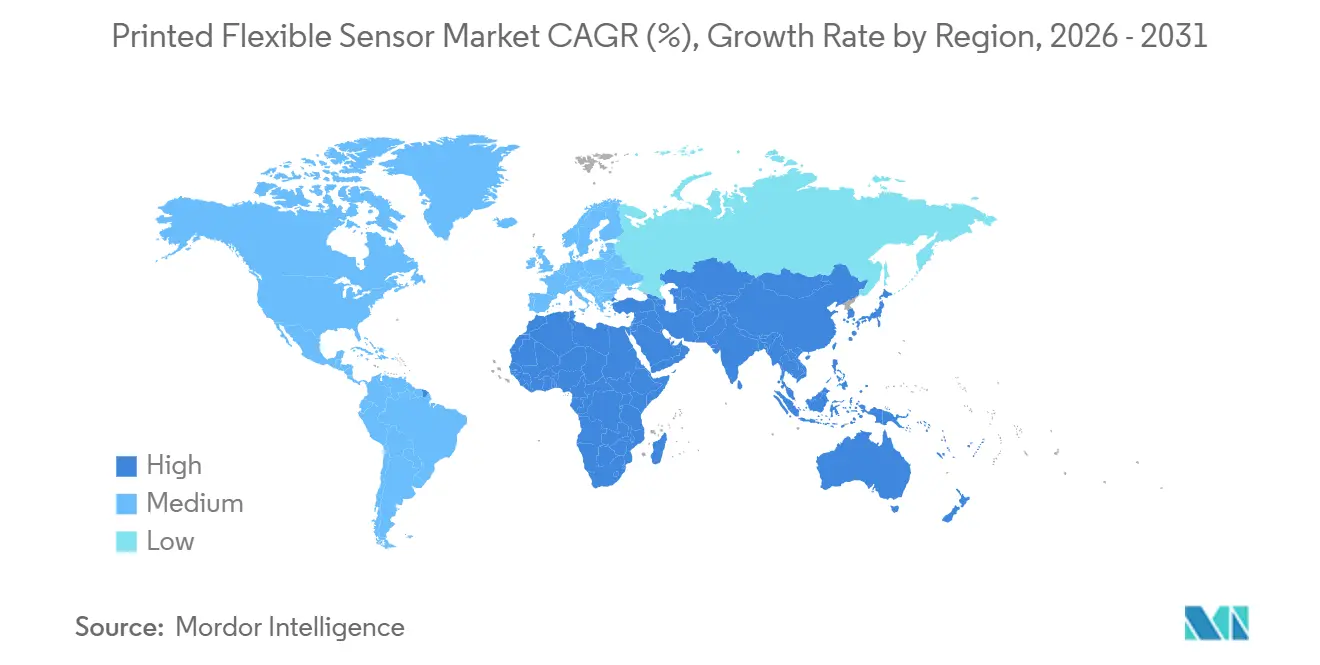
- By geography, North America accounted for 34.57% of global revenue in 2025, yet the Middle East is set to post the fastest regional growth at a 9.87% CAGR over 2026-2031.
Note: Market size and forecast figures in this report are generated using Mordor Intelligence’s proprietary estimation framework, updated with the latest available data and insights as of 2026.
Global Printed Flexible Sensor Market Trends and Insights
Drivers Impact Analysis*
| Driver | (~) % Impact on CAGR Forecast | Geographic Relevance | Impact Timeline |
|---|---|---|---|
| Roll-to-Roll Additive Manufacturing Cutting CapEx Over 40% | +2.1% | Global, with early adoption in North America and Europe | Medium term (2-4 years) |
| Rising Demand for Energy-Efficient, Ultra-Thin Consumer Electronics | +1.8% | Asia-Pacific core, spill-over to North America | Short term (≤ 2 years) |
| Increasing Adoption in Medical Wearables and Biosensing | +1.6% | North America and Europe, expanding to Middle East | Medium term (2-4 years) |
| Automotive In-Cabin HMI and Battery Monitoring Integration | +1.3% | Europe and Asia-Pacific, with North America following | Long term (≥ 4 years) |
| EU Eco-Design Policies Favouring Recyclable Printed Sensors | +0.9% | Europe primary, influencing global supply chains | Long term (≥ 4 years) |
| Defense R&D for Conformal Avionics and Structural Health Monitoring | +0.7% | North America and Europe | Long term (≥ 4 years) |
| Source: Mordor Intelligence | |||


Roll-to-Roll Additive Manufacturing Cutting CapEx Over 40%
Replacing clean-room photolithography with ambient-temperature roll-to-roll printing slashes equipment outlay to USD 8 million for a 10,000 m² line, well below the USD 14 million typically required for rigid-substrate fabs. Throughputs exceeding 1,200 m² per hour, layer-to-layer registration below 25 µm, and web handling of 12 µm-thick films deliver fast payback cycles and drive automotive, aerospace, and consumer-device makers toward flexible formats.[1]Institute of Electrical and Electronics Engineers, “Flexible Electronics Research Publications,” ieee.org
Rising Demand for Energy-Efficient, Ultra-Thin Consumer Electronics
Printed capacitive overlays only 0.3 mm thick now replace mechanical buttons in smartphones, tablets, and foldable displays, trimming bill-of-materials cost by 40% and helping device makers meet sub-0.5 W standby-power regulations in both the European Union and California.
Increasing Adoption in Medical Wearables and Biosensing
More than 250 wearable biosensor devices gained U.S. FDA clearance in 2024-2025, and Medicare’s 2025 reimbursement expansion created an 8 million-patient addressable base for single-use printed patches. Flexible electrochemical cells embedded in minimally invasive microneedles or sweat-analysis strips now correlate to laboratory assays with R² values above 0.92, validating clinical utility.[2] U.S. Food and Drug Administration, “Medical Device Approvals and Clearances,” fda.gov
Automotive In-Cabin HMI and Battery Monitoring Integration
European and Asian original equipment manufacturers integrated printed capacitive arrays into steering wheels and dashboards for 2025 model-year launches, while printed reference electrodes inside 800-V battery packs supply real-time cell health data at temperatures up to 125 °C, satisfying emerging Euro NCAP driver-monitoring and safety directives.
Restraints Impact Analysis*
| Restraint | (~) % Impact on CAGR Forecast | Geographic Relevance | Impact Timeline |
|---|---|---|---|
| Volatile Supply of Silver Nanoparticle Inks | -1.4% | Global, with acute impact in Asia-Pacific and Europe | Short term (≤ 2 years) |
| Accuracy and Stability Gap vs. Silicon Sensors | -1.1% | Global, limiting adoption in precision-critical applications | Medium term (2-4 years) |
| Limited Reliability Data for High-Temperature Use-Cases | -0.6% | North America and Europe aerospace and automotive sectors | Long term (≥ 4 years) |
| Lack of Fabrication Standardisation | -0.5% | Global, hindering cross-vendor interoperability | Long term (≥ 4 years) |
| Source: Mordor Intelligence | |||
Volatile Supply of Silver Nanoparticle Inks
Mine disruptions in Latin America lifted silver spot prices 22% in 1H 2025, compressing margins for manufacturers locked into 2024-priced contracts. Copper and graphene inks offer relief but introduce oxidation or resistivity penalties that raise encapsulation cost and restrict high-current applications.[3]London Metal Exchange, “Silver Spot Prices,” lme.com
Accuracy and Stability Gap vs. Silicon Sensors
Printed devices drift 2-5% per 1,000 h, show 0.1-0.3%/°C temperature coefficients, and exhibit 8% hysteresis after 10,000 load cycles, well above silicon norms. These variances confine printed sensors to domains where disposability, conformability, or ultralow cost outweigh absolute accuracy.
*Our forecasts treat driver/restraint impacts as directional, not additive. The impact forecasts reflect baseline growth, mix effects, and variable interactions.
Segment Analysis
By Sensor Type: Gas Sensors Lead Innovation Pace
Gas sensors are predicted to grow at an 8.91% CAGR from 2026-2031, the quickest of all categories, as plants and smart buildings adopt continuous VOC monitoring to meet 2024 regulatory thresholds. Pressure devices secured 52.32% of printed flexible sensor market share in 2025, driven by automotive seat-occupancy and medical-bed systems.
Technological convergence is emerging, with interdigitated electrodes switching roles between capacitive humidity and chemiresistive gas detection, cutting material spend by 35%. Standardized verification protocols now drafted by IEC TC119 will soon govern sensitivity, response time, and drift claims, supporting broader adoption across fixed-installation safety systems.


By Printing Technology: Screen Printing Balances Speed and Cost
Screen printing is forecast to advance at 9.12% CAGR, leveraging 1,000 m² h-¹ throughput and 10-50 µm ink layers optimal for conductive traces. Flexography retained 37.63% of 2025 revenue thanks to high-speed UV curing, while gravure underpins very-high-volume runs exceeding 10 million m² annually.
Material viscosity windows, tooling economics, and registration accuracy determine process selection, prompting hybrid flows that marry inkjet precision with screen-printed dielectrics. Automotive guidelines released by SAE in 2024 now require CpK > 1.33 for critical dimensions, a level that roll-to-roll screen and flexographic lines routinely meet.
By Substrate Material: Paper and Cellulose Gain Sustainability Edge
Paper and cellulose substrates should climb at 9.64% CAGR as EU Regulation 2024/1781 rewards recyclability and digital product passports. Polyethylene terephthalate captured 41.28% of the printed flexible sensor market size in 2025, offering optical clarity for touch overlays, while polyimide endures 200 °C reflow cycles essential for under-hood and aerospace uses.
Life-cycle studies show coated-paper sensors emit 60% less CO₂ than polyethylene terephthalate equivalents, and plasma-deposited barrier films now hit < 1 g m-² day-¹ water-vapor transmission rates. However, low tear strength confines cellulose substrates to disposable smart labels and medical patches, reserving polyimide for harsh-environment deployments.
By End-User Industry: Medical and Healthcare Outpace Adoption
Medical and healthcare are expected to expand at a 10.06% CAGR, catalyzed by streamlined FDA review pathways and CMS reimbursement for continuous glucose monitors. Consumer electronics still led revenue at 33.66% in 2025, integrating printed touch, force, and ambient-light sensors to shave component counts and battery draw.
Automotive programs transitioned to printed capacitive steering-wheel grip sensors and lightweight pressure mats that trim harness mass 60%, while industrial facilities swap bulky photoionization detectors for maintenance-free printed VOC arrays. Defense spending of USD 780 million in 2025 validates conformal avionics and soldier health patches, yet stringent calibration needs keep many precision-control markets attached to silicon incumbents.
Geography Analysis
In 2025, North America accounted for 34.57% of global revenue, driven by U.S. Department of Defense procurement and tax credits from the Inflation Reduction Act, which boost domestic production. By 2027, public-private initiatives in Michigan, Texas, and North Carolina are expected to expand annual roll-to-roll capacity by 4 million m². These developments highlight the region's focus on strengthening its domestic manufacturing capabilities and fostering innovation through collaborative efforts.
Europe secured 28% of the 2025 revenue, influenced by Regulation 2024/1781, Extended Producer Responsibility fees, and digital product passports that enhance the value of recyclable, cellulose-based sensors. Startups benefit from subsidized access to Germany’s Fraunhofer ENAS pilot line, which accelerates design iterations and strengthens local supply chains. These regulatory and infrastructural advancements are positioning Europe as a leader in sustainable and innovative sensor technologies.
With Saudi Arabia’s NEOM and the UAE’s Dubai IoT Strategy deploying millions of environmental and occupancy nodes, the Middle East is set to achieve the highest CAGR of 9.87% through 2031. The region's strategic investments in IoT infrastructure are driving significant growth and technological adoption. Meanwhile, Asia-Pacific remains the largest hub for fabrication, but declining margins in touch sensors are pushing operators in China, Japan, and South Korea to shift focus towards the more lucrative medical and automotive platforms, justifying their capacity upgrades.

Competitive Landscape
The printed flexible sensor market is moderately concentrated; the top five players accounted for roughly 38% combined share in 2025, leaving room for niche specialists in aerospace, agriculture, and smart packaging. Incumbents are vertically integrating by purchasing ink-formulation and substrate suppliers to shield against silver price swings. Meanwhile, university spin-outs are commercializing graphene and carbon-nanotube alternatives, further diversifying the competitive landscape.
Patent activity increased 34% year-on-year in 2024, with 780 U.S. filings focused on novel electrode geometries and encapsulation chemistries. Draft IEC conformance standards should set a common quality baseline, easing end-user qualification and potentially accelerating consolidation once performance metrics stabilize. These developments are expected to enhance innovation while streamlining market entry for new players.
Japan’s Nissha commissioned a 12,000 m² plant for automotive HMI and medical wearables, reflecting growing demand in these segments. 3M boosted Minnesota output by 40%, addressing supply chain constraints and increasing production capacity. Additionally, Canatu advanced carbon-nanotube touch sensors into European steering-wheel platforms, showcasing the technology's expanding applications. Equipment vendors now market modular roll-to-roll printers under USD 2 million, widening access for contract manufacturers and fueling distributed production networks.
Printed Flexible Sensor Industry Leaders
Canatu Oy
Brewer Science
ISORG
E2IP Technologies
Quad Industries
- *Disclaimer: Major Players sorted in no particular order

Recent Industry Developments
- March 2026: FlexEnable partnered with a Chinese display manufacturer to integrate organic photodetector arrays into foldable screens, targeting 5 million units in Q4 2026 to address hinge-region ambient-light sensing challenges.
- February 2026: Molex LLC secured a USD 85 million contract to supply printed pressure-sensor mats. These seat-occupancy detection mats will feature on 12 vehicle platforms launching between 2027 and 2029. The agreement confirms the technology's readiness for safety-critical applications requiring ISO 26262 certification.
- January 2026: Tekscan Inc. secures FDA clearance for pressure-mapping system. Designed for prosthetic-limb fitting, it features 512 sensing elements. It provides 2-millimeter resolution and supports wireless transmission. This innovation addresses the needs of 2.1 million amputees nationwide.
- December 2025: Canatu Oy, a leader in nanotube tech, raised USD 45M. Led by Nordic firms and a Japanese conglomerate, funding expands nanotube ink production by 150%. The company will set up a support center in Stuttgart, Germany, to assist European automotive clients in integrating touch sensors into steering wheels and consoles.


Global Printed Flexible Sensor Market Report Scope
Sensors that are printed on flexible substrates signify a growing market. While some may consist of a very simple structure with only a few electrodes, others are much more complicated and need the deposition of many layers. They have in common the ability to be printed on plastic substrates, which offers them benefits in terms of mechanical flexibility, thinness, and weight decrease.
The Printed Flexible Sensor Market Report is Segmented by Sensor Type (Biosensors, Touch Sensors, Photodetectors, Temperature Sensors, Pressure Sensors, Gas Sensors, Strain and Force Sensors), Printing Technology (Screen Printing, Inkjet Printing, Gravure Printing, Flexographic Printing, 3D and Aerosol-Jet Printing), Substrate Material (Polyimide, PET, PEN, Paper and Cellulose, Others), End-User Industry (Consumer Electronics, Medical and Healthcare, Automotive, Industrial and Manufacturing, Aerospace and Defense, Others), and Geography (North America, South America, Europe, Asia-Pacific, Middle East, Africa). The Market Forecasts are Provided in Terms of Value (USD).
| Biosensors |
| Touch Sensors |
| Photodetectors |
| Temperature Sensors |
| Pressure Sensors |
| Gas Sensors |
| Strain and Force Sensors |
| Screen Printing |
| Inkjet Printing |
| Gravure Printing |
| Flexographic Printing |
| 3D / Aerosol-Jet Printing |
| Polyimide (PI) |
| PET |
| PEN |
| Paper and Cellulose |
| Others, Rest of Substrate Material |
| Consumer Electronics |
| Medical and Healthcare |
| Automotive |
| Industrial and Manufacturing |
| Aerospace and Defense |
| Others, Rest of End-User Industry |
| North America | United States |
| Canada | |
| Mexico | |
| South America | Brazil |
| Argentina | |
| Rest of South America | |
| Europe | Germany |
| France | |
| United Kingdom | |
| Italy | |
| Spain | |
| Russia | |
| Rest of Europe | |
| Asia-Pacific | China |
| Japan | |
| South Korea | |
| India | |
| Australia and New Zealand | |
| Southeast Asia | |
| Rest of Asia-Pacific | |
| Middle East | Saudi Arabia |
| United Arab Emirates | |
| Turkey | |
| Rest of Middle East | |
| Africa | South Africa |
| Nigeria | |
| Rest of Africa |
| By Sensor Type | Biosensors | |
| Touch Sensors | ||
| Photodetectors | ||
| Temperature Sensors | ||
| Pressure Sensors | ||
| Gas Sensors | ||
| Strain and Force Sensors | ||
| By Printing Technology | Screen Printing | |
| Inkjet Printing | ||
| Gravure Printing | ||
| Flexographic Printing | ||
| 3D / Aerosol-Jet Printing | ||
| By Substrate Material | Polyimide (PI) | |
| PET | ||
| PEN | ||
| Paper and Cellulose | ||
| Others, Rest of Substrate Material | ||
| By End-User Industry | Consumer Electronics | |
| Medical and Healthcare | ||
| Automotive | ||
| Industrial and Manufacturing | ||
| Aerospace and Defense | ||
| Others, Rest of End-User Industry | ||
| By Geography | North America | United States |
| Canada | ||
| Mexico | ||
| South America | Brazil | |
| Argentina | ||
| Rest of South America | ||
| Europe | Germany | |
| France | ||
| United Kingdom | ||
| Italy | ||
| Spain | ||
| Russia | ||
| Rest of Europe | ||
| Asia-Pacific | China | |
| Japan | ||
| South Korea | ||
| India | ||
| Australia and New Zealand | ||
| Southeast Asia | ||
| Rest of Asia-Pacific | ||
| Middle East | Saudi Arabia | |
| United Arab Emirates | ||
| Turkey | ||
| Rest of Middle East | ||
| Africa | South Africa | |
| Nigeria | ||
| Rest of Africa | ||


Key Questions Answered in the Report
How large will the printed flexible sensor market be by 2031?
It is projected to reach USD 4.56 billion by 2031, growing at an 8.38% CAGR from 2026-2031.
Which sensor type is expanding the fastest?
Gas sensors lead with an expected 8.91% CAGR through 2031, driven by new VOC monitoring mandates.
What end-user segment is the main growth engine?
Medical and healthcare applications are set to rise at a 10.06% CAGR on the back of expanded FDA clearances and Medicare reimbursement.
Why are paper substrates gaining traction?
EU eco-design rules reward recyclable materials, and coated-paper sensors emit 60% less CO₂ than polyethylene terephthalate equivalents.
What is the biggest supply-chain risk?
Silver nanoparticle ink price volatility, which cut manufacturer margins after a 22% spike in 1H 2025, remains the chief near-term constraint.
Which region will grow fastest?
The Middle East is forecast to post a 9.87% CAGR as megaprojects like NEOM deploy millions of printed sensors for smart-city infrastructure.
Page last updated on:


