Printed Sensor Market Size and Share
Market Overview
| Study Period | 2020 - 2031 |
|---|---|
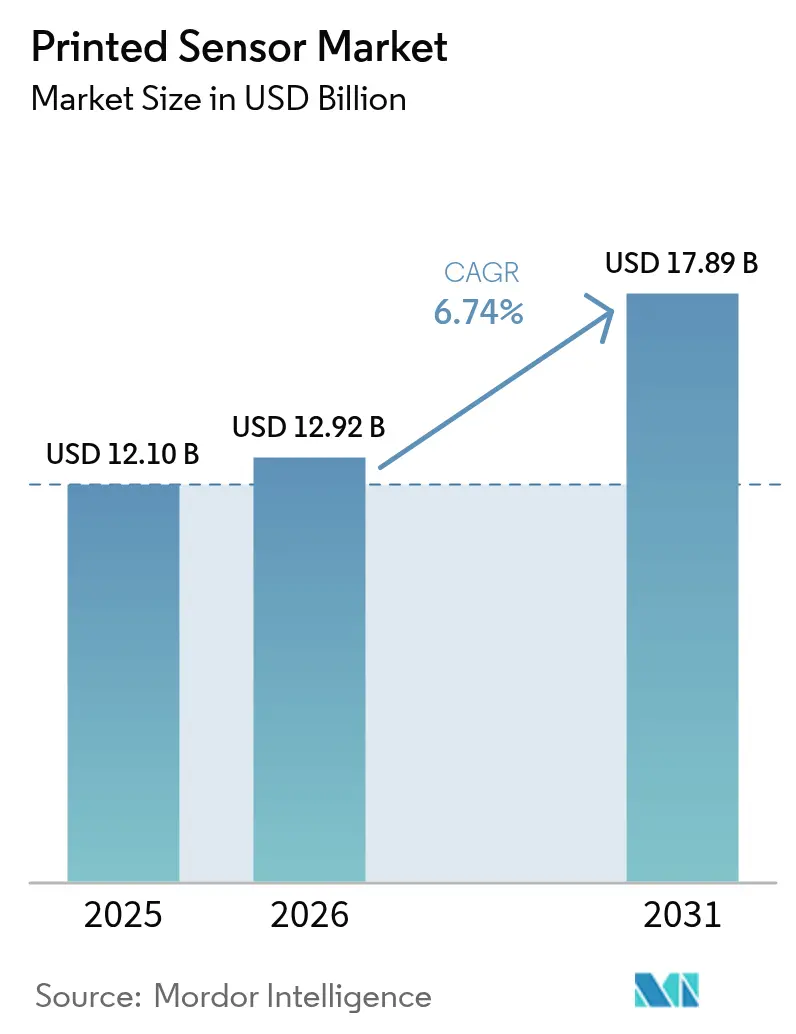
| Market Size (2026) | USD 12.92 Billion |
| Market Size (2031) | USD 17.89 Billion |
| Growth Rate (2026 - 2031) | 6.74% CAGR |
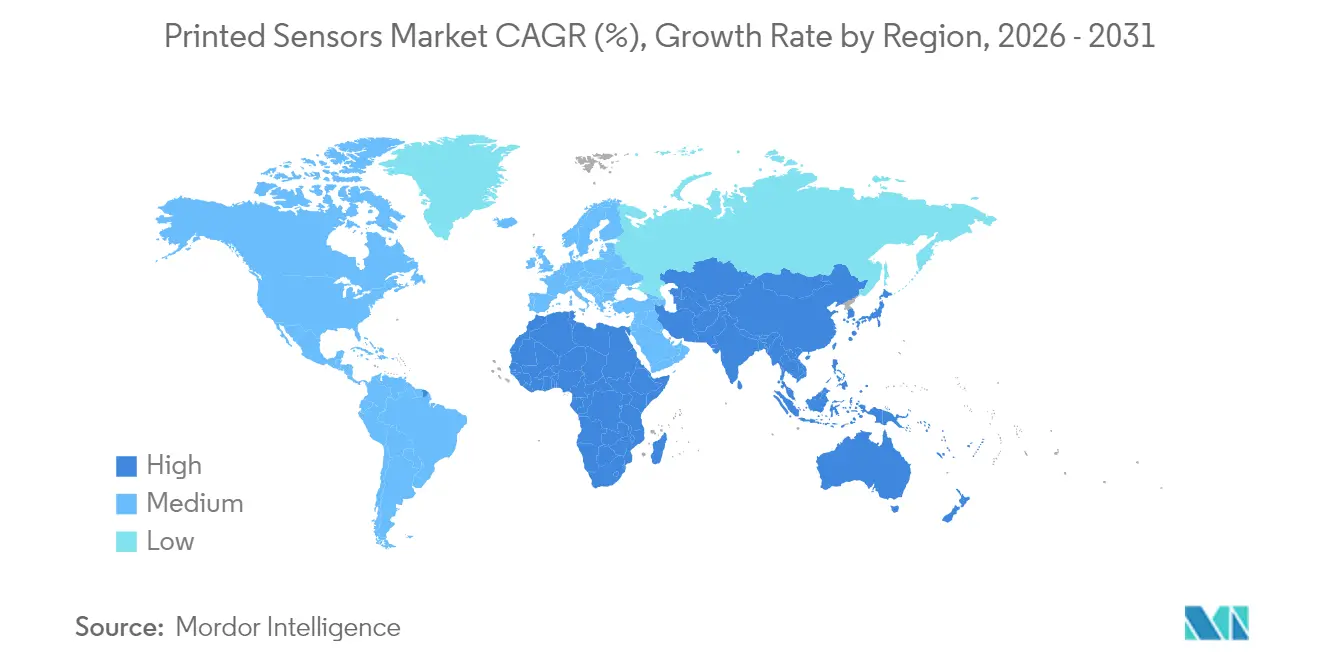
| Fastest Growing Market | Middle East and Africa |
| Largest Market | Asia Pacific |
| Market Concentration | Medium |
Major Players *Disclaimer: Major Players sorted in no particular order Image © Mordor Intelligence. Reuse requires attribution under CC BY 4.0. | |
Printed Sensor Market Analysis by Mordor Intelligence
The printed sensor market size is expected to grow from USD 12.1 billion in 2025 to USD 12.92 billion in 2026 and is forecast to reach USD 17.89 billion by 2031 at 6.74% CAGR over 2026-2031. The shift from rigid micro-electromechanical sensors toward flexible, lightweight designs is the core growth engine, helped by roll-to-roll manufacturing that cuts material waste by up to 90% and slashes unit costs. High-volume consumer IoT curved automotive dashboards, and wearable health devices all depend on these cost reductions. Government stimulus programs in North America and Europe are lowering the capital barrier for new pilot lines, while Asia-Pacific suppliers leverage long production runs to keep average selling prices competitive. Progress in conductive inks, mesh electrodes, and hybrid substrates is widening the performance gap versus conventional MEMS, positioning printed arrays as the default choice wherever low-profile, conformable sensors add value. [1]Tapecon, “Flexible Hybrid Electronics in Biosensing,” tapecon.com
Key Report Takeaways
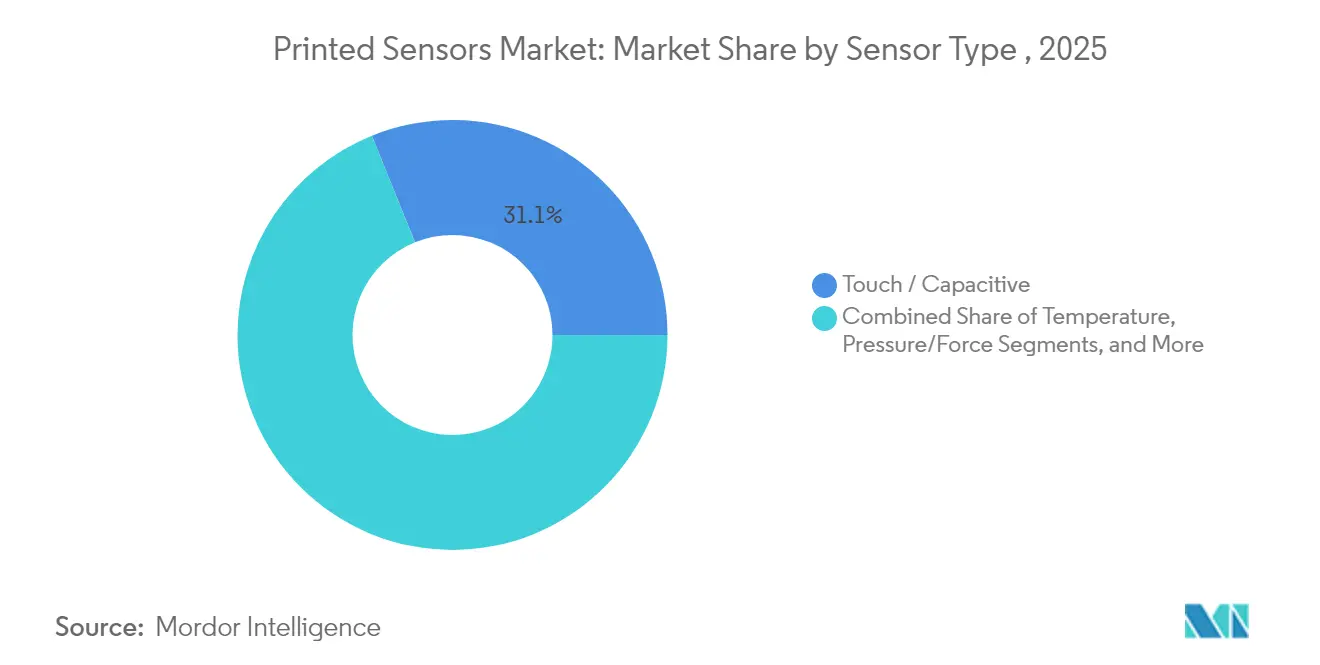
- By sensor type, Touch/Capacitive devices led with 31.12% of printed sensor market share in 2025; Biosensors are poised for the fastest 11.45% CAGR through 2031.
- By printing technology, Screen printing accounted for 41.55% revenue share in 2025, while Aerosol-Jet and other emerging methods are forecast to expand at 13.25% CAGR.
- By substrate, Plastic Films commanded 54.85% of the printed sensor market size in 2025; Textiles & Elastomers record the steepest 13.97% CAGR to 2031.
- By geography, Asia-Pacific held 39.05% share in 2025; the Middle East is the fastest-growing region at a 9.18% CAGR from 2026 to 2031.
- By end-user, Consumer Electronics retained 38.25% share in 2025, whereas Healthcare applications climb at a 10.72% CAGR.
Note: Market size and forecast figures in this report are generated using Mordor Intelligence’s proprietary estimation framework, updated with the latest available data and insights as of 2026.
Global Printed Sensor Market Trends and Insights
Drivers Impact Analysis*
| Driver | (~) % Impact on CAGR Forecast | Geographic Relevance | Impact Timeline |
|---|---|---|---|
| Rapid adoption of flexible and wearable medical devices | +1.8% | Asia-Pacific, spillover to North America | Medium term (2-4 years) |
| Automotive shift to curved HMI dashboards | +1.4% | Global led by Europe and North America | Medium term (2-4 years) |
| Transition from mechanical to solid-state gas detection | +1.2% | Europe expanding to North America, Asia-Pacific | Medium term (2-4 years) |
| Roll-to-roll cost advantage for consumer IoT nodes | +0.9% | Global | Short term (≤ 2 years) |
| Source: Mordor Intelligence | |||
Rapid Adoption of Flexible & Wearable Medical Devices
Asia-Pacific healthcare systems are scaling remote monitoring programs, elevating demand for biosensors that wrap comfortably around skin and textiles. Sweat-based platforms now profile inflammation markers, hydration, and glucose without puncturing the body. Flexible hybrid electronics integrate printed arrays with silicon logic, forming patches that relay real-time vitals over Bluetooth to hospital dashboards, a capability forecast to lift the FHE market past USD 67 billion by 2030. Hospital networks use these continuous data streams to shorten inpatient stays and flag complications early. With unit prices falling under USD 3, even mid-income providers can equip postoperative patients at discharge, accelerating regional adoption. Regulatory bodies in Japan, Korea, and China are formalizing fast-track approvals for wearable diagnostics, further supporting volume growth.
Automotive Shift to Curved HMI Dashboards
Global automakers are replacing mechanical knobs with sweeping touch surfaces that follow interior contours. PolyTC® metal-mesh capacitive layers from KURZ are deposited on PET using roll-to-roll lines and still register touch through 2.5 mm of decorative plastic, satisfying OEM styling goals. These sensors survive the 85 °C heat and 40 °C cold of qualification cycles, preserving responsiveness over vehicle life. Tier-1s are also embedding printed arrays into steering wheels and armrests to detect driver engagement and adjust airbags or alerts accordingly. Software-defined cockpit platforms capitalize on the uniform sensor grid, allowing over-the-air upgrades that refresh control layouts without hardware swaps. Europe and North America lead deployments today, but Chinese EV brands are close behind with fully moulded capacitive panels slated for 2026 launches.
Transition to Solid-State Gas Detection
European process plants are retrofitting factory floors with printable gas arrays that measure ammonia, ozone, and sulphur dioxide in real time. Screen-printed PANI/MoS₂ composites now detect NH₃ at 122 ppb at room temperature. Projects such as CARDIF are pursuing radio-frequency tags that combine sensing and wireless readout, allowing operators to scan hundreds of nodes in minutes. The solid-state format eliminates mechanical pumps and valves, cutting downtime and maintenance spend. North American chemical producers are trailing similar networks to meet OSHA continuous monitoring rules, while Asia-Pacific refineries evaluate printed sensors for dense installations where wired power is scarce.
Roll-to-Roll Cost Advantage in IoT Applications
Continuous web lines pattern copper or silver onto flexible PET at meters-per-second speeds, producing thousands of sensors every hour. Elephantech’s inkjet system reduces copper consumption and cuts emissions, key factors for brands under Scope 3 reporting pressure. For smart packaging tags priced in cents, this scale benefit is decisive. Consumer electronics makers deploy disposable temperature and humidity dots inside shipping boxes to verify cold-chain integrity, using the printed sensor market advantage to stay within strict margin targets. The same economics extend to smart city air-quality grids, where city councils require low-cost nodes to blanket urban canyons. [2]SEMI, “Inkjet Advances for Flexible Electronics,” semi.org
Restraints Impact Analysis*
| Restraint | (~) % Impact on CAGR Forecast | Geographic Relevance | Impact Timeline |
|---|---|---|---|
| Limited long-term stability of conductive inks under thermal cycling | -0.8% | Global, extreme climates | Medium term (2-4 years) |
| Lack of standardized test protocols for stretchable biosensors | -0.6% | Global led by North America, Europe | Short term (≤ 2 years) |
| Capital intensity of converting PCB lines to roll-to-roll hybrid lines | -0.5% | Global, highest in Asia-Pacific | Medium term (2-4 years) |
| IP fragmentation around PEDOT: PSS formulations | -0.4% | Global | Long term (≥ 4 years) |
| Source: Mordor Intelligence | |||
Lack of Standardized Test Protocols
Stretchable biosensors bend, twist, and compress with the body, behaviours not covered by legacy IEC 60601 shock or vibration tests. Brands must invent in-house regimes for elongation, wash durability, and skin-contact biocompatibility, slowing design cycles. UL Solutions summarises the maze of CE, FDA, and IEC requirements that differ by product class and geography. Industry groups are drafting common load-case matrices, yet consensus remains elusive because gait monitors, neonatal patches, and smart jerseys all experience unique strain patterns. Qualification delays raise working capital needs and dissuade smaller entrants, capping near-term market penetration.
Limited Stability Under Thermal Cycling
Vehicle interiors cycle between −40 °C winter nights and 85 °C summer afternoons, conditions that trigger micro-cracks in silver inks. Studies show resistance creeping upward as traces fracture, eroding signal fidelity. Suppliers now blend elastomeric binders or shift to copper-nickel pastes, trading initial sheet resistance for elasticity. Automotive qualification still requires 1,000 thermal cycles plus humidity soak, extending validation by up to 12 months. Until inks reach parity with rigid-board conductors, some OEMs restrict printed arrays to low-stress zones, tempering immediate volume potential.
*Our forecasts treat driver/restraint impacts as directional, not additive. The impact forecasts reflect baseline growth, mix effects, and variable interactions.
Segment Analysis
By Sensor Type: Biosensors Revolutionize Healthcare Monitoring
Touch/Capacitive units led the printed sensor market with 31.12% share in 2025, a dominance tied to their ubiquity across phones, laptops, and infotainment displays. Biosensors, though smaller today, are growing at an 11.45% CAGR as hospitals shift to continuous assessment outside clinical walls. This wave is anchored by nanozyme chemistry that enables non-invasive detection of lactate, glucose, and infection markers. Regulatory green lights for remote patient monitoring refund schemes in Canada and Germany widen the addressable base. Gas/Chemical, Temperature, Pressure/Force, and Piezo/Strain categories fill niche roles in safety, battery packs, and structural health, with breakthroughs such as 122 ppb ammonia detection enabling new compliance solutions. Integrated multi-modal stacks combine touch, pressure, and biometrics in a single laminate without enlarging the footprint, winning space-constrained designs in smart rings and earbuds.
Biosensor patches priced under USD 10 encourage mass screening programs across Southeast-Asian clinics, improving chronic disease tracking. Pressure arrays printed on TPU film feed force data to AI gait engines that flag fall risk in elder-care homes. Gas sensors embedded inside lithium-ion modules offer early venting alerts, helping pack makers comply with UN 38.3 safety rules. Piezo threads woven into factory belts decode strain, letting predictive maintenance software schedule downtimes before catastrophic tears. This functional diversity keeps suppliers agile; custom ink chemistries, substrate picks, and electrode geometries shift from project to project, forcing a modular production toolkit.


By Printing Technology: Screen Printing Dominates Production
Screen printing captured 41.55% of revenue in 2025, thanks to proven throughput, thick-film build-up, and equipment amortized over decades in ceramics and PCBs. Typical line widths around 100 µm satisfy most capacitive and resistive formats, while recent mesh upgrades push resolution nearer 50 µm. Inkjet retains relevance for short runs where designs evolve weekly; brands can pivot without fabricating new screens. Aerosol-Jet, electrohydrodynamic jets, and MEMS micro-nozzle arrays post the fastest 13.25% CAGR by depositing sub-10 µm tracks on 3D contours, perfect for antennas snaking around housings or fine-pitch temperature grids inside batteries.
Flexographic presses win when length hits hundreds of meters and colour registration is forgiving. Gravure excels at uniform nano-thick coatings where optical clarity matters, such as transparent heaters on HUD windshields. Hybrid lines mix methods: inkjet prints seed layers, laser sintering fuses copper, and screen coating applies protective dielectric topcoats. The choice shapes cost, feature density, and reliability, so tier-1s increasingly co-locate multiple machines. Emerging AI vision systems adjust squeegee angle and jet dwell time in real time to hold tolerance, lifting yield beyond 98%.
By End-User: Healthcare Applications Drive Growth
Consumer Electronics accounted for 38.25% of the printed sensor market size in 2025, as smartphones, tablets, and wearables employ capacitive interfaces and environment sensors. Healthcare grows at 10.72% CAGR, buoyed by insurance reimbursements for telehealth and clinician demand for uninterrupted vitals streams. Hospital procurement teams value non-invasive sweat patches that detect dehydration within 90 seconds. Disposable sensor liners for infusion bags allow sterile pH and dissolved-oxygen reads in single-use bioreactors, trimming clean-in-place costs for drug makers. Industrial & Manufacturing users integrate printed piezoresistors on motors and pumps to predict gearbox failures days ahead.
Automotive engineers embed capacitive films under decorative veneers on dashboards, steering wheels, and B-pillars to unify controls. Aerospace primes adopt thin thermistors on turbine blades, leveraging low mass to avoid rotor imbalance. Agriculture outfits trial nitrate sensors printed on biodegradable stakes, mapping soil health cheaply across hectares. Smart-packaging firms deploy temperature strips inside vaccine boxes to flag cold-chain breaks. Each vertical demands certification and domain fluency, so vendors tailor documentation, firmware, and calibration protocols, reinforcing segmentation sophistication.

By Substrate: Textiles & Elastomers Enable Wearable Innovation
Plastic Films held 54.85% of printed sensor market share during 2025 owing to their smooth surface, low water absorption, and easy lamination. Yet Textiles & Elastomers accelerate at 13.97% CAGR as fashion and med-tech brands merge aesthetics with data. Knitted cotton and spandex accept stretchable silver inks that maintain conductance past 150% elongation without delamination. Pressure sensors woven into socks now reach 3.42 kPa-1 sensitivity with 32 ms response, enabling post-surgery gait rehabilitation. DIW techniques draw traces along yarn paths, then encapsulate them in breathable polyurethane, resulting in washable e-garments that survive 50 laundry cycles.
Paper-based formats meet single-use food-safety tests, biodegrading after discarding to cut landfill load. Glass remains indispensable for high-temperature or optically clear roles, for example bussed capacitive grids inside OLED lighting panels. Researchers explore silk fibroin, chitosan, and cellulose acetate as eco-friendly substrates, but mechanical robustness is not yet mass-production ready. Choice of base layer dictates compatible curing temperatures; low-Tg fabrics need photonic sintering or cold plasma to solidify tracks. Suppliers offering substrate-ink bundles therefore lock in design wins across multiple verticals.
Geography Analysis
Asia-Pacific commanded 39.05% of the printed sensor market in 2025, backed by China’s large-scale production capacity, Japan’s material science depth, and South Korea’s display majors. Local R&D consortia turn lab breakthroughs into pilot lines fast, shortening the cycle from concept to export. Government grants offset depreciation on new gravure presses that print OLED touch matrices, while universities spin off start-ups targeting hospital wearables. The regional pipeline includes textile-integrated respiration sensors and foldable touch foils for e-paper readers, diversifying revenue beyond phones.
North America leverages the CHIPS & Science Act, which earmarked funds for printed electronics testbeds, helping fabs overcome high capex. Partnerships between material suppliers and aerospace primes produce pressure arrays as thin as 25 µm to measure wing flex without aerodynamic penalty. The healthcare ecosystem anchors adoption: clinics run at-home monitoring pilots reimbursed by Medicare, validating business cases for biosensor patches. Research centers in Boston and Silicon Valley iterate ink formulations that sinter at 70 °C, compatible with heat-sensitive thermoplastics.
The Middle East posts the swiftest 9.18% CAGR through 2031 as Gulf states channel oil revenue into smart city blueprints. Dubai’s Route 2020 Metro deploys printed strain gauges on tracks for predictive maintenance, while Riyadh’s giga projects embed air-quality arrays across construction sites to meet new environmental codes. Foreign joint ventures set up roll-to-roll lines near Jebel Ali, exploiting duty-free zones to serve Europe and Africa. Europe retains a strong foothold, notably Germany where Tier-1s refine curved HMI panels. The EU’s Chips for Europe Initiative adds EUR 7.9 billion to semiconductor capacity including flexible hybrids, anchoring long-term competitiveness.

Regulatory Landscape
Printed sensors span consumer, industrial, automotive, and medical-device compliance regimes, so market access often turns on how the product is classified, for example as a general-wellness wearable, an industrial component, or part of a regulated medical device. In the United States, the FDA provides the baseline device-regulation framework and is transitioning its inspection approach away from the legacy QSIT model (with a formal shift underway in 2026). For printed biosensors and sensing modules integrated into remote monitoring products, this raises the emphasis on auditable design controls, supplier qualification, and process validation.
Standardization for printed electronics is anchored by IEC Technical Committee 119, which manages the IEC 62899 series covering terminology, materials characterization, and printability methods. Recent updates include IEC 62899-203:2024 for semiconductor-ink characterization, and additional IEC 62899 printability parts updated through 2025-2026, reinforcing the need for consistent measurement protocols across conductive inks and printed layers. For gas sensing tied to healthcare or IVD use cases, the evidence pack also points to a 2026 US FDA import-alert posture that references AEC-Q100 Rev G style reliability reporting for high-precision gas sensors effective September 1, 2026, increasing compliance and documentation requirements for exporters shipping into the US.
Value Chain Analysis
The printed sensor value chain starts upstream with substrate suppliers, including plastic films such as PET/PEN, paper and emerging biodegradable papers, glass, and textiles or elastomers, along with functional materials such as conductive, dielectric, and sensing inks (for example silver and copper-based pastes, plus polymer systems). These then feed printing and conversion steps, including screen, inkjet, gravure, flexographic, and aerosol-jet, followed by curing or sintering, encapsulation, lamination, and in-line inspection to control resistance uniformity and pattern fidelity. Downstream, printed sensor elements are integrated into modules with interconnects and conventional electronics (flex circuits, microcontrollers, and wireless or Bluetooth connectivity), and then qualified to end-user requirements across consumer electronics, healthcare, industrial, and automotive supply chains.
Recent commercialization signals point to midstream moves toward scale partnerships and automotive-ready manufacturing platforms. Wacker Chemie AG moved NEXIPAL Sense sensor laminates into serial production in Germany using automated roll-to-roll processing (March 2025), while Ynvisible partnered with CCL Design (April 2025) to scale printed electronics production through a packaging and manufacturing network. For automotive-oriented integration, TactoTek signed a manufacturing partner agreement with Symbiose (February 2026) to expand IMSE manufacturing capacity, underscoring the growing role of specialized integrators that can deliver reliability, traceability, and high-volume output. Materials and process co-development also remains central, illustrated by Henkel and Brilliant Matters partnering in 2026 to co-develop screen-printable silver inks aimed at high-throughput manufacturing, with inks continuing to act as a key bottleneck and differentiator alongside equipment uptime and yield.
Competitive Landscape
The market is moderately concentrated. Top incumbents integrate silver-mesh know-how, dielectric pastes, and test fixtures under one roof, advertising turnkey modules. Mid-size specialists differentiate via novel chemistries such as copper-oxide nano-inks that laser sinter at low power. Start-ups secure design wins in biosensing by proving medical-grade repeatability with fewer layers, cutting BOM cost. Strategic deals expand footprints: Laserssel’s selective reflow tech bonds flex circuits at sub-180 °C, letting automotive suppliers mount chips without warping housings. Licensing battles surround PEDOT: PSS variations, prompting some OEMs to switch to carbon-based inks to avoid royalties.
Renesas bundles microcontrollers and printed pressure sheets into turnkey reference designs, shortening customer development. Tekscan boosts service revenue by overlaying AI calibration to transform raw force data into actionable insights. New entrants chase white space in biodegradable disposables, positioning cellulose-based sensors for food freshness labels. Partnerships across the value chain grow; ink formulators team with textile mills to guarantee adhesion specs, while equipment vendors embed machine-learning vision to predict paste drying deviations. Vendors that master rapid line changeovers hold an edge as consumer brands demand five product iterations per year.
Printed Sensor Industry Leaders
Renesas Electronics Corporation
Molex LLC
Nissha Co. Ltd.
ISORG SA
Canatu Oy
- *Disclaimer: Major Players sorted in no particular order

Market Opportunities and Future Outlook
Healthcare wearables and point-of-care formats provide a clear whitespace for printed biosensors where standardized test protocols and qualification workflows lag product innovation, particularly for stretchable, skin-contact designs. The current friction is that stretchable biosensors face non-uniform requirements across CE, FDA, and IEC pathways, and the lack of standardized test protocols slows OEM qualification. This creates an opportunity for suppliers that package printed sensing elements with validated biocompatibility, risk management, and quality-system documentation (ISO 10993, ISO 14971, ISO 13485) and for efforts that translate IEC TC 119 measurement methods into repeatable, application-specific qualification playbooks.
Manufacturing scale-up and localization initiatives are also opening room for capacity-led competition in flexible sensing and adjacent flexible electronics that share printing infrastructure. DP Patterning opened a new facility in Norrkoping, Sweden (May 2026) with stated capacity of 10 million square meters for flexible electronics and sensor manufacturing, supporting European supply continuity for customers pursuing regional sourcing. In Asia, investment into flexible module capacity tied to electrification is adding pull for printed sensing elements used in battery and smart-packaging ecosystems; Synopex, for instance, announced a 15 billion won investment to expand its Yen Phong facility in Vietnam (July 2026) targeting EV battery applications. On the device-integration side, automotive interior HMIs and smart packaging remain practical adoption channels because roll-to-roll economics and conformable form factors directly address cost and industrial-design constraints, especially where capacitive and environmental sensing can be embedded into films, labels, and curved surfaces.
Recent Industry Developments
- May 2026: DP Patterning opened a new production facility in Norrkoping, Sweden, adding large-area capacity for flexible electronics and printed sensor manufacturing. The site was positioned around high-volume output (10 million square meters of capacity), strengthening European supply options for brands seeking regional manufacturing and shorter logistics chains.
- October 2025: Renesas expanded its industrial sensing portfolio with new magnet-free inductive position sensor ICs and a web-based solution design tool. The release supports tighter integration between printed sensing layers and conventional control electronics by simplifying design-in workflows for robotics and industrial motion applications.
- November 2024: Nissha announced an update around refrigerant gas sensor modules aligned with UL 60335-2-40 Ed.4 Annex LL requirements. The update helps product makers align gas-detection components with evolving safety requirements for HVAC and refrigeration equipment sold into regulated markets.


Research Methodology Framework and Report Scope
Market Definition and Coverage
This market covers revenue generated from printed sensors made by printing functional materials on flexible or rigid substrates to detect inputs such as pressure, temperature, touch, humidity, or chemical signals.
Scope exclusions: We exclude conventional silicon sensor components that are not produced using printing-based fabrication steps, along with stand-alone readout electronics and assembly-only services.
Segmentation Overview
- By Sensor Type
- Touch/Capacitive
- Pressure / Force
- Biosensors
- Gas/Chemical
- Piezo/Strain
- Temperature
- By Printing Technology
- Screen
- Inkjet
- Flexographic
- Gravure
- Aerosol-Jet and Others
- By Substrate
- Plastic Films (PET, PEN)
- Paper and Paperboard
- Glass
- Textiles and Elastomers
- By End-User
- Consumer Electronics
- Healthcare and Medical Devices
- Industrial and Manufacturing
- Automotive and Transportation
- Aerospace and Defense
- Others (Smart Packaging, Agriculture)
- By Geography
- North America
- United States
- Canada
- Europe
- Germany
- France
- United Kingdom
- Italy
- Rest of Europe
- Asia-Pacific
- China
- Japan
- South Korea
- India
- Rest of Asia-Pacific
- South America
- Brazil
- Rest of South America
- Middle East
- GCC
- Turkey
- Rest of Middle East
- Africa
- South Africa
- Rest of Africa
- North America
Data Sources, Market Sizing, and Validation
Desk Research
Desk research was used to establish the fact base and keep assumptions realistic before any modeling started. We typically use public sources such as the US Census Bureau and USITC trade statistics, Eurostat, Japan Customs, and World Bank macro indicators to understand electronics production, trade flows, and pricing context.
To make the scope defensible, we also review sources such as IEEE and other peer-reviewed journals for printed electronics progress, along with patent databases to track where printing processes and sensor formats are being developed. Company annual reports, investor presentations, and credible press releases are used to confirm application focus areas like packaging, healthcare, and consumer electronics, and to sanity check stated capacity or expansion plans. A paid subscription is also used for company financials plus news and financials, which speeds up cross-checking. This list is not exhaustive since other sources were used for data collection, validation, and clarification.
Primary Interviews and Surveys
Primary work was used to fill gaps that desk sources do not explain well, especially around printed sensor adoption rates, average selling price movement, and real shipment mix by sensor type and end use. We spoke with stakeholders across materials, printing process specialists, sensor manufacturers, and downstream users across APAC, EMEA, and the Americas. When any computed number looked inconsistent with observed demand signals, the input was rechecked.
Distribution of primary research fieldwork respondents
| Company type | Respondent position | Region |
|---|---|---|
| Top tier: 35% | CXOs: 17% | APAC: 45% |
| Mid tier: 48% | Functional/Unit leaders: 35% | EMEA: 34% |
| Smaller Players: 17% | Managers: 48% | Americas: 21% |
Market-Sizing & Forecasting
Sizing starts with a top-down build where printed electronics output indicators, device shipment trends in key end uses, and realistic penetration rates are used to reconstruct the revenue pool attributed to printed sensors. The model is then corroborated using selective bottom-up approximations, such as sampled ASP times volume checks by sensor format and channel feedback. Adjustments are made when implied totals conflict with observed production capacity or demand patterns.
Key inputs include the direction of printed ink and functional material prices, substrate adoption (film, paper, and other substrates), and shifts in printing technology mix (for example, screen printing versus inkjet and emerging methods). End-use volume signals from packaging, healthcare wearables, and consumer electronics are also incorporated. When data is missing for smaller formats, gaps are handled by applying conservative adoption bands anchored to interview feedback and confirmed through published pilot-to-commercialization timelines.
Forecasting uses scenario analysis supported by trend-based smoothing on the most stable series. Scenario weights are guided by what interviewees report on design wins, qualification cycles, and expected cost-down paths. Currency conversions are kept consistent within each year. Inflation effects are applied only where pricing feedback suggests pass-through to ASPs.
Data Validation & Update Cycle
Outputs are checked through triangulation across independent signals, then reviewed for large year-to-year jumps that do not match technology readiness or end-market cycles. We run variance checks at the region and application level, and when an outlier appears, it is traced back to the specific assumption driving it. If the explanation is not clear, we recontact the relevant sources.
Before sign-off, the model goes through a multi-step analyst review to keep definitions, math, and assumptions aligned with the written scope. Reports are refreshed annually, and interim updates are made when major events occur that can change demand or pricing. Right before delivery, a final pass is completed so clients receive the most up-to-date view possible.
Mordor Intelligence's Printed Sensors Market Sizing Compared With Other Published Estimates
Published market values for printed sensors can differ because each publisher draws the boundary differently and then applies its own pricing and adoption assumptions. The largest differences usually come from whether flexible printed electronics adjacencies are counted, what is treated as a printed sensor versus a module, and how quickly commercialization is assumed to happen.
Observed adoption signals, such as packaging pilots moving into repeat orders and a reported mix shift toward higher value healthcare uses, are used to keep Mordor Intelligence's 2026 estimate aligned to a printed-sensor-only revenue pool rather than bundling broader printed electronics devices. Other estimates also diverge when they use earlier base years with different currency timing, or when they apply aggressive cost-down curves that compress ASPs without being revalidated through user interviews.
Benchmark comparison
| Source | Market Size | Gaps in Research Methodology |
|---|---|---|
| Mordor Intelligence | USD 12.92 B (2026) | |
| Trade Publisher A | USD 8.01 B (2024) | Uses a 2024 base year and references both revenue and unit output, which can understate value when higher priced healthcare and specialty formats scale later in the cycle. The scope description also suggests a broader regional roll-up with limited clarity on what is treated as a sensor versus a sensor-enabled device. |
| Market Research Portal B | USD 11.50 B (2025) | Presents a 2025 starting point and a long-range forecast, and the write-up indicates overlap with printed and flexible sensor context, which can shift totals depending on whether modules and adjacent flexible components are included. The growth path appears to rely on a faster adoption curve that may not fully reflect qualification and ramp timelines across end users. |
The spread in the table is mainly explained by scope edges and the year used for the starting value, then amplified by different assumptions on adoption speed and ASP movement. By tying the model to clear demand triggers, process mix, and realistic ramp behavior, the final number stays traceable and easier to reproduce when assumptions are updated.


Key Questions Answered in the Report
What is the current value of the printed sensor market?
The printed sensor market size stands at USD 12.92 billion in 2026 and is projected to hit USD 17.89 billion by 2031.
Which sensor type is expanding the fastest?
Biosensors grow at an 11.45% CAGR through 2031, driven by demand for wearable health monitoring devices.
Why are textiles important for future sensor development?
Textiles & Elastomers allow sensors to stretch and breathe with the wearer, supporting smart clothing that can monitor vitals or movement without sacrificing comfort.
Which region is the largest producer of printed sensors?
Asia-Pacific holds 39.05% of global revenue due to its extensive electronics manufacturing base and supportive government programs.
What manufacturing technology leads the industry today?
Screen printing dominates with 41.55% share because of its reliability and thick-film capability, though Aerosol-Jet and other precision methods are growing faster.
How are government policies affecting the market?
Funding from the U.S. CHIPS & Science Act and the EU’s Chips for Europe Initiative lowers the financial barrier for new roll-to-roll lines, accelerating commercialization cycles.
Page last updated on:


