Market Overview
| Study Period | 2021 - 2031 |
|---|---|
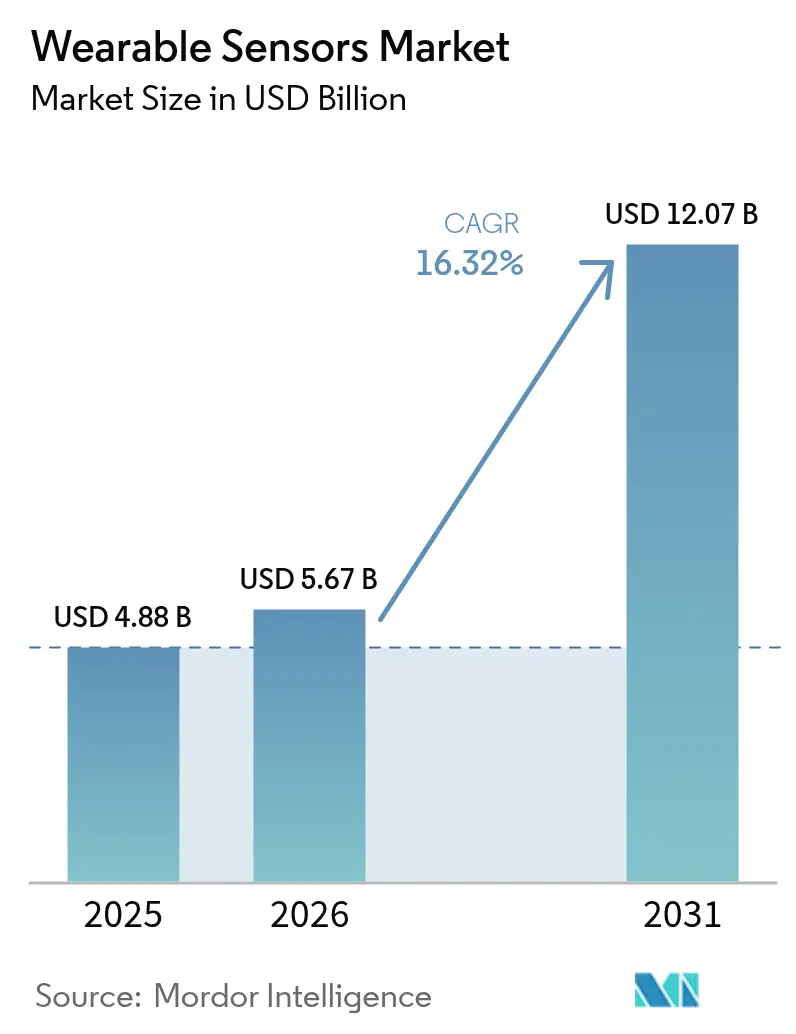
| Market Size (2026) | USD 5.67 Billion |
| Market Size (2031) | USD 12.07 Billion |
| Growth Rate (2026 - 2031) | 16.32% CAGR |
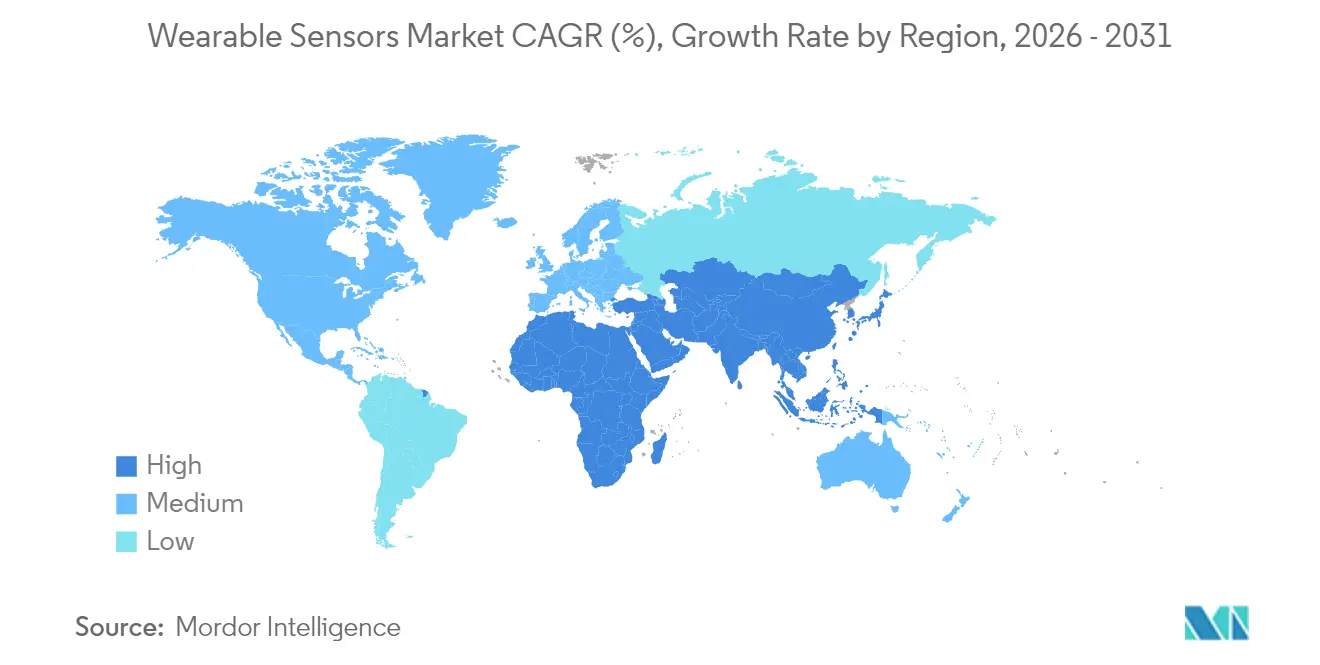
| Fastest Growing Market | Asia Pacific |
| Largest Market | North America |
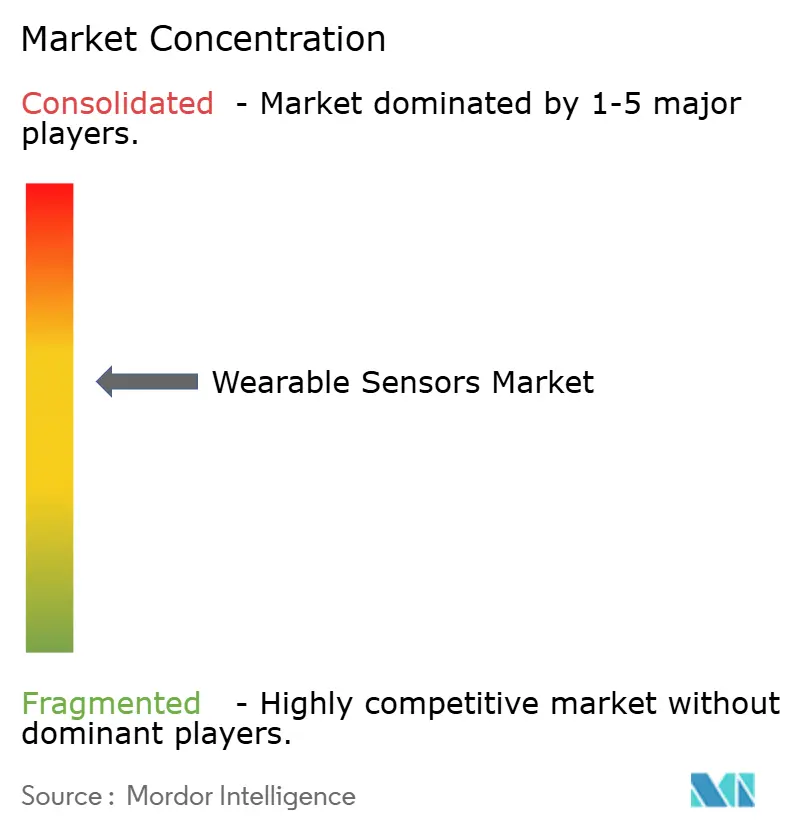
| Market Concentration | Medium |
Major Players *Disclaimer: Major Players sorted in no particular order Image © Mordor Intelligence. Reuse requires attribution under CC BY 4.0. | |
Wearable Sensors Market Analysis by Mordor Intelligence
Wearable sensors market size in 2026 is estimated at USD 5.67 billion, growing from 2025 value of USD 4.88 billion with 2031 projections showing USD 12.07 billion, growing at 16.32% CAGR over 2026-2031. Robust demand for continuous physiological tracking, declining MEMS production costs, and regulatory support for remote patient monitoring underpin this expansion.[1]STMicroelectronics, “MEMS Sensors Ecosystem for Machine Learning,” st.com Semiconductor suppliers are embedding on-device machine-learning cores that cut system power budgets and unlock always-on analytics, while 5G rollouts reduce data-transfer latency and enhance clinical workflow efficiency. [2]Frontiers in Medicine, “Integrating 6G technology in smart hospitals,” frontiersin.org Corporate wellness programs, exemplified by Chevron’s hydration-patch deployment, add enterprise-scale volumes and diversify end-market exposure chevron.com. Together, these factors keep the wearable sensors market on a high-growth trajectory even as battery-material shortages and privacy statutes raise execution risk.
Key Report Takeaways
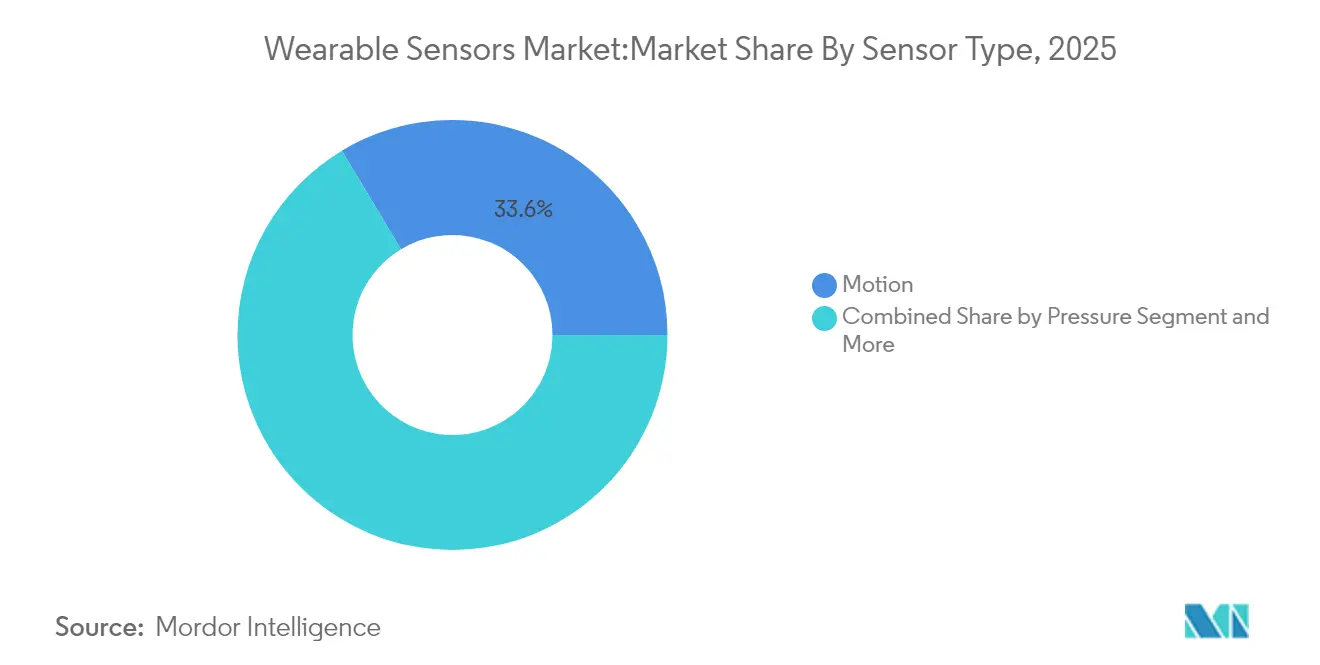
- By sensor type, motion sensors led with 33.60% of the wearable sensors market share in 2025; biosensors are on track to expand at a 18.85% CAGR to 2031.
- By application, health and wellness held 45.40% revenue share in 2025, whereas remote patient monitoring is projected to rise at a 19.35% CAGR through 2031.
- By device form factor, smartwatches accounted for 50.30% of 2025 sales; patches represent the fastest-growing category at a 21.15% CAGR.
- By connectivity technology, bluetooth low energy (BLE) held 71.20% revenue share in 2025, whereas NFC is projected to rise at a 19.20% CAGR through 2031.
- By geography, North America commanded 37.70% share in 2025; Asia-Pacific is anticipated to deliver the highest 18.05% CAGR to 2031
Note: Market size and forecast figures in this report are generated using Mordor Intelligence’s proprietary estimation framework, updated with the latest available data and insights as of 2026.
Global Wearable Sensors Market Trends and Insights
Drivers Impact Analysis*
| Driver | (~) % Impact on CAGR Forecast | Geographic Relevance | Impact Timeline |
|---|---|---|---|
| Fitness & preventive-health boom | +3.2% | Global, with North America and Europe leading adoption | Medium term (2-4 years) |
| Smart-watch unit surge | +4.1% | Global, strongest in North America and APAC | Short term (≤ 2 years) |
| MEMS cost downsizing | +2.8% | Global manufacturing, concentrated in APAC production hubs | Long term (≥ 4 years) |
| Remote-patient-monitoring mandates | +3.7% | North America and Europe regulatory-driven, expanding to APAC | Medium term (2-4 years) |
| Skin-conformal bio-sensor breakthroughs | +1.9% | Global R&D centers, early commercialization in North America | Long term (≥ 4 years) |
| Corporate ESG-linked wearables programs | +1.3% | North America and Europe corporate adoption, expanding globally | Medium term (2-4 years) |
| Source: Mordor Intelligence | |||
Fitness & Preventive-Health Boom
Consumers are shifting from episodic treatment toward continuous wellness management, driving recurring demand for smartwatches and patches that track metabolic, sleep, and stress signals. Corporations reinforce uptake through large-scale wellness deployments that deliver measurable ROI in productivity and safety, such as Chevron’s hydration patches that lowered heat-related incidents. AI-powered coaching modules from Samsung and others convert raw metrics into personalized guidance, which sustains day-to-day engagement and expands data pools for algorithm training . Health-plan providers also gain: a hypertension RPM program posted a 22.2% ROI through reduced emergency visits, validating reimbursement pathways that further enlarge the wearable sensors market .
Smart-Watch Unit Surge
Global smartwatch shipments continue to climb as Apple, Samsung, and emerging ring vendors integrate blood-pressure and neuro-signal sensors to differentiate in a saturating form-factor race. STMicroelectronics’ MEMS volume increased to USD 1.198 billion in Q4 2024, underscoring manufacturing resilience and price elasticity that keep average selling prices in check. IP battles, such as Samsung’s pre-emptive lawsuit against Oura, signal a maturing arena where patents become a key strategic lever rather than speed-to-market alone
MEMS Cost Downsizing
Advances in wafer-level packaging, machine-learning cores, and silicon-carbide substrates push performance per watt higher while slashing die size and bill-of-materials. AI-enabled MEMS from STMicroelectronics run basic inference on-sensor, trimming energy budgets and freeing MCU cycles. TDK’s partner ecosystem accelerates design-win velocity for smaller OEMs and broadens component availability
Remote-Patient-Monitoring Mandates
Regulators embed RPM reimbursement into value-based care schemes, targeting chronic-disease populations to curb hospital readmissions. U.S. adoption is forecast to hit 70.6 million patients in 2025, underpinned by Medicare billing codes that pay for device provisioning and clinician review. Clinical trials confirm accuracy gains; continuous heart-rate tracking in hospitals achieved 66% correlation and flagged early deterioration
Restraints Impact Analysis*
| Restraint | (~) % Impact on CAGR Forecast | Geographic Relevance | Impact Timeline |
|---|---|---|---|
| Data-privacy regulation tightenings | -2.4% | Global, strictest in Europe and select U.S. states | Short term (≤ 2 years) |
| High ASP for multimodal sensors | -1.8% | Global, most pronounced in price-sensitive emerging markets | Medium term (2-4 years) |
| Chronic Li-ion cell shortages | -1.6% | Global supply chain, concentrated in APAC manufacturing | Medium term (2-4 years) |
| Algorithmic racial-bias litigation risk | -0.9% | North America and Europe regulatory focus | Long term (≥ 4 years) |
| Source: Mordor Intelligence | |||
Data-Privacy Regulation Tightenings
Washington’s My Health My Data Act and the EU MDR add overlapping consent and documentation obligations that lift compliance spend and slow multi-region rollouts. [3]Goodwin Procter, “Washington’s My Health My Data Act Comes Into Force – What You Need to Know,” goodwinlaw.com Only 43 notified bodies cover roughly 500,000 devices in Europe, creating certification bottlenecks that reward incumbents with legacy approvals
High ASP for Multimodal Sensors
Tri-modal optics, electrochemistry, and mechanical stacks raise unit costs beyond mass-market reach. Systematic reviews show step-counter devices yield clearer cost-effectiveness than complex monitors, challenging premium SKUs to prove economic benefit
*Our forecasts treat driver/restraint impacts as directional, not additive. The impact forecasts reflect baseline growth, mix effects, and variable interactions.
Segment Analysis
By Sensor Type: Motion Dominance Faces Biosensor Disruption
Motion sensors captured 33.60% of wearable sensors market share in 2025, anchoring user motion analytics across fitness bands and gesture-controlled interfaces. Accelerometers, gyroscopes, and magnetometers hold mature cost curves, preserving gross margins despite ASP pressure. Biosensors, however, post a 18.85% CAGR and will challenge this hierarchy as skin-conformal chemistry extends use cases from glucose to cortisol monitoring.
Biosensor momentum derives from polymer microfluidics that deliver laboratory-grade specificity without venipuncture. Chemical and gas sensors fill industrial safety niches, while pressure devices support cuff-less blood-pressure applications. Temperature sensors win occupational-health mandates for heat-stress prevention. Image and optical sensors migrate from heart-rate photoplethysmography toward optical coherence–based wound care, foreshadowing multimodal fusion that enlarges the wearable sensors market.


By Application: Health Dominance Challenged by Remote Monitoring Growth
Health and wellness held 45.40% revenue, reflecting entrenched consumer behavior and smartphone app synergies that keep churn low. The wearable sensors market size for health and wellness reached USD 2.22 billion in 2025 and still expands as value-added coaching services bundle subscriptions with hardware.
Remote patient monitoring, advancing at 19.35% CAGR, gains ground as payers seek cost-avoidance through early detection. Multi-sensor gateways feeding cloud AI shorten clinician response times, and reimbursement parity with in-clinic visits strengthens provider economics. Sports analytics continue to grow into biomechanics, while industrial safety wearables earn procurement budgets through measurable injury reduction, such as 30% fewer musculoskeletal claims in pilot factories
By Device Form Factor: Smartwatch Leadership Faces Patch Innovation
Smartwatches generated 50.30% of 2025 segment revenue, benefiting from mature supply chains and app ecosystems that integrate fitness, payments, and notifications in one wrist-top hub. The form-factor remains central as vendors add non-invasive blood-pressure monitoring in 2025 launches, bolstering clinical overlap.
Patches, clocking a 21.15% CAGR, penetrate inpatient wards and specialty clinics because they offer continuous multi-day wear with minimal user input. The wearable sensors market size for patches is forecast to exceed USD 2.35 billion by 2031, propelled by glucose and electrolyte tracking. Smart clothing prototypes embed fiber-computers directly into textiles, bringing data capture closer to anatomical movement vectors. Hearables integrate pulse oximetry and body-temperature sensing, while footwear-based pressure arrays support diabetic-foot management programs.
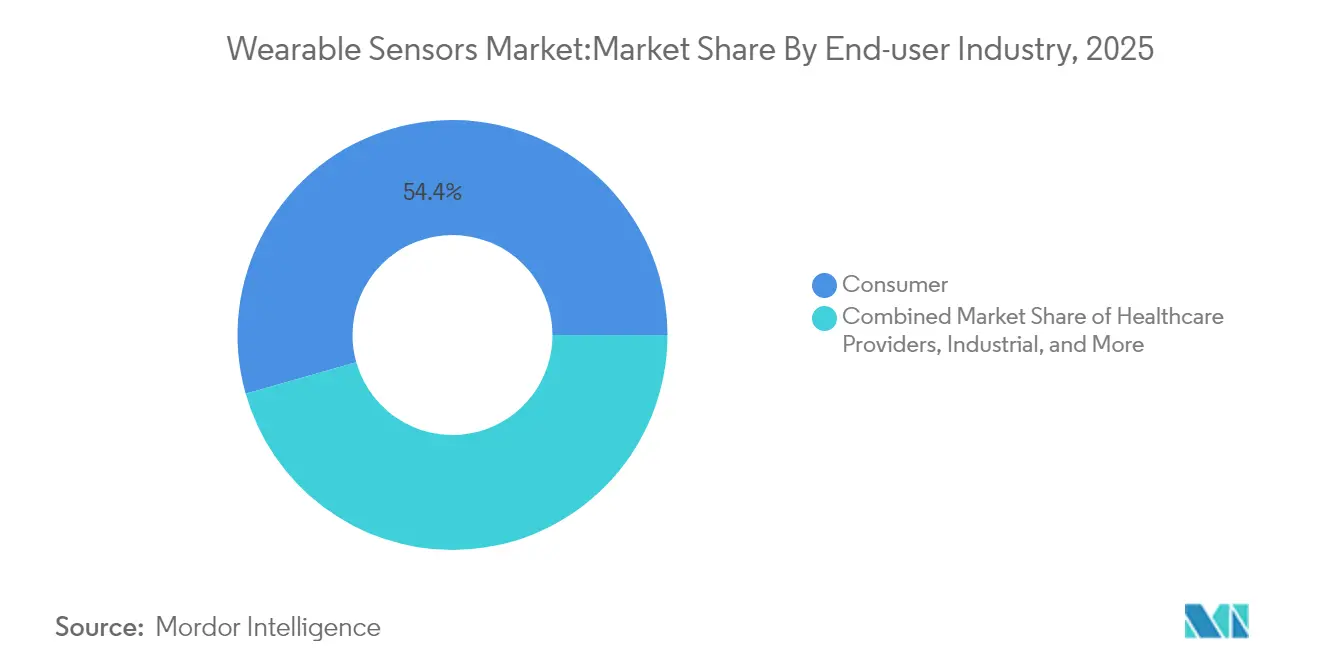
By End-User Industry: Consumer Base Supports Healthcare Provider Acceleration
Consumer electronics retained 54.40% revenue share in 2025 thanks to discretionary spend and short product cycles. Loyalty programs and brand ecosystems keep upgrade velocity high. Healthcare providers, however, are closing the gap with a 19.75% CAGR as clinical validation converts pilot RPM to standard-of-care pathways. Hospitals offset capital outlays with readmission penalties avoided, justifying procurement of FDA-cleared multi-parameter patches.
Industrial adopters embed wearables into safety compliance frameworks; oil-and-gas field trials show 40% fewer recordable incidents when workers wear environmental sensors. Defense programs, under DARPA’s BioElectronics initiative, drive ruggedization R&D budgets and test edge AI in austere environment
By Connectivity Technology: Bluetooth Dominance Faces NFC Disruption
Bluetooth Low Energy held 71.20% connectivity share in 2025 due to smartphone ubiquity and energy efficiency. Continuous upgrades, such as Bluetooth LE Audio, sustain dominance by enabling multi-stream data channels at low power. NFC commands a 19.20% CAGR, propelled by secure short-range transfers in hospital wards and tap-to-pay integration that unifies health and commerce transactions .
Wi-Fi serves bandwidth-intensive tele-ICU feeds, while cellular 5G modules broaden coverage for elderly users without smartphones. Proprietary ANT+ remains popular among endurance athletes, although standardization efforts may consolidate fragmented protocols and enlarge the overall wearable sensors market.
Geography Analysis
North America commands 37.70% of 2025 revenue, underpinned by Medicare RPM codes that reimburse continuous monitoring and corporate wellness budgets that subsidize device rollouts. Venture-capital density anchors a startup pipeline that feeds specialized sensor modalities such as neural interfaces. Nonetheless, state-level data laws amplify compliance overhead and could dilute cross-border data-science synergies.
Asia-Pacific leads growth with an 18.05% CAGR as China’s component factories compress lead times and India’s middle-income cohort adopts low-cost wristbands. Japan’s silver-economy drives hospital investments in continuous vitals patches, while South Korea’s 5G coverage accelerates cloud-to-edge analytic loops. Regional dominance in battery supply also moderates cost inflation risks, though geopolitical frictions could disrupt export flows.
Europe sustains mid-single-digit growth. MDR capacity constraints impede CE-mark renewal cycles, effectively lengthening device replacement lifetimes and slowing innovation churn. Yet public-sector appetite for e-health remains strong, especially in Germany’s Digital Healthcare Act framework that subsidizes app-linked devices. Southern and Eastern Europe see incremental demand as telemedicine fills provider-access gaps.

Regulatory Landscape
Wearable sensors that make medical claims increasingly fall under medical device rules for both hardware and software. In the European Union, the Medical Device Regulation (MDR 2017/745) and related MDCG guidance for medical device software tighten clinical evidence, documentation, and lifecycle obligations, which feeds certification bottlenecks given that only 43 notified bodies are available for a very large device population. In the United States, the FDA updated its general wellness device approach in January 2026, expanding flexibility for low-risk wearables that estimate physiological parameters when positioned as wellness features with defined guardrails.
Data governance and interoperability requirements are also tightening alongside device regulation. The European Health Data Space (Regulation (EU) 2025/327) adds an interoperability layer for health data access and use, while the EU Data Act (Regulation (EU) 2023/2854) increases obligations around access to data generated by connected products such as wearables, while still requiring GDPR compliance for personal and health data. Technical standards that shape validation and procurement continue to advance, including IEC 63430:2025 for wearable sensor data containers, IEEE 1708-2025 (published April 2026) for cuffless blood pressure wearable performance evaluation, and IEEE 3408-2026 for security requirements in wearables supporting payment services.
Value Chain Analysis
The wearable sensors value chain covers upstream materials and components (MEMS, optical stacks, packaging substrates, and rare earth magnets), wafer fabrication plus back-end assembly and test, module integration into devices (smartwatches, patches, hearables, and smart glasses), connectivity and companion software, and downstream analytics platforms that feed data into consumer apps and clinical workflows. Scale suppliers such as STMicroelectronics, Bosch Sensortec, and TDK/InvenSense anchor sensor design and volume availability, while platform partners and ecosystem programs help convert components into reference designs that shorten OEM development cycles.
Bottlenecks cluster around advanced MEMS capacity and specific miniaturized packages during demand spikes, while geopolitics and input constraints can affect materials such as rare earth magnets used in compact wearable form factors. Midstream and downstream value capture is shifting toward data normalization, security, and integration into research and care pathways, reflected in collaborations that connect consumer wearables and clinical platforms (for example, Samsung collaborations that route Galaxy Watch biometrics into clinical research workflows). Fragmented regional regulatory pathways (FDA versus EU MDR) and inconsistent data formats continue to add validation and integration costs, keeping interoperability standards and unified APIs as differentiators for device makers and data-platform providers.
Competitive Landscape
The market is moderately fragmented. Top MEMS suppliers—STMicroelectronics, Bosch Sensortec, and TDK—leverage scale economics and captive fabs to maintain supply-chain reliability. Strategic alliances such as STMicroelectronics’ module collaboration with Qualcomm expand wireless portfolios and lock in reference-design mindshare.
Emerging companies carve niches through differentiated algorithms or novel substrates. Pison’s electroneurography engine, integrated into Timex wearables, offers cognitive-state metrics unattainable by optical sensors finance. Google and Meta invest in impedance tomography and neuromuscular decoding IP that could reset user-interface paradigms.
Industrial-safety specialists such as MakuSafe exploit rapid ROI proof points to outmaneuver consumer-focused incumbents in factory environments advancedmanufacturing.org. Competitive intensity is shifting from hardware differentiation to end-to-end platform value, with cloud analytics, cybersecurity assurances, and regulatory consulting bundled into bids.
Wearable Sensors Industry Leaders
Bosch Sensortec
STMicroelectronics
TDK / InvenSense
Texas Instruments
Analog Devices
- *Disclaimer: Major Players sorted in no particular order

Market Opportunities and Future Outlook
Clinical-grade sensing in consumer-like form factors is widening the addressable whitespace beyond step counting into continuous biomarker and therapy-adjacent monitoring. Research milestones in July 2026 highlighted new pathways for skin-conformal and minimally invasive sensing, including Penn State University work on conductive paint-on electrodes for ECG/EEG/EMG monitoring and KAUST work on a wearable microneedle patch for real-time drug concentration tracking in interstitial fluid. These advances support opportunities for patches and next-generation biosensors that reduce user friction while improving data fidelity for remote patient monitoring and clinical trials.
Manufacturing and supply-chain diversification also creates room for sensor and device suppliers that can scale quality-controlled production while meeting regional compliance and privacy constraints. Capacity and automation initiatives such as Ambrane commissioning an 83,000 sq. ft. automated facility in India (with SMT lines and automated assembly) and Garmin receiving Thai Board of Investment approval for a USD 92.5 million facility in Thailand show how vendors are building regional manufacturing options alongside traditional East Asian hubs. This setup favors wearable sensor platforms that simplify integration (standardized data containers and evaluation methods) and support both wellness-grade features and regulated medical pathways through modular hardware plus software validation toolchains.
Recent Industry Developments
- March 2026: STMicroelectronics announced its sensor and secure wireless technologies to support Qualcomm Technologies’ Snapdragon Wear Elite platform for wearables. The move strengthens reference-design alignment between silicon providers and wearable OEMs, reducing integration risk for motion sensing and secure connectivity in next-generation devices.
- January 2026: Bosch Sensortec introduced the BMI423 IMU at CES 2026, adding features such as voice activity detection and an extended measurement range aimed at always-on wearable use cases. By pushing more intelligence into the sensor layer, the launch supports lower system power budgets and more responsive on-device classification.
- May 2025: STMicroelectronics released the LSM6DSV320X, combining activity tracking and high-impact sensing with embedded AI for personal electronics and wearables. The product targets consolidation of multiple motion use cases into a single inertial platform, helping wearable brands differentiate on sports and impact scenarios without increasing compute load.


Research Methodology Framework and Report Scope
Market Definition and Coverage
This market covers the value of sensors that are integrated into wearable devices and worn on the body to capture a measurable signal (such as motion, temperature, or a biometric parameter), and convert it into usable data for monitoring or feedback.
Scope exclusions: We exclude stand-alone external probes, aftermarket replacement sensor modules sold separately, and basic non-communicating RFID tags.
Segmentation Overview
- By Sensor Type
- Chemical and Gas
- Pressure
- Image / Optical
- Motion
- Temperature
- Biosensors
- By Application
- Health and Wellness
- Safety Monitoring
- Sports and Fitness
- Military and Industrial
- By Device Form Factor
- Smartwatches
- Patches
- Smart Clothing
- Smart Glasses
- Hearables
- Footwear
- By End-User Industry
- Consumer
- Healthcare Providers
- Industrial/Enterprise
- Defense and First Responders
- By Connectivity Technology
- Bluetooth
- Wi-Fi
- NFC
- Cellular (LTE/5G)
- ANT+ / Proprietary
- By Geography
- North America
- United States
- Canada
- Mexico
- South America
- Brazil
- Argentina
- Rest of South America
- Europe
- Germany
- United Kingdom
- France
- Italy
- Spain
- Russia
- Rest of Europe
- APAC
- China
- Japan
- India
- South Korea
- Australia
- Rest of APAC
- Middle East and Africa
- Middle East
- Saudi Arabia
- UAE
- Turkey
- Rest of Middle East
- Africa
- South Africa
- Nigeria
- Rest of Africa
- Middle East
- North America
Data Sources, Market Sizing, and Validation
Desk Research
Desk work starts by organizing public facts that can anchor demand and supply signals for wearables and sensor components. We leaned on sources such as World Bank and OECD macro indicators, ITU connectivity statistics, US FDA device databases and guidance for regulated wearable health devices, Eurostat trade data, and UN Comtrade customs series for electronics components and finished devices.
To keep assumptions realistic, we also reviewed company annual reports, investor presentations, product specification sheets, credible press, and relevant peer-reviewed papers on MEMS and biosensor adoption in wearables. Where additional normalization was needed across countries, we used paid subscriptions focused on company financials and intelligence, news and financials, and patent databases. The desk sources listed here are illustrative, and many other public references were used to collect data points, validate them, and tighten definitions.
Primary Interviews and Surveys
Primary conversations were used to sanity-check what a wearable sensor counts as in commercial terms, and to validate sensor content per device across key use cases such as health monitoring, fitness tracking, and workplace or defense wearables. We spoke with a mix of component-side experts, device-side product leads, channel participants, and domain specialists across major demand regions so regional pricing and adoption differences could be represented in the model.
Distribution of primary research fieldwork respondents
| Company type | Respondent position | Region |
|---|---|---|
| Top tier: 39% | CXOs: 14% | APAC: 44% |
| Mid tier: 47% | Functional/Unit leaders: 33% | EMEA: 29% |
| Smaller Players: 14% | Managers: 53% | Americas: 27% |
Market-Sizing & Forecasting
Sizing is built using a top-down approach where wearable device shipments, installed base behavior, and typical sensor content per device are used to reconstruct the sensor value pool by year. We then cross-check the totals using selective bottom-up approximations, such as sampled average selling price ranges for key sensor families multiplied by implied volumes from channel checks, followed by adjustments when gaps show up.
Key inputs used in the model include wearable device unit shipments and refresh cycles, the average number of sensing elements per device type, the mix shift toward medical and multi-sensor wearables, MEMS and biosensor pricing trends, and regional adoption signals tied to connectivity and healthcare monitoring use. When a subsegment has weak disclosure, we filled the gap using conservative proxy ratios that were confirmed in interviews, and we documented the sensitivity so the impact stayed visible.
For forecasting, scenario analysis is used, supported by expert expectations on how quickly regulated health wearables, sports and fitness wearables, and industrial safety wearables expand in each region. Assumptions for price erosion and feature-led sensor additions are applied consistently, and currency treatment is kept uniform across the time series to avoid artificial jumps.
Data Validation & Update Cycle
Outputs are validated through a sequence of checks that compare the model against independent signals, including device shipment trends, component pricing direction, and known adoption inflection points for health monitoring use cases. When values move outside reasonable bands, we revisit the inputs, and follow-up calls are triggered to confirm whether the change is real or caused by an assumption mismatch.
Before sign-off, results go through peer review to spot math issues, scope leakage, and inconsistent application of pricing or volume drivers across regions. The report is refreshed annually, and interim updates are made when material events occur that can shift shipment outlooks or pricing. Right before delivery, a final analyst pass is completed so clients receive the most current view available.
Mordor Intelligence's Global Wearable Sensors Market Size Versus Other Published Estimates
It is normal to see different market values for wearable sensors because each publisher makes its own calls on what products count, what years are treated as the current base, and how pricing is handled for fast-changing sensor mixes. Differences also come from how much primary validation is done on sensor content per device and on the pace of price erosion in MEMS and biosensors.
Some published numbers broaden scope by folding in adjacent wearable device value or by counting replacement modules sold separately through the channel. In Mordor Intelligence, only embedded wearable sensing elements are counted, and stand-alone probes, aftermarket replacement sensor modules, and non-communicating RFID tags are kept out of the total to avoid mixing device and component revenues.
Benchmark comparison
| Source | Market Size | Gaps in Research Methodology |
|---|---|---|
| Mordor Intelligence | USD 5.67 B (2026) | |
| Global Consultancy A | USD 4.62 B (2026) | Uses a different base-year normalization and may apply a narrower component scope by focusing on selected sensor families and device types, which can compress the 2026 value even if the long-term forecast is similar. |
| Industry Publisher B | USD 2.45 B (2025) | Reports an earlier-year starting point and appears to rely more on high-level growth drivers without clearly reconciling sensor content per device and price progression, which can understate the near-term size. |
Across the table, the spread is mainly explained by scope cutoffs and by how each model treats sensor content and pricing over time. By keeping the count tied to embedded sensor value and then checking it against shipment and price signals, the estimate remains traceable to a repeatable set of steps that a client team can follow and challenge if needed.


Key Questions Answered in the Report
How large is the wearable sensors market in 2026?
The market is valued at USD 5.67 billion in 2026 and is projected to reach USD 12.07 billion by 2031.
Which sensor type grows the fastest through 2031?
Biosensors lead with a 18.85% CAGR thanks to non-invasive skin-conformal technology.
Why are patches gaining traction over smartwatches in clinical use?
Patches support continuous multi-day monitoring of sensitive biomarkers without user intervention, making them ideal for inpatient and chronic-care settings.
What is the key regulatory challenge in Europe?
Limited notified-body capacity under the EU Medical Device Regulation creates approval backlogs that slow new-device launches.
Page last updated on:


