Market Overview
| Study Period | 2020 - 2031 |
|---|---|
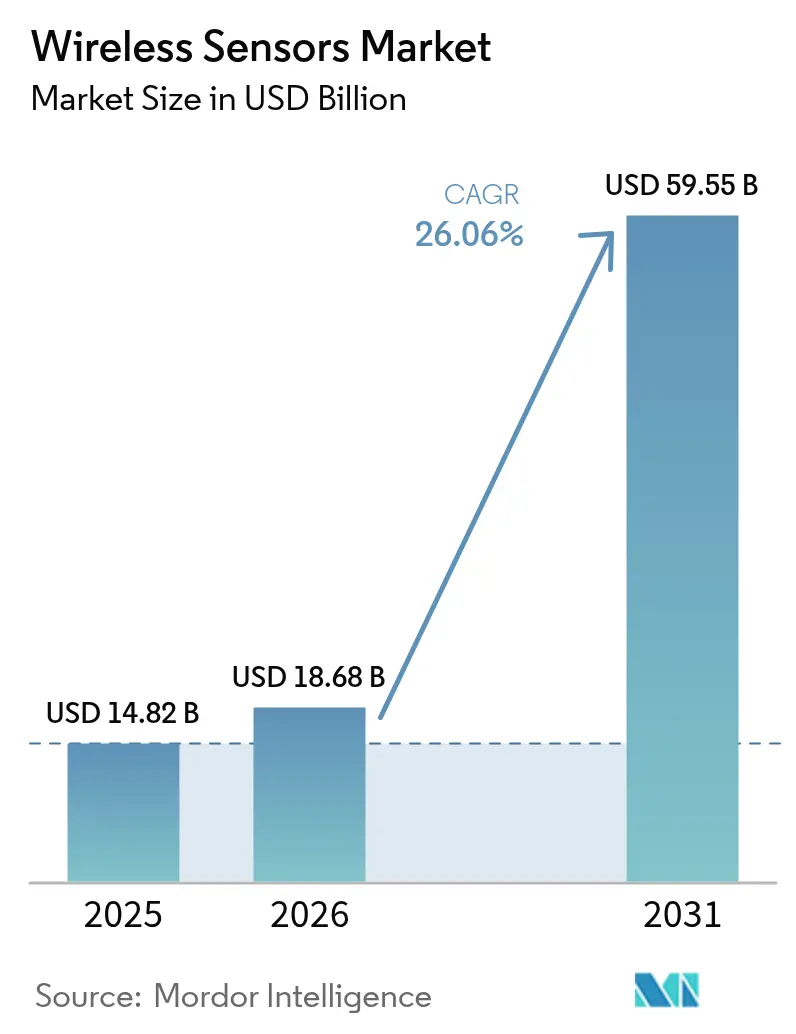
| Market Size (2026) | USD 18.68 Billion |
| Market Size (2031) | USD 59.55 Billion |
| Growth Rate (2026 - 2031) | 26.06% CAGR |
| Fastest Growing Market | Asia Pacific |
| Largest Market | North America |
| Market Concentration | Medium |
Major Players *Disclaimer: Major Players sorted in no particular order Image © Mordor Intelligence. Reuse requires attribution under CC BY 4.0. | |
Wireless Sensors Market Analysis by Mordor Intelligence
Wireless sensors market size in 2026 is estimated at USD 18.68 billion, growing from 2025 value of USD 14.82 billion with 2031 projections showing USD 59.55 billion, growing at 26.06% CAGR over 2026-2031. The double-digit trajectory is driven by falling semiconductor costs, battery-free energy-harvesting breakthroughs, and public-sector funding for smart-infrastructure retrofits. Together, these factors neutralize historical pain points around power consumption, maintenance, and total cost of ownership, positioning the wireless sensors market as a core enabler of Industry 4.0 modernization. Standards convergence around Bluetooth Low Energy (BLE), LoRaWAN, and cellular NB-IoT protocols further lowers integration risk, while predictive-maintenance programs in high-value industries such as oil and gas prove the economic case for continuous sensing. Spectrum policies in North America and Europe grant ample unlicensed bandwidth, shortening deployment cycles and encouraging innovation.
Key Report Takeaways
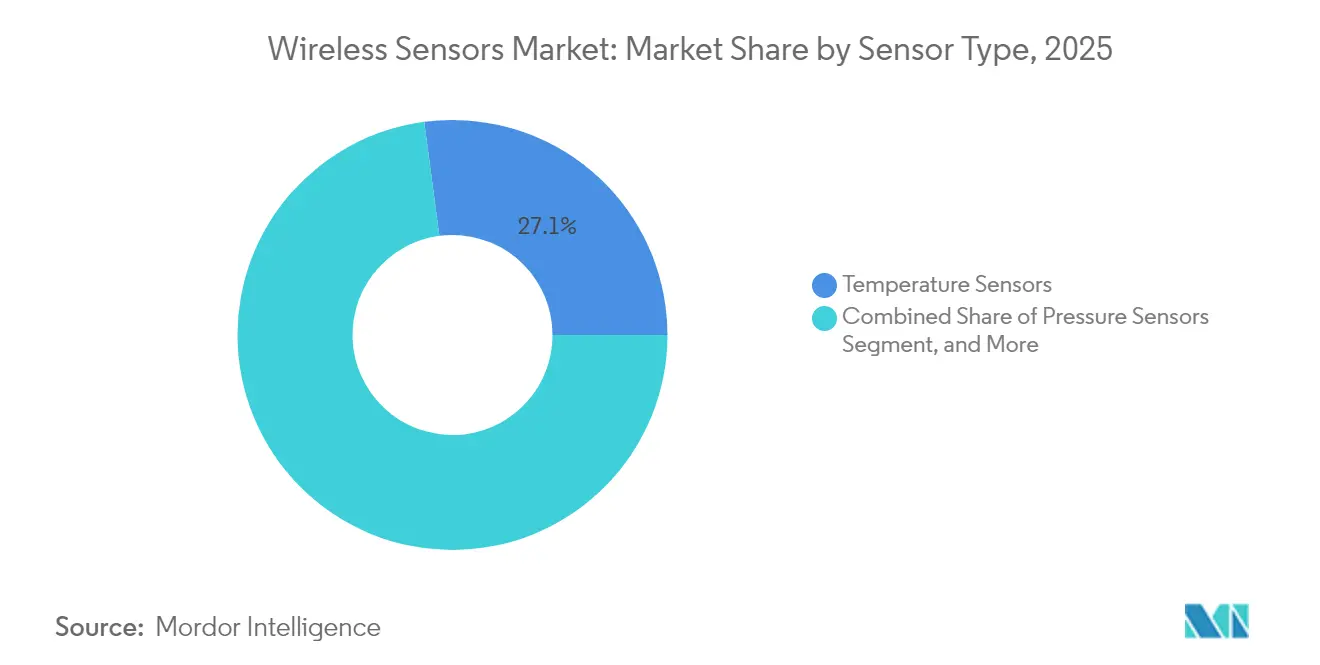
- By sensor type, temperature devices commanded 27.10% of the wireless sensors market share in 2025, while pressure devices are poised to advance at a 26.97% CAGR through 2031.
- By end-user industry, automotive held 22.05% of the wireless sensors market size in 2025, yet logistics and transportation is projected to register the fastest 26.75% CAGR over 2026-2031.
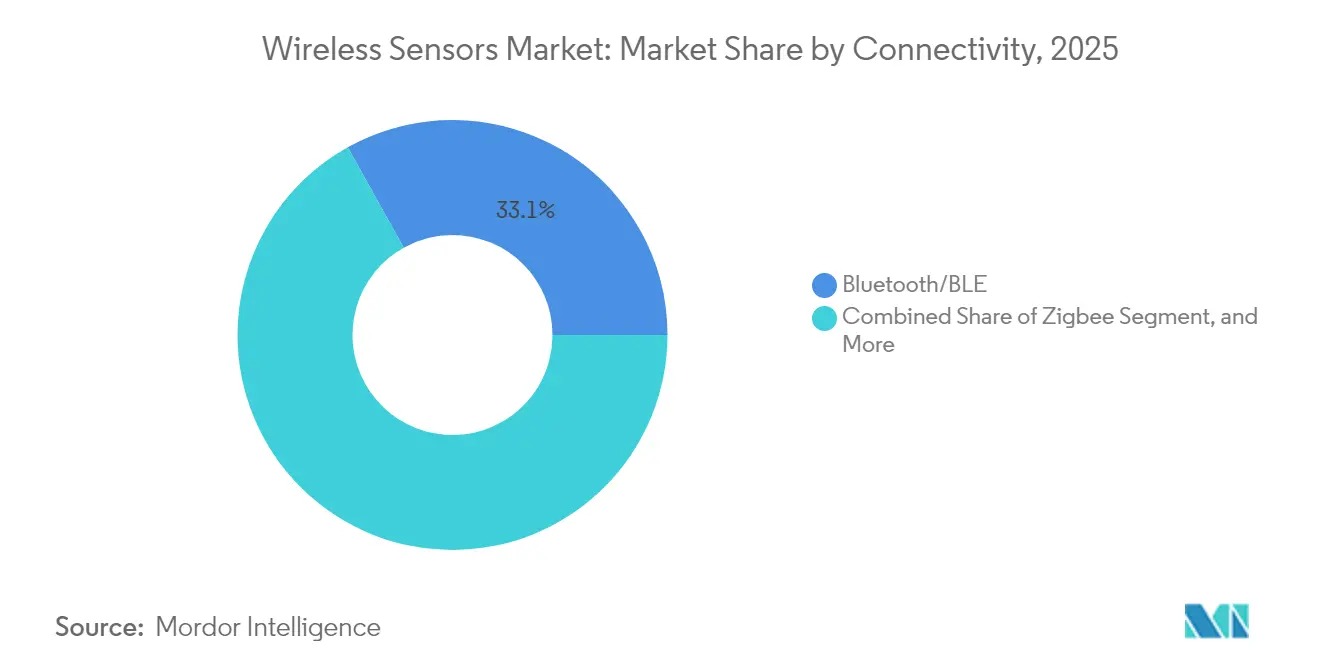
- By connectivity protocol, Bluetooth and BLE captured 33.10% revenue share in 2025 in the wireless sensors market; cellular NB-IoT is expected to deliver a 27.05% CAGR over the same horizon.
- By deployment environment, indoor factory floors led with 37.10% share of the wireless sensors market size in 2025, whereas outdoor harsh-condition installations are forecast to progress at 27.32% CAGR to 2031.
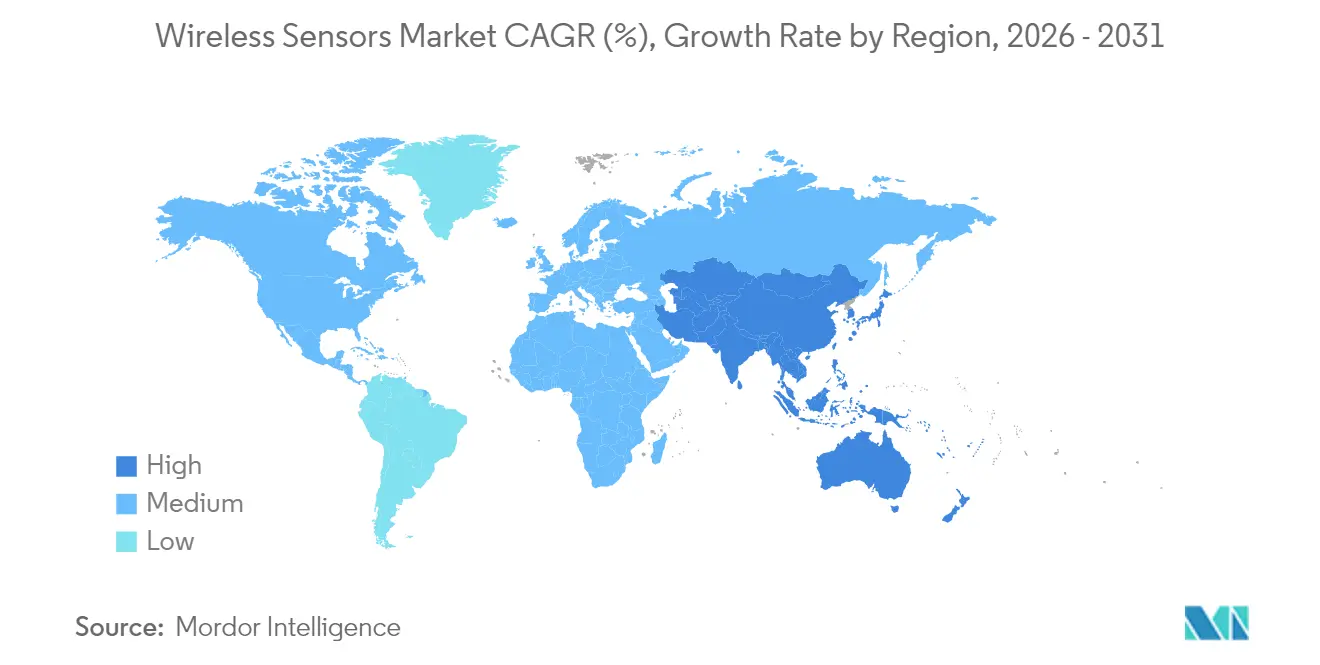
- By geography, North America accounted for 38.10% of 2025 revenue in the wireless sensors market; Asia-Pacific is anticipated to see the strongest 27.22% CAGR through 2031.
Note: Market size and forecast figures in this report are generated using Mordor Intelligence’s proprietary estimation framework, updated with the latest available data and insights as of 2026.
Global Wireless Sensors Market Trends and Insights
Drivers Impact Analysis*
| Driver | (~) % Impact on CAGR Forecast | Geographic Relevance | Impact Timeline |
|---|---|---|---|
| Rapid adoption of Industry 4.0 and IIoT architectures | +4.2% | Global, with APAC manufacturing hubs leading | Medium term (2-4 years) |
| Proliferation of low-power wide-area (LPWA) networks | +3.8% | North America and EU early deployment, APAC scaling | Short term (≤ 2 years) |
| Falling MEMS sensor ASPs enabling massive deployment | +2.1% | Global, with cost advantages in Asian manufacturing | Long term (≥ 4 years) |
| Surge in predictive-maintenance programs across process industries | +1.7% | North America and EU industrial base, expanding to APAC | Medium term (2-4 years) |
| Battery-free energy-harvesting sensor breakthroughs | +0.9% | Remote locations globally, early adoption in oil and gas | Long term (≥ 4 years) |
| Government incentives for smart-infrastructure retrofits | +0.8% | EU Green Deal regions, US infrastructure programs | Short term (≤ 2 years) |
| Source: Mordor Intelligence | |||


Rapid Adoption of Industry 4.0 and IIoT Architectures
Digitization mandates push factories to embed wireless sensors across legacy lines, creating live data streams that feed analytics and machine-learning workflows. German plants posting 23% productivity gains in 2024 validate the financial upside of real-time telemetry.[1]Siemens AG, “Siemens Reports Strong Q3 2024 Results Driven by Digital Industries,” siemens.com Edge compute nodes collocated with 5G small cells shorten decision loops, allowing sub-second control adjustments that wired systems struggle to match. ISO 50001 compliance drives continuous resource monitoring, elevating sensors from ancillary gadgets to strategic assets. Competitive imitation then multiplies deployments across peer facilities. As adoption scales, vendor ecosystems coalesce around open APIs that future-proof investment and speed solution roll-outs.
Proliferation of Low-Power Wide-Area Networks
Nationwide NB-IoT footprints across 45 countries and 95% LoRaWAN coverage of European industrial zones erased the connectivity gap in 2024. Operators monetize idle spectrum slices by offering sub-USD 2 annual connectivity rates at volume, turning use cases like soil-moisture monitoring and remote metering into cash-flow-positive projects within months. Guaranteed service-level agreements make unlicensed networks viable for mission-critical workloads, while ETSI-aligned certification streamlines multinational roll-outs. As access becomes ubiquitous, the wireless sensors market spawns fresh applications outside factory walls, including structural-health diagnostics for bridges and dams.
Falling MEMS Sensor ASPs Enabling Massive Deployment
Eighteen-percent year-over-year price declines in 2024 pushed automotive-grade MEMS devices below USD 5, unlocking monitoring of non-critical assets such as utility poles and HVAC motors.[2]STMicroelectronics, “STMicroelectronics Reports 2024 Third Quarter Financial Results,” st.com Scale economies at multiple foundries diversify sourcing and blunt supply-chain shocks. Lower barriers entice software-centric firms to create vertical solutions without heavy silicon investments, widening the competitive field. Combined with inexpensive radios, sub-USD 10 wireless nodes reach cost parity with manual spot checks, tilting maintenance budgets toward automation.
Surge in Predictive-Maintenance Programs Across Process Industries
Wireless vibration sensors became standard on rotating equipment above 50 horsepower in 2024, trimming downtime costs by as much as 30% and lengthening asset life cycles.[3]Emerson Electric Co., “Emerson Expands Wireless Sensor Portfolio for Predictive Maintenance,” emerson.com Machine-learning models sift through months of high-frequency data to flag anomalies weeks in advance, allowing scheduled interventions rather than emergency shutdowns. Insurance carriers reward data-rich facilities with premium discounts, sweetening ROI calculations. In remote oilfields or offshore rigs, the shift saves helicopter trips and reduces safety risks, reinforcing demand for rugged, intrinsically safe devices.
Restraints Impact Analysis*
| Restraint | (~) % Impact on CAGR Forecast | Geographic Relevance | Impact Timeline |
|---|---|---|---|
| Limited interoperability among proprietary wireless stacks | -2.3% | Global, with fragmentation highest in North America | Medium term (2-4 years) |
| Escalating spectrum-congestion and coexistence issues in sub-GHz bands | -1.6% | Dense industrial regions globally, acute in Europe | Short term (≤ 2 years) |
| Supply-chain volatility for key semiconductor components | -1.2% | Global, with Asia-Pacific manufacturing dependencies | Short term (≤ 2 years) |
| Rising cyber-physical attack surface in OT environments | -0.8% | North America and EU regulatory focus, expanding globally | Medium term (2-4 years) |
| Source: Mordor Intelligence | |||
Limited Interoperability Among Proprietary Wireless Stacks
Vendor-specific protocols inflate integration spending by 40% in multi-supplier deployments, locking buyers into walled gardens that slow innovation.[4]Rockwell Automation, “Rockwell Automation Announces Interoperability Initiative,” rockwellautomation.com Industrial consortia work on common data schemas, yet progress trails market urgency. Enterprises increasingly favor gateway or middleware layers that translate disparate protocols, but these add latency and cost. Faced with customer pushback, large suppliers weigh the trade-off between lock-in profits and addressable-market growth. The stand-off holds back some broad-scale projects until credible interoperability roadmaps emerge.
Escalating Spectrum Congestion and Coexistence Issues in Sub-GHz Bands
Rising densities of wireless nodes in the ISM bands lift packet-loss rates to 15-20% during production peaks, prompting costly network over-provisioning. Radio-frequency path-loss in metal-rich environments limits quick fixes like power boosts. While private 5G offers an escape route, licensing and infrastructure costs remain steep for smaller facilities. Regional inconsistencies in power and duty-cycle regulations complicate global roll-outs, forcing SKU variations that elevate inventory and compliance costs. Spectrum-management tools appear, but skilled staff shortages hamper adoption, capping throughput in the near term.
*Our forecasts treat driver/restraint impacts as directional, not additive. The impact forecasts reflect baseline growth, mix effects, and variable interactions.
Segment Analysis
By Sensor Type: Pressure Growth Challenges Temperature Leadership
Pressure devices are set to outpace all rivals with a 26.97% CAGR on the back of stringent safety programs in oil, gas, and chemical plants, even as temperature devices retained 27.10% revenue leadership in 2025. This shift evidences how predictive-maintenance budgets pivot to failure-preventive pressure data that was once considered optional. Pressure-sensor innovations such as silicon-on-insulator diaphragms coupled with BLE radios yield drift-free performance in corrosive fluids, shrinking calibration overheads. Meanwhile, vibration and position sensors gain momentum in warehouse robotics and rotating-machinery diagnostics, rounding out diversified demand. Integrated multi-parameter nodes further compress installation costs and simplify asset tagging. The wireless sensors market size attributed to pressure devices is forecast to capture a 29.05% slice by 2031, underscoring the momentum shift. Component vendors now pre-calibrate sensors at the factory, speeding time to revenue for system integrators.
Second-generation chemical and gas sensors meet stringent indoor-air-quality norms, prompting HVAC retrofits across healthcare and semiconductor fabs. Image sensors combined with mm-wave radar form visual-inspection modules for hazardous sites, allowing remote safety audits without human entry. Flow and humidity sensors ride water-conservation and pharmaceutical-manufacturing compliance trends, respectively. As multi-sensor configurations mature, buyers lean toward future-proof nodes that accept over-the-air firmware upgrades, securing long-term returns. Consequently, the wireless sensors market supports a growing aftermarket for secure update services that bundle cyber-hygiene with functional enhancements.


By End-User Industry: Logistics Disrupts Automotive Primacy
Automotive held 22.05% revenue in 2025 through established tire-pressure, engine-management, and vehicle-stability use cases, anchoring original-equipment demand and replacement cycles. Yet logistics and transportation is on course for the swiftest 26.75% CAGR as fleets digitize trailers, containers, and forklifts to tighten cold-chain compliance and slash fuel wastage. Real-time geofencing and cargo-condition analytics lower insurance premiums, encouraging mass sensor roll-outs. The wireless sensors market share captured by logistics is projected to top 18.60% by 2031, narrowing the gap with automotive incumbents.
Healthcare adoption accelerates through remote-patient monitoring wearables that minimize hospital readmissions, while energy and power utilities install vibration and temperature nodes on turbines and transformers to defer costly outages. Aerospace and defense procure ruggedized wireless nodes for airframe structural-health monitoring, leveraging lightweight mesh radios to avoid additional cabling. Consumer smart-home devices popularize Wi-Fi and Thread sensors for security and energy management, normalizing sensor use among non-technical buyers and inspiring cross-overs into light-industrial segments. These converging dynamics broaden the wireless sensors industry customer base beyond heavy manufacturing.
By Connectivity Protocol: Cellular NB-IoT Challenges Bluetooth Supremacy
Bluetooth and BLE retained 33.10% of 2025 revenue via near-universal chipset integration, standalone coin-cell operation, and OTA update maturity. However, cellular NB-IoT adoption accelerates courtesy of 5G network slicing, enabling SLA-backed connectivity for utility metering and asset tracking at global scale. Carriers bundle cloud dashboards, simplifying procurement for non-telecom enterprises. As battery-life improvements cut total cost, the wireless sensors market size attributed to NB-IoT endpoints is forecast to hit USD 16.05 billion by 2031.
Wi-Fi 6 serves high-bandwidth inspections such as high-resolution imaging, while Zigbee and Thread mesh networks dominate smart-building retrofits featuring self-healing traffic flows. LoRaWAN owns distant, sparse assets like irrigation pumps, and WirelessHART remains entrenched in process-control loops requiring deterministic latency. Sigfox wanes due to corporate restructuring uncertainty, showing the risks of single-operator dependency. The protocol battlefield is coalescing around open standards with multi-vendor silicon supply, aligning with buyer preference for future-proofed deployments.
By Deployment Environment: Outdoor Harsh-Condition Installations Accelerate
Factory interiors still command 37.10% 2025 revenue because established PLCs and SCADA systems integrate easily with wireless gateways. Yet rugged outdoor settings, from wind farms to mineral-processing pits, are closing in with a 27.32% CAGR as energy-harvesting and high-IP-rated enclosures eliminate maintenance truck rolls. The wireless sensors market size allocated to outdoor nodes is projected to cross USD 18.4 billion by 2031, aided by ATEX-compliant pressure and vibration devices that withstand explosive atmospheres.
Subsea deployments debut acoustic telemetry sensors for pipeline leak detection, while agricultural fields adopt LoRaWAN soil and weather nodes to optimize irrigation. Buildings and residences employ Thread-based occupancy and light sensors to shave HVAC costs, shrinking payback periods to under three years. Regulators increasingly cite continuous monitoring clauses in environmental permits, extending sensor grids to emission stacks and wastewater outlets. Collectively, these use cases diversify revenue and smooth cyclicality tied to discrete manufacturing budgets.
Geography Analysis
North America controlled 38.10% of 2025 revenue, supported by early Industry 4.0 champions, mature system-integrator ecosystems, and transparent FCC rules that endorse unlicensed sub-GHz operation. Corporate tax incentives further accelerate capital-equipment refresh cycles. Public-sector grants for highway, bridge, and water-utility upgrades integrate wireless sensing as standard, stabilizing multi-year demand pipelines. Cybersecurity frameworks such as NIST 800-82 guide OT defenses, reassuring risk-averse buyers and raising the bar for vendors’ secure-development lifecycles.
Asia-Pacific is on track to post the quickest 27.22% CAGR. China’s dual-circulation policy and Made in China 2025 blueprint subsidize digital retrofits and lift bulk orders for MEMS sensors produced by domestic fabs. India’s Smart Cities Mission mandates IoT-enabled utilities, propelling municipal procurements. Japan’s Society 5.0 catalyzes cross-sector pilot projects blending AI, robotics, and sensor platforms. Cost-competitive component supply, combined with soaring regional demand, positions the region as both production hub and volume buyer, reinforcing economies of scale for the wireless sensors market.
Europe balances robust growth with strict regulatory oversight. GDPR adds data-protection overhead, while Cyber Resilience Act proposals push security-by-design. Yet the European Green Deal funds large-scale emissions-monitoring projects, spurring installations along chemical corridors and steel hubs. Fragmented national radio rules gradually harmonize, but integration partners still navigate varying certification paths. Despite complexity, established process-industry clusters in Germany, Italy, and the Nordics provide a stable installed base ripe for wireless retrofits. The Middle East and Africa are nascent but promising, with oil-rich Gulf states piloting energy-harvesting sensors on remote pipelines and African utilities trialing NB-IoT smart-meter roll-outs.

Regulatory Landscape
Wireless sensors operate across radio equipment rules, spectrum-use conditions, and evolving IoT-focused conformity schemes that vary by region. In the United States, the FCC implemented a final rule effective June 15, 2026, establishing a fast-track priority review path for certain equipment when tested in Trusted Test Labs in the United States or economies covered by reciprocal trade agreements, which can affect certification timelines for sensor radios and gateways.
In Europe, harmonization continues through ETSI standards used to demonstrate compliance under the Radio Equipment Directive, including ETSI EN 302 065-4-1 (V2.2.1) for UWB material sensing devices and ETSI EN 303 659 (V1.1.1) for SRD data network devices adopted in February 2025, with national withdrawal deadlines set for November 30, 2026. India is tightening IoT device conformance via the Telecommunication Engineering Centre (TEC), including revised Essential Requirements notified in June 2026 for IoT gateways and endpoint categories such as smart meters, tracking devices, and environmental monitoring devices, which shapes product documentation, testing, and procurement eligibility for large deployments.
Value Chain Analysis
The wireless sensors value chain runs from MEMS and sensing elements (pressure, temperature, vibration, gas) through mixed-signal and RF silicon, modules (BLE, LoRaWAN, NB-IoT), embedded firmware and security, and then device manufacturing and calibration. From there, products move into system integration into OT/IT stacks (SCADA/PLC, historians, and cloud analytics). Channel routes commonly involve industrial automation OEMs, utilities and infrastructure integrators, and connectivity providers that bundle device management, SIM/eSIM, and lifecycle services for LPWA deployments.
Partnerships are increasingly shaping how connectivity and devices are packaged for deployment. In May 2026, Telenor IoT and Sateliot announced a partnership aligned to 3GPP Release 17 NTN so standard NB-IoT devices can shift between terrestrial and satellite networks without custom hardware, shifting more value toward managed connectivity and roaming enablement. In June 2026, WiSig Networks and Viasat partnered to develop an NB-IoT NTN chipset and module, reinforcing upstream module innovation as a way to extend coverage to remote and hazardous assets. Downstream, integrators and portfolio vendors continue to pair sensing hardware with asset performance management and analytics, as reflected in the June 2025 Megger and Sentrisense collaboration in grid-edge monitoring, where utilities' long asset lifecycles and ruggedization requirements influence component qualification and dual-sourcing decisions.
Competitive Landscape
The field remains moderately fragmented. Conglomerates such as Siemens, ABB, and Honeywell leverage installed automation platforms to cross-sell sensor nodes, bundling edge analytics software to lock in recurring revenue streams. Specialized sensor makers like TE Connectivity and Bosch Sensortec compete through niche accuracy specs and miniaturization breakthroughs. Semiconductor houses including Texas Instruments and Analog Devices supply reference designs and pre-certified radio modules, shrinking design cycles for OEMs while safeguarding silicon volumes.
Platform strategies dominate. Vendors wrap hardware with cloud dashboards and AI engines, creating end-to-end offerings that grow annual-recurring revenue and raise customer switching costs. Patent defensibility around energy harvesting, sensor fusion, and secure bootloaders shapes M&A targets, fueling consolidation despite the overall fragmented picture. Supply-chain turbulence in 2024 prompted vertical-integration moves, exemplified by Siemens’ USD 150 million German fab expansion for vibration-sensor lines scheduled to ship 2 million units yearly by 2026 .
Cyber-security and functional-safety requirements add new differentiation levers. Vendors achieving IEC 62443 and ISO 27001 certificates gain bidding advantages in regulated industries. Start-ups exploit gaps by offering protocol-agnostic gateways and zero-trust overlay software, attracting venture funding but facing uphill brand-recognition battles. The competitive equation now hinges on delivering interoperable, secure, and analytics-ready portfolios at scale while maintaining price agility amid MEMS cost declines.
Wireless Sensors Industry Leaders
Honeywell International Inc.
Schneider Electric SE
Siemens AG
Emerson Electric Co.
Texas Instruments Incorporated
- *Disclaimer: Major Players sorted in no particular order

Market Opportunities and Future Outlook
Standards and spectrum changes are expanding practical design options for wireless sensing, especially when higher throughput or deterministic behavior is needed. In the United States, FCC rules effective April 27, 2026, enabled geofenced variable power (GVP) operations in the 6 GHz band (U-NII-5 and U-NII-7), creating design space for higher-bandwidth sensor applications and gateways in complex environments where interference management is critical. Industrial determinism is also being codified: IEC/IEEE 60802-2026 (published June 29, 2026) defines time-sensitive networking profiles for industrial automation, and IEEE 1451.1.6 (published February 6, 2026) standardizes smart transducer interfaces using MQTT, which supports interoperability pathways between sensors, edge systems, and enterprise software.
A notable whitespace is multi-protocol, tiered architectures that reduce lock-in while matching sensor workloads to the right network layer. The LoRa Alliance 2026 roadmap work on mapping between LoRaWAN and OPC UA points to tighter integration between wide-area sensing and industrial information models, supporting faster onboarding into OT systems without bespoke middleware. In parallel, the publication of ISO/IEC/IEEE 32857:2026 for Wi-SUN Field Area Networks (April 2026) adds another standardized option for utility and municipal field networks, complementing NB-IoT and LoRaWAN footprints described earlier. Together, these developments create room for vendors offering protocol-agnostic gateways, secure device management, and pre-integrated analytics for smart infrastructure retrofits and process-industry predictive maintenance, where buyers are weighing total cost of ownership, cybersecurity posture, and deployment speed alongside sensor accuracy.
Recent Industry Developments
- June 2026: Schneider Electric entered a definitive agreement to acquire Cognite Holding B.V. for USD 3.1 billion in an all-cash transaction. The deal strengthens Schneider Electric's industrial data and AI software stack, improving the pathway from sensor data collection to contextualized asset and operations insights across industrial automation deployments.
- May 2026: Emerson launched the Emerson Synchros IIoT platform to expand wireless visibility for asset health without requiring major infrastructure changes. By building on WirelessHART architectures and a platform approach, the release supports broader retrofit deployments across process industries, where continuous monitoring and faster commissioning drive purchasing decisions.
- August 2024: Emerson introduced the Rosemount 802 wireless multi-discrete input or output transmitter to add flexibility for integrating discrete signals into wireless networks. The device expands the range of legacy instrumentation and on-off assets that can be brought into wireless monitoring programs, supporting phased modernization in plants that prefer incremental upgrades over rewiring.


Research Methodology Framework and Report Scope
Market Definition and Coverage
We define the wireless sensors market as revenue generated from sensors that measure a physical or environmental parameter and transmit that data wirelessly to a receiver, gateway, controller, or cloud system for monitoring and decision-making.
Scope exclusions: We exclude standalone wired sensors and basic cabling-only measurement setups that do not transmit data over a wireless link.
Segmentation Overview
- By Sensor Type
- Pressure Sensors
- Temperature Sensors
- Chemical and Gas Sensors
- Position and Proximity Sensors
- Vibration Sensors
- Flow Sensors
- Humidity Sensors
- Image Sensors
- Other Sensor Types
- By End-user Industry
- Automotive
- Healthcare
- Aerospace and Defense
- Energy and Power
- Food and Beverage
- Agriculture
- Building Automation and Smart Homes
- Consumer Electronics
- Logistics and Transportation
- Other End-user Industries
- By Connectivity Protocol
- Bluetooth and BLE
- Wi-Fi
- Zigbee
- Cellular (4G/5G/NB-IoT)
- LoRaWAN
- Sigfox
- WirelessHART
- Thread
- Z-Wave
- Other Connectivity Protocols
- By Deployment Environment
- Indoor Industrial
- Outdoor Harsh
- Remote / Hazardous Locations
- Underwater / Subsea
- Building Infrastructure / Residential
- By Geography
- North America
- United States
- Canada
- Mexico
- South America
- Brazil
- Argentina
- Rest of South America
- Europe
- Germany
- United Kingdom
- France
- Italy
- Spain
- Rest of Europe
- Asia-Pacific
- China
- Japan
- South Korea
- India
- ASEAN
- Rest of Asia-Pacific
- Middle East and Africa
- Middle East
- Saudi Arabia
- United Arab Emirates
- Qatar
- Turkey
- Rest of Middle East
- Africa
- South Africa
- Egypt
- Nigeria
- Rest of Africa
- Middle East
- North America
Data Sources, Market Sizing, and Validation
Desk Research
Desk research was used to set the market boundary and build the first set of sizing inputs that can be cross-checked in public records. We reviewed official statistics and standards references that help explain wireless deployments and device usage patterns, such as FCC equipment authorization databases, NIST publications, ITU materials, and IEEE standards documents.
We also relied on sources that provide demand signals and adoption context, such as the US International Trade Commission data, UN Comtrade trade tables, and World Bank macro indicators. These were complemented with filings and investor presentations from publicly listed companies active in sensing, connectivity, and industrial automation. Where required, we used paid subscriptions for company financials and intelligence, patent databases, and shipment-level import and export reads to sanity check directionally consistent volumes. The sources named here are illustrative and not exhaustive, and many other references were used to collect, validate, and clarify data points.
Primary Interviews and Surveys
Primary work focused on confirming how wireless sensor demand forms in real deployments, and then checking what buyers actually purchase and replace over time. We spoke with stakeholders across component supply, device manufacturing, systems integration, and end users across APAC, EMEA, and the Americas, so pricing, refresh cycles, and deployment intensity assumptions could be adjusted to practical levels.
Distribution of primary research fieldwork respondents
| Company type | Respondent position | Region |
|---|---|---|
| Top tier: 26% | CXOs: 14% | APAC: 43% |
| Mid tier: 53% | Functional/Unit leaders: 38% | EMEA: 35% |
| Smaller Players: 21% | Managers: 48% | Americas: 22% |
Market-Sizing & Forecasting
The core sizing logic uses a top-down and bottom-up mix. We first reconstruct demand from adoption signals in key end-use environments, then translate that into revenue using realistic pricing ranges. We start from indicators such as industrial automation activity, connected device penetration in buildings, automotive electronics intensity, and the spread of low-power wireless standards, which we map to expected wireless sensor attach rates.
To keep totals grounded, we corroborate with selective bottom-up approximations, including sampled shipment ranges from disclosed product lines, channel checks on typical annual order volumes, and an ASP times volume view for common sensor classes like temperature, pressure, and motion. When a supplier discloses revenue only at a broader level, we bridge the gap using product-mix logic and interview-based splits, then recheck output against trade direction and patent activity patterns. For forecasting, we use scenario analysis supported by multivariate regression signals, projecting drivers such as IoT node growth, connectivity module pricing, and replacement cycles, and then reviewing the outputs with experts before finalizing the curve.
Data Validation & Update Cycle
Triangulation is done by comparing the model outcome against independent signals such as shipment movement, protocol adoption trends, and end-market equipment activity, and then checking if implied volumes and ASPs look realistic. Any large variance is investigated, followed by a second analyst review of the assumptions, and then a final consistency check across regions and use environments.
Reports are refreshed annually, and interim updates are triggered when material events occur, such as regulation shifts, major supply constraints, or sharp pricing movements in key components. Before delivery, an analyst performs a fresh pass on the key inputs so clients receive an updated view based on the latest available public information.
Mordor Intelligence's Wireless Sensors Market Size Compared With Other Published Estimates
Published values for wireless sensors can look far apart because each publisher draws the line around a slightly different basket of products and use cases, and because pricing and currency timing choices are not always consistent. The year used as the starting point also changes the reported size, especially in a fast-growing electronics category.
Key gap drivers usually come from what is counted as a wireless sensor versus a connected module, whether services and software are included, and how ASP changes are applied over time for high-volume sensor types. Differences also show up when one estimate assumes faster unit growth for building automation or automotive without sufficient cross-checking against trade movement, standards adoption, and disclosed shipment direction.
Benchmark comparison
| Source | Market Size | Gaps in Research Methodology |
|---|---|---|
| Mordor Intelligence | USD 18.68 B (2026) | |
| Global Consultancy A | USD 27.79 B (2025) | This estimate likely uses a broader counted basket across product types and industry verticals, and it can also apply higher near-term unit ramps for automotive and smart-building deployments with less emphasis on install-base replacement timing. |
| Industry Publisher B | USD 9.10 B (2025) | The lower figure is consistent with a narrower revenue scope and more conservative ASP progression, and it may also apply stricter inclusion on which connectivity types are counted as wireless sensing devices rather than adjacent connected electronics. |
Protocol adoption signals, trade direction checks, and disclosed product revenue movement are the evidence points that keep Mordor Intelligence aligned to wireless sensor device demand and realistic ASP ranges, with a 2026 base year that reflects the study period used on the report page. Read together, the table shows that most of the spread comes from scope breadth and pricing assumptions, which are areas that can be audited through repeatable inputs.


Key Questions Answered in the Report
What is the current value of the wireless sensors market and its expected 2031 level?
It is valued at USD 18.68 billion in 2026 and is projected to reach USD 59.55 billion by 2031.
How fast is the market growing on an annual basis?
The forecast compound annual growth rate is 26.06% between 2026 and 2031.
Which sensor type is expanding the quickest?
Pressure sensors are forecast to grow at a 26.97% CAGR due to safety-critical roles in oil and gas operations.
Which end-user segment will add the most new revenue through 2031?
Logistics and transportation, thanks to post-pandemic supply-chain digitization and fleet optimization needs.
Which region shows the highest future growth potential?
Asia-Pacific, projected to advance at a 27.22% CAGR driven by manufacturing digitization and smart-city investments.
Page last updated on:


