
Preventive Healthcare Technologies And Services Market Size and Share
Market Overview
| Study Period | 2020 - 2031 |
|---|---|
| Market Size (2026) | USD 412.59 Billion |
| Market Size (2031) | USD 741.85 Billion |
| Growth Rate (2026 - 2031) | 12.45% CAGR |
| Fastest Growing Market | Asia-Pacific |
| Largest Market | North America |
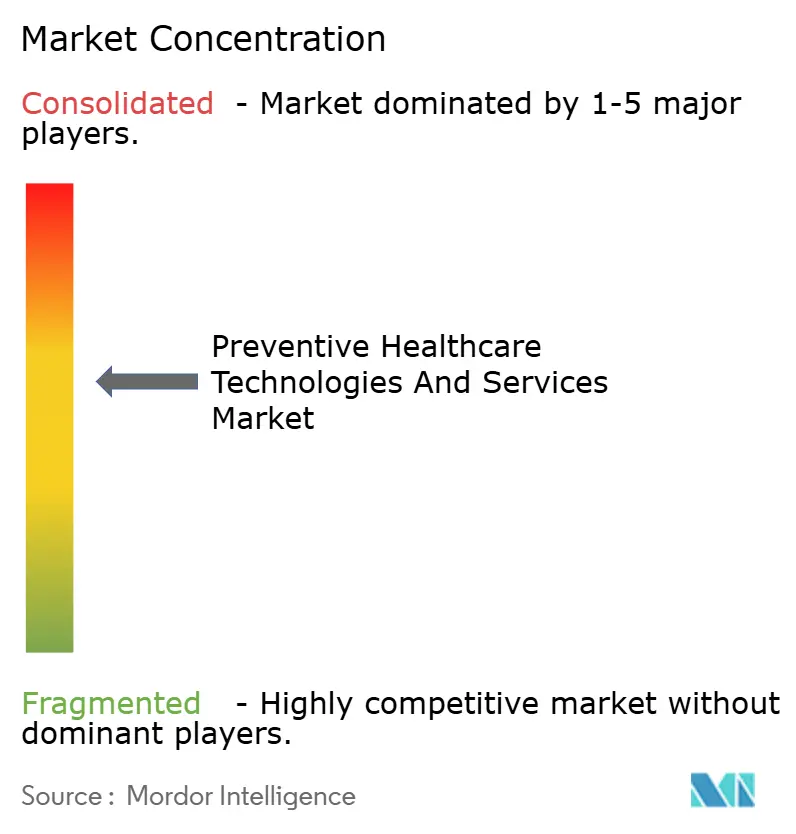
| Market Concentration | Medium |
Major Players *Disclaimer: Major Players sorted in no particular order Image © Mordor Intelligence. Reuse requires attribution under CC BY 4.0. | |
Preventive Healthcare Technologies And Services Market Analysis by Mordor Intelligence
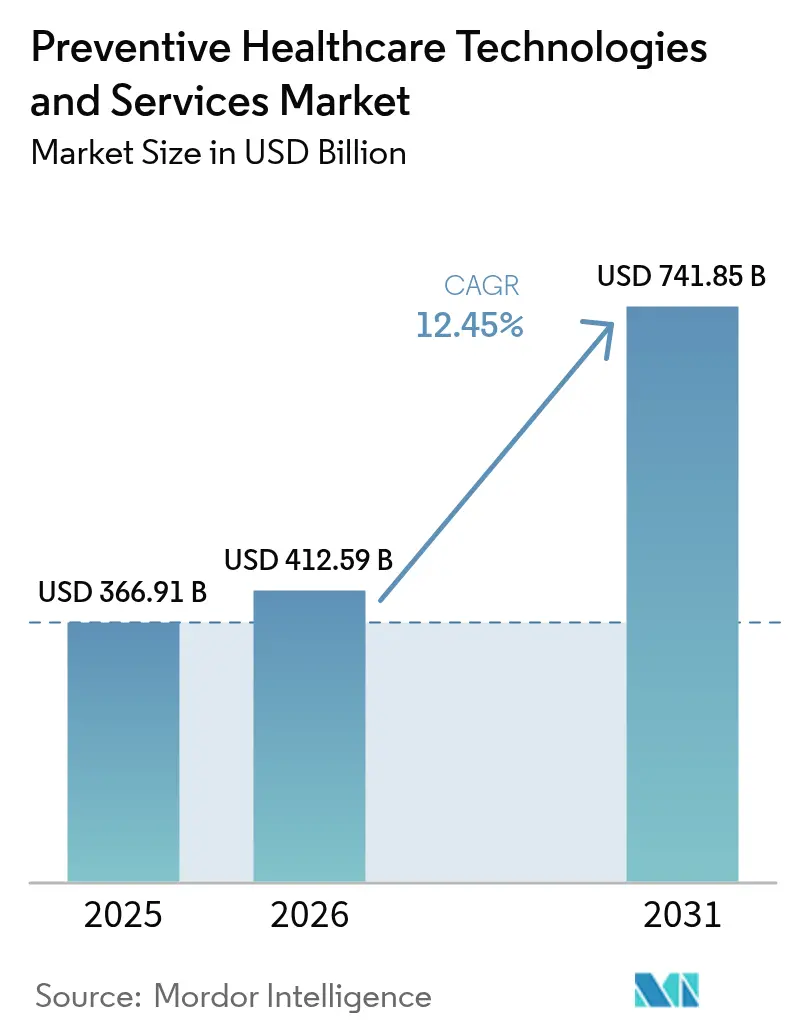
The Preventive Healthcare Technologies And Services Market size is projected to expand from USD 366.91 billion in 2025 and USD 412.59 billion in 2026 to USD 741.85 billion by 2031, registering a CAGR of 12.45% between 2026 to 2031.
Increasing claims costs, employer-driven demand for healthier workforces, and growing consumer interest in at-home screening tools are driving a shift in healthcare spending from episodic sick-care to upstream prevention. Public payers are now reimbursing virtual check-ins and remote monitoring codes at parity with in-person visits, incentivizing providers to incorporate screenings and digital coaching into primary-care workflows. Concurrently, advancements in sensor miniaturization and battery technology have expanded the availability of consumer-grade devices that meet clinical-grade accuracy standards. This development is bolstering hardware sales while generating data streams for subscription-based services. In Asia and North America, governments are aligning a larger portion of incentive payments with quality metrics rather than service volume, rewarding organizations that can demonstrate measurable outcomes such as reduced hospital admissions or lower medication expenditures.
Key Report Takeaways
- By product & Services, the product captured 64.92% of the preventive health technologies and services market share in 2025. Services are projected to expand at a 14.76% CAGR through 2031, outpacing hardware growth by 230 basis points.
- By delivery mode, remote and virtual channels are forecast to grow at 14.89%, while in-person modes are forecast to grow at only 7.56% over the same horizon.
- By end user, healthcare providers accounted for 38.21% of 2025 spending, yet the individuals segment is expected to record the fastest growth at a 15.45% CAGR through 2031.
- By geography, North America led with 41.87% revenue in 2025; Asia-Pacific is set to register the fastest regional CAGR of 13.65% through 2031.
Note: Market size and forecast figures in this report are generated using Mordor Intelligence’s proprietary estimation framework, updated with the latest available data and insights as of 2026.
Global Preventive Healthcare Technologies And Services Market Trends and Insights
Drivers Impact Analysis*
| Driver | (~) % Impact on CAGR Forecast | Geographic Relevance | Impact Timeline |
|---|---|---|---|
| Growing Burden of Chronic Diseases | +3.2% | Global, with acute pressure in North America, Europe, and urban Asia-Pacific | Long term (≥ 4 years) |
| Expansion of Government-Supported Preventive Health Programs | +2.8% | Asia-Pacific core (China, India), spill-over to Southeast Asia and Latin America | Medium term (2-4 years) |
| Rising Consumer Adoption of Connected Health Devices | +2.5% | North America and Europe lead; Asia-Pacific accelerating in Japan, South Korea, Australia | Medium term (2-4 years) |
| Shift Toward Value-Based and Outcome-Driven Care Models | +1.9% | North America (Medicare Advantage), Europe (selective markets: Germany, Netherlands) | Long term (≥ 4 years) |
| Advancements in Artificial Intelligence and Predictive Analytics | +1.6% | Global, with early commercial traction in North America and select European markets | Long term (≥ 4 years) |
| Increasing Employer and Insurer Focus on Wellness Cost Containment | +1.3% | North America, with emerging adoption in GCC and Australia | Short term (≤ 2 years) |
| Source: Mordor Intelligence | |||
Growing Burden of Chronic Diseases
Chronic conditions account for 74% of global deaths and 86% of health-care spending in high-income countries, yet prevention programs still command less than 3% of budgets. Modeling by the CDC shows that eliminating tobacco, improving diet, and boosting activity could avert 80% of cardiovascular disease and type 2 diabetes, saving USD 1.3 trillion annually in the United States alone. Employers have reacted; 68% of U.S. companies with more than 500 workers included biometric screenings in their 2025 benefit menus, up from 52% in 2023[1]National Business Group on Health, “2025 Large Employers Health Care Strategy Survey,” businessgrouphealth.org . Device makers are capitalizing: Dexcom shipped 1.8 million continuous glucose monitors in Q4 2025, a 42% year-over-year jump. Managing pre-diabetes through digital lifestyle coaching costs about USD 400 per member each year, versus USD 9,600 for treating advanced diabetes with complications.
Expansion of Government-Supported Preventive Health Programs
China’s Healthy China 2030 blueprint earmarked CNY 1.2 trillion (USD 165 billion) in 2025 to build 50,000 community centers featuring AI-enabled screening kiosks. India’s Ayushman Bharat Digital Mission added 340 million digital health IDs by December 2025, linking lab results and vaccination records for longitudinal risk tracking. Japan extended its Specific Health Checkup mandate to every employee aged 40-74, with non-compliant firms facing reduced insurance subsidies. These policies spur device demand; Omron’s Asia-Pacific revenue from blood pressure monitors climbed 37% in fiscal 2025, driven by government procurement contracts. Regulatory requirements such as China’s NMPA clearance or ISO 13485 accreditation are now prerequisites for public tenders.
Rising Consumer Adoption of Connected Health Devices
Apple shipped 58 million Apple Watches in 2025, and 64% of buyers cited health monitoring as the top purchase driver. Garmin’s wearable division grew 29% year over year, propelled by the Venu 3 with continuous heart rate variability tracking. Dexcom’s over-the-counter Stelo glucose sensor generated USD 180 million in sales over the first nine months of 2025, charging consumers USD 89 per month for metabolic insights. South Korea subsidized wearables for 1.2 million seniors under its Digital Healthcare Promotion Act in 2025, aiming to reduce emergency visits by 15%. Medicare now reimburses remote patient-monitoring codes for 18 chronic diseases, embedding sensor streams into standard care pathways.
Advancements in Artificial Intelligence and Predictive Analytics
Optum’s predictive algorithms flagged 2.3 million UnitedHealth members at heightened risk of heart failure in 2025, reducing admissions by 18% and saving USD 420 million. Alphabets Verily launched a platform that merges EHR, genomic, and wearable data to calculate 10-year cardiovascular risk; Kaiser Permanente is piloting the solution among 4.2 million Californians. Philips secured rapid FDA and CE clearances for an AI chest X-ray tool that detects early lung nodules with 94% sensitivity. China’s Ping A Good Doctor triaged 890 million consultations in 2025, automating 73% of cases to self-care protocols. Patent activity underscores future pipelines: Johnson & Johnson filed 47 U.S. patents on AI-driven preventive diagnostics in 2024-2025.
Restraints Impact Analysis*
| Restraint | (~) % Impact on CAGR Forecast | Geographic Relevance | Impact Timeline |
|---|---|---|---|
| Data Privacy and Cybersecurity Concerns | -1.8% | Global, with acute regulatory pressure in Europe (GDPR) and North America (HIPAA, state laws) | Short term (≤ 2 years) |
| Reimbursement Limitations for Preventive Services | -1.5% | North America and Europe, where payers demand long-term outcome data | Medium term (2-4 years) |
| Limited Digital Literacy and Health Equity Gaps | -1.1% | Rural and underserved regions globally, pronounced in Latin America, Sub-Saharan Africa, and rural Asia | Long term (≥ 4 years) |
| Regulatory and Interoperability Challenges | -0.9% | Global, with fragmentation highest in Europe and emerging markets | Medium term (2-4 years) |
| Source: Mordor Intelligence | |||
Data Privacy and Cybersecurity Concerns
The 23andMe credential-stuffing breach in October 2024 exposed genetic data for 6.9 million users, culminating in a USD 30 million settlement and FTC-mandated biennial security audits[2]Federal Trade Commission, “23andMe Data Breach Settlement,” ftc.gov . California’s Delete Act, effective January 2025, now forces health apps to offer one-click data deletion and bans biometric data sales without explicit opt-in. Europe’s AI Act, ratified in May 2024, classifies health-risk algorithms as high-risk, triggering mandatory conformity assessments that can add 18 months to a launch schedule. Teladoc spent USD 47 million on HIPAA and GDPR compliance in 2025, equal to 3.2% of revenue, highlighting cost burdens for smaller innovators. A Digital Medicine Society survey found 41% of start-ups delayed releases in 2025 amid uncertainty over data-residency rules.
Reimbursement Limitations for Preventive Services
Medicare covers 18 preventive services without cost-sharing, but digital therapeutics and lifestyle coaching are typically excluded from fee schedules because CMS requires 24-month randomized trials to demonstrate lasting behavior change. Virta Health disclosed that only 22% of its 2025 revenue flowed through insurers; most payments came directly from employers or consumers. The AMA reported in 2025 that fewer than 30% of private plans reimburse pre-diabetes remote monitoring due to limited long-term claims data[3]American Medical Association, “Digital Therapeutics Coverage Analysis 2025,” ama-assn.org. Continuous glucose monitors secured Medicare coverage in 2024, yet coaching services interpreting those data still lack dedicated billing codes, forcing providers to absorb costs or bundle them into office visits. Johnson & Johnson therefore bypassed payers altogether, paying Liva Healthcare USD 12 million in 2025 to coach 85,000 staff directly.
*Our forecasts treat driver/restraint impacts as directional, not additive. The impact forecasts reflect baseline growth, mix effects, and variable interactions.
Segment Analysis
By Product & Services: Hardware Dominance Masks Faster Service Growth
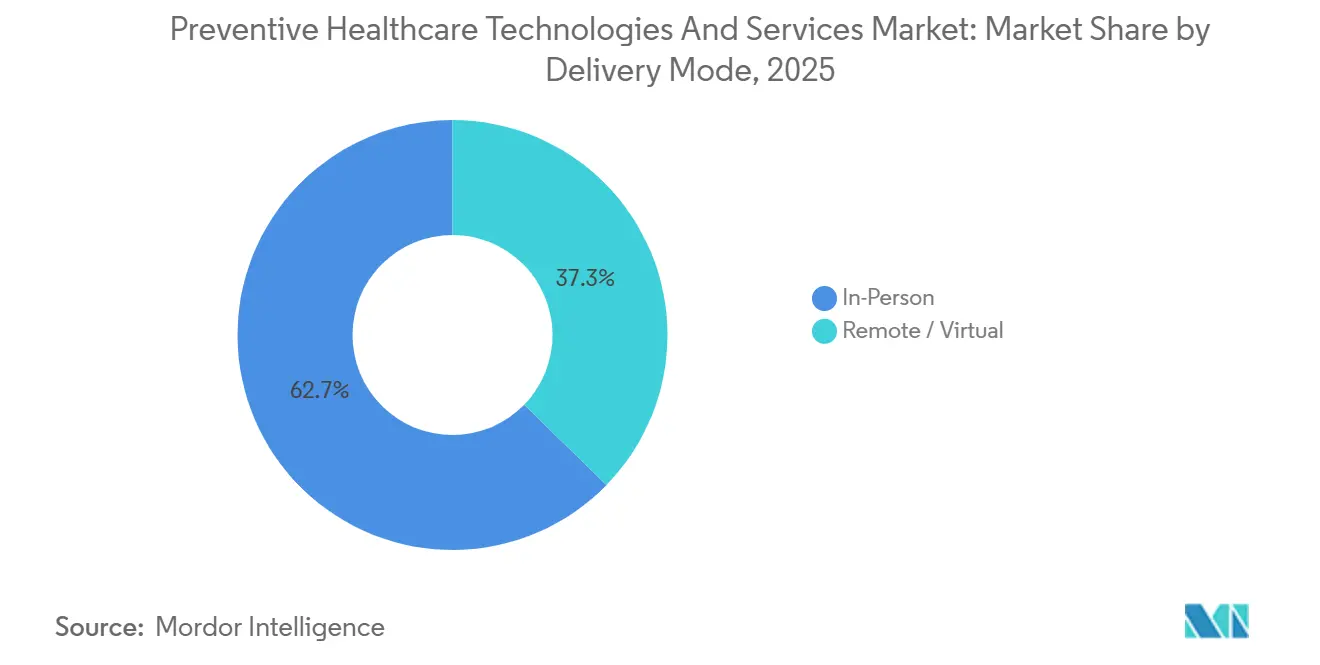
Products captured 64.92% of the Preventive Health Technologies and Services market share in 2025, driven by screening devices, wearables, genetic testing kits, and mobile apps. Wearable trackers alone generated USD 95 billion in global revenue that year, with Apple, Garmin, and Samsung controlling 68% of shipments. Genetic kits contributed USD 8.2 billion, though momentum slowed after the 2024 privacy breach. Screening staples such as Abbott’s FreeStyle Libre added USD 5.3 billion, reinforcing the importance of the hardware’s baseline.
Services are projected to grow 14.76% annually through 2031, nearly double the pace of hardware, as payers seek documented ROI from behavior-change platforms. Tele-preventive visits on Teladoc reached 18.4 million in 2025, up 31% year on year. Corporate wellness strategies now focus on personalized coaching; Optum’s Rally program cut high-cost claimants 12% over three years, justifying USD 150 per employee subscription fees. Disease-management hotlines and remote monitoring remain the largest service bucket, with ResMed’s AirView connecting 7.2 million sleep-apnea patients worldwide in 2025.



By Delivery Mode: Virtual Channels Gain Reimbursement Parity
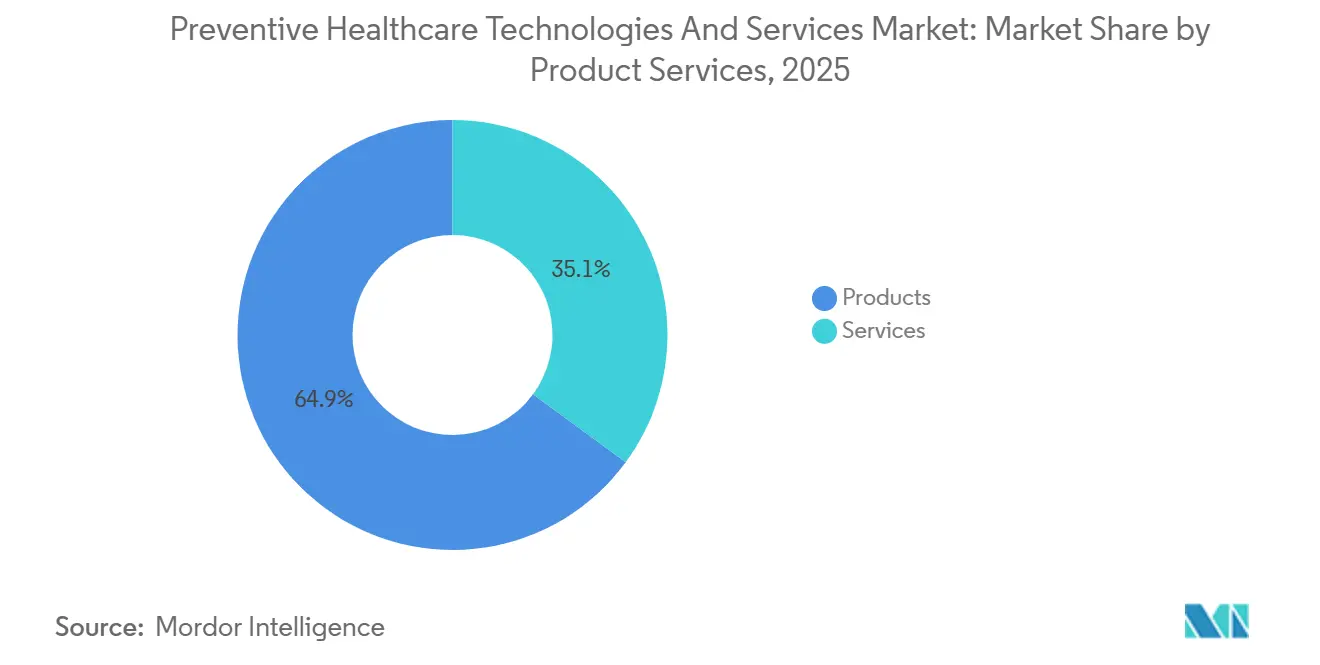
Remote and virtual models are expected to climb at a 14.89% CAGR to 2031, thanks to 23 U.S. states enacting parity laws and CMS cementing telehealth flexibilities. In-person encounters still comprised 62.71% of 2025 revenue because vaccinations, blood draws, and imaging require physical presence. Medicare beneficiaries alone booked 42 million annual wellness visits at bricks-and-mortar clinics during 2025.
Growth tilts toward digital. Hims & Hers logged USD 1.5 billion in revenue in 2025, with 78% of consults handled asynchronously. Teladoc’s preventive portfolio rose 35%, driven by employer contracts embedding virtual coaching at no extra member cost. Hybrid programs such as Omada Health blend app-based coaching with periodic group sessions and reported an average 9.2% weight loss at 12 months in a 2024 peer-reviewed study.
By End User: Individuals Drive the Fastest Growth Through DTC Models
Providers consumed 38.21% of 2025 expenditure, purchasing AI-powered diagnostics and EHR integrations to meet value-based metrics. Philips shipped its AI chest X-ray software to 1,200 radiology departments, producing USD 340 million in segment revenue that year. Insurers followed, with Optum allocating USD 2.1 billion on preventive platforms.
Individuals are projected to grow at 15.45% per year through 2031, accelerating the overall Preventive Health Technologies and Services market. Apple Watch adoption surged as ECG and blood-oxygen apps won FDA clearances, and 64% of 2025 purchasers identified health tracking as their leading rationale. Dexcom’s Stelo enrolled 420,000 direct subscribers at a monthly rate of USD 89 by December 2025. Employer-funded “wellness wallets” further empower consumers; 34% of U.S. firms supplied USD 500–1,500 stipends in 2025 for staff to buy preventive services.
Geography Analysis
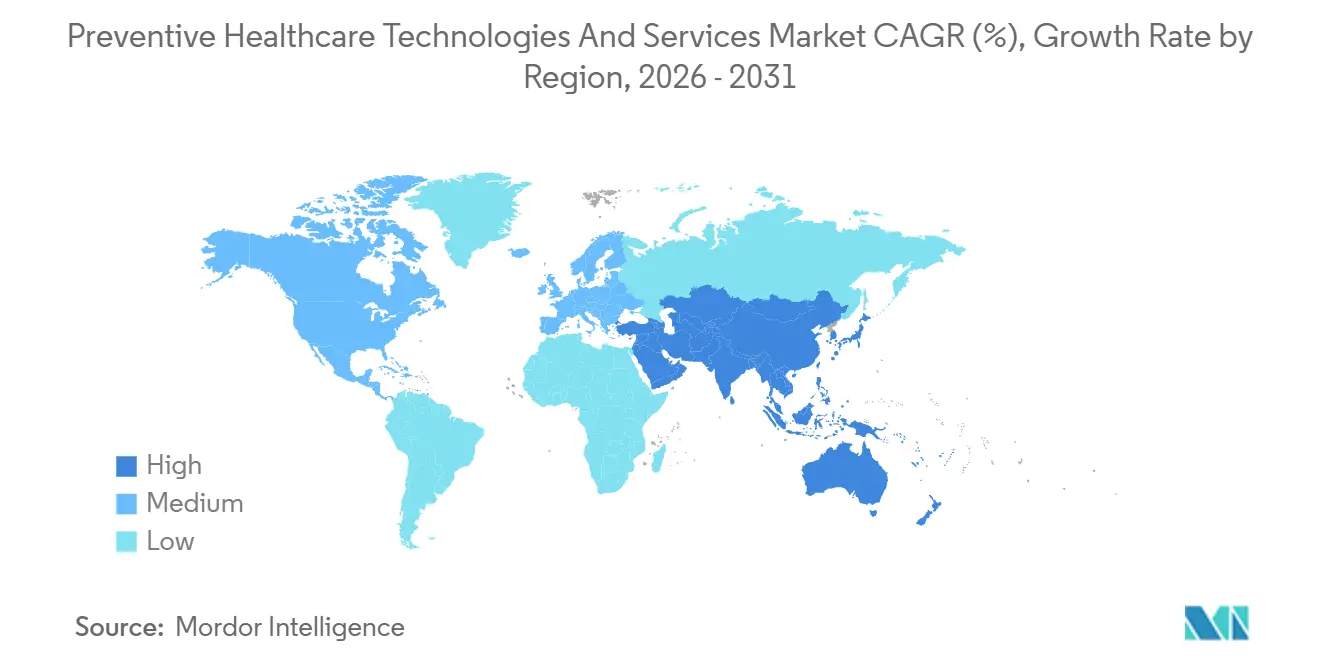
North America accounted for 41.87% of global Preventive Health Technologies and Services revenue in 2025, supported by Medicare Advantage contracts that tie 85% of insurer payments to quality benchmarks. Canada injected CAD 1.8 billion (USD 1.3 billion) into digital-health budgets, opening virtual-first clinics in Ontario and British Columbia. Mexico’s INSABI program brought 12 million citizens under a preventive-care safety net in 2025, though patchy broadband hampers rural reach. Employer wellness prevalence—68% among large U.S. businesses—maintains demand for devices and coaching.
Asia-Pacific is projected to register a 13.65% CAGR, the quickest regional pace through 2031. China’s Healthy China 2030 plan alone earmarked USD 165 billion for preventive infrastructure in 2025. India’s Ayushman Bharat Digital Mission onboarded 340 million citizens to digital IDs by end-2025, laying data rails for longitudinal risk analytics. Japan mandates annual metabolic screenings for workers ages 40-74, driving sales of Omron monitors. South Korea subsidized 1.2 million senior wearables; Australia added glucose sensors to its Pharmaceutical Benefits Scheme in 2024, covering 1.8 million patients.
Europe generated roughly 23% of market revenue in 2025, but growth has slowed due to reimbursement fragmentation. Germany’s Digital Healthcare Act funds app prescriptions, yet only 58 therapeutics had codes by mid-2025. The U.K. NHS enrolled 680,000 people in its Diabetes Prevention Programme that same year. France reimbursed 4.2 million virtual preventive visits in 2025, up 67% year on year. Italy and Spain lag behind in remote monitoring, with less than 15% of practices using it.
The Middle East and Africa accounted for about 6% of 2025 sales, driven by Saudi Arabia’s SAR 45 billion (USD 12 billion) in digital health spending under Vision 2030. South Africa’s private insurers launched incentive programs rewarding screenings with premium discounts. South America clocks in near 5%: Brazil piloted telemedicine chronic-care hubs in 500 municipalities, and Argentina’s insurers started reimbursing glucose sensors for type 1 diabetes.

Regulatory Landscape
Regulation for preventive healthcare technologies and services is tightening around software as a medical device, AI-enabled clinical decision support, and privacy-by-design requirements for consumer and provider-facing platforms. In May 2024, the European Union ratified the AI Act, classifying many health-risk algorithms as high-risk and adding conformity-assessment and documentation obligations that can lengthen time-to-market for preventive AI tools used in screening and risk stratification.
In the United States, the FDA expanded its Digital Health Center of Excellence guidance portfolio, and in January 2026 issued final guidance for Clinical Decision Support Software, clarifying when CDS functions fall under device oversight. At the global level, the World Health Assembly endorsed extending the WHO Global Strategy on Digital Health through 2027 (May 2025), reinforcing national focus on interoperable digital public infrastructure and governance for cross-setting preventive care data flows.
Value Chain Analysis
The value chain spans upstream component and test-input suppliers (sensors, optics, reagents, cartridges, cloud infrastructure) through device and kit OEMs, app and platform developers, AI analytics layers, and clinical workflow and payer integrations that operationalize prevention in primary care and employer or insurer programs. Distribution generally splits between consumer retail and direct-to-consumer subscriptions (wearables, at-home screening, genetics) and institutional purchasing and reimbursement-led channels (providers, payers, government programs). Post-market activities focus on data governance, cybersecurity, and ongoing algorithm and software maintenance.
Bottlenecks increasingly arise midstream at interoperability and compliance handoffs, where inconsistent data formats, consent management, and security requirements drive custom integrations before device outputs become EHR- and claims-compatible. That dynamic lifts the role of integrators and platforms that normalize data and map it into clinical pathways, while also raising switching costs for employers, payers, and providers that embed remote monitoring and coaching into care models and quality metrics.
Competitive Landscape
Competition is moderate, with the top 10 companies controlling about 35% of 2025 revenue. Apple, Abbott, Dexcom, Teladoc, UnitedHealth, Philips, Johnson & Johnson, Roche, Illumina, and 23andMe anchor the leaderboard. Apple and Alphabet favor horizontal ecosystems, embedding health sensors into ubiquitous devices and unifying data across apps. UnitedHealth exploits its claims database to target high-risk members, reporting USD 420 million in 2025 savings from predictive outreach. Abbott and Dexcom duel on sensor accuracy; Abbott’s FreeStyle Libre 3 lasts 14 days, while Dexcom’s G7 eliminates calibrations.
White-space niches abound. Only 5% of primary-care doctors feel comfortable interpreting polygenic risk scores, leaving room for genetic counselors. Fewer than 30% of pre-diabetes patients currently receive structured coaching, a USD 18 billion untapped segment. Virta Health posted a 61% two-year remission rate for type 2 diabetes via ketogenic coaching, while Hims & Hers grew 89% through asynchronous telemedicine. Regulatory costs present barriers; Teladoc’s USD 47 million compliance tab in 2025 highlights the advantage of scale.
Preventive Healthcare Technologies And Services Industry Leaders
Myriad Genetics
Abbott Laboratories
GSK plc
Omron Healthcare Co., Ltd.
Medtronic plc
- *Disclaimer: Major Players sorted in no particular order

Market Opportunities and Future Outlook
Large rounds in 2026 point to active whitespace in consumer-facing preventive diagnostics and continuous monitoring platforms that combine proprietary hardware, longitudinal data capture, and subscription services. Neko Healths July 2026 Series C financing supports expansion of body-scanning clinics and its health data platform into the United States. WHOOPs March 2026 raise targets expansion of an AI-driven biometric platform, reinforcing momentum for integrated prevention offerings that blend devices, analytics, and ongoing engagement.
Government programs and official strategies are also creating openings tied to interoperable data infrastructure and validated AI in prevention workflows. The WHO Global Strategy on Digital Health was extended through 2027 (endorsed May 2025), and the US HHS finalized the 2024-2030 Federal Health IT Strategy, which emphasizes person-centered access and secure exchange of health information, supporting preventive use cases that require data portability across apps, providers, and payers. In Europe, Germanys 2026 digitalization strategy commits to scaling research activity via a Health Data Lab, underpinning demand for privacy-preserving analytics, consent management, and clinical-grade validation pathways for early warning systems and digital twins.
Recent Industry Developments
- June 2026: Myriad Genetics expanded the commercial availability of its Precise MRD test to patients undergoing treatment and surveillance for breast, colorectal, and renal cancers. Broadening access for monitoring and recurrence detection pushes molecular testing deeper into prevention-adjacent surveillance workflows and increases demand for downstream analytics and care navigation services.
- February 2026: AQP ONE Inc. launched JBA AICare, a physiological intelligence system aimed at earlier and more continuous health understanding. The launch underscores continued productization of continuous monitoring and insights as consumer-facing prevention tools, reinforcing the hardware-plus-subscription model across the category.
- May 2024: The European Union ratified the AI Act, introducing a high-risk framework for many health-related AI systems. This increased the emphasis on conformity assessments, documentation, and post-market governance for preventive screening and risk algorithms, influencing vendor roadmaps and procurement requirements across Europe.


Research Methodology Framework and Report Scope
Market Definition and Coverage
This market covers revenue generated from technologies and services that help prevent disease or detect health risks early, before advanced treatment is needed. It includes tools, programs, and clinical or non-clinical services used by individuals, employers, payers, and care providers.
Scope exclusions: We exclude purely curative acute-care treatment episodes that start after diagnosis, along with unrelated hospital infrastructure and general-purpose IT that is not used for prevention workflows.
Segmentation Overview
- By Product & Services
- Products
- Screening & Diagnostic Devices
- Wearable Health Trackers
- Genetic-Testing Kits
- Mobile Health Apps
- Vaccination Platforms
- Services
- Health-Risk Assessment
- Corporate Wellness Programs
- Lifestyle Coaching
- Disease-Management Services
- Tele-Preventive Consultations
- Products
- By Delivery Mode
- In-Person
- Remote / Virtual
- By End User
- Healthcare Providers
- Employers
- Payers & Insurers
- Individuals
- Government / Public-Health Agencies
- Geography
- North America
- United States
- Canada
- Mexico
- Europe
- Germany
- United Kingdom
- France
- Italy
- Spain
- Rest of Europe
- Asia-Pacific
- China
- Japan
- India
- Australia
- South Korea
- Rest of Asia-Pacific
- Middle East & Africa
- GCC
- South Africa
- Rest of Middle East & Africa
- South America
- Brazil
- Argentina
- Rest of South America
- North America
Data Sources, Market Sizing, and Validation
Desk Research
Desk research starts by mapping what is counted as prevention spending, and what is excluded, so revenue is not double-counted across programs and tools. We referenced public health and utilization statistics from sources such as the CDC, the World Health Organization, the OECD health data portal, and the World Bank, which help anchor screening uptake, chronic disease burden, and care access levels.
To convert demand signals into market value, we used payer and provider context from sources such as CMS publications, national health ministry dashboards, and peer-reviewed articles on preventive care outcomes and participation. Company annual reports, investor decks, and reputable press were used to understand product mix and pricing direction, including device plus subscription models. In a few places, paid databases were used for company financial intelligence, patent lookups, and shipment level trade signals that are hard to piece together consistently from free sources. These sources are illustrative only, and many other public and paid references were used for data collection, validation, and clarification during the study.
Primary Interviews and Surveys
Primary interviews were used to test how prevention is framed in buying decisions, and to close gaps that desk sources cannot answer cleanly, for example bundled pricing and who pays for what. We spoke with a mix of device and platform suppliers, preventive service providers, channel partners, employer benefit stakeholders, and healthcare delivery leaders across major regions. The inputs were then used to confirm penetration assumptions and realistic price bands.
Distribution of primary research fieldwork respondents
| Company type | Respondent position | Region |
|---|---|---|
| Top tier: 25% | CXOs: 18% | APAC: 39% |
| Mid tier: 56% | Functional/Unit leaders: 25% | EMEA: 34% |
| Smaller Players: 19% | Managers: 57% | Americas: 27% |
Market-Sizing & Forecasting
For sizing, the core model uses a top-down build that reconstructs the spend pool from preventive care participation and coverage signals, and then applies realistic unit economics by technology and service type. In practice, we start from region level population and risk cohorts, layer in screening and vaccination utilization, and then map spend per participant using observed price ranges from payers, providers, and employers.
To keep results grounded, the totals are corroborated with selective bottom-up checks, such as roll ups of sampled supplier revenues, channel checks on program volumes, and ASP times user counts for widely adopted tools. Key variables used as inputs include preventive screening rates, vaccination coverage, chronic disease prevalence trends, employer wellness program adoption, reimbursement and out of pocket mix, and price progression for subscription based services. Where bottom-up evidence is incomplete for smaller private operators, gaps are handled through conservatively scaled benchmarks tied to workforce size, served lives, and typical contract ranges.
Forecasting uses scenario analysis supported by simple multivariate relationships, where adoption and pricing are linked to coverage expansion, policy direction, and provider capacity to run preventive programs. Assumptions are reviewed with interview feedback so the forward curve reflects what buyers and delivery organizations believe is feasible, rather than a straight line extension of past growth.
Data Validation & Update Cycle
Validation is handled in multiple passes so unusual spikes do not slip through. We compare model outputs against independent signals such as utilization trends, public health coverage indicators, and disclosed revenue direction from a set of tracked participants, and then investigate large variances before numbers are finalized.
Checks are repeated at regional and global levels so currency conversion timing, inflation assumptions, and mix shifts do not create hidden distortions. If a new regulation, reimbursement change, or a major program rollout alters adoption expectations, experts are re-contacted and assumptions are adjusted. Reports are refreshed annually, with interim updates for material events, and a final pre-delivery review is completed so clients receive the most current view available at the time of publication.
Mordor Intelligence's Preventive Healthcare Technologies and Services Market Sizing Compared With Other Published Estimates
Published estimates for this market can differ because prevention is a wide term, and sources do not always count the same spending lines. Differences usually come from what is included as a preventive service, how digital tools are treated (one time device sale versus recurring service revenue), and which year and currency conversion method is used.
The largest gaps typically show up around adjacent categories, such as disease management programs that sit between prevention and treatment, and broad digital health platforms that support many workflows beyond prevention. Some estimates also apply aggressive uptake assumptions for employer programs and consumer subscriptions, even when reimbursement and provider capacity signals do not support that speed in every region.
Benchmark comparison
| Source | Market Size | Gaps in Research Methodology |
|---|---|---|
| Mordor Intelligence | USD 366.91 B (2025) | |
| Trade Journal A | USD 296.47 B (2024) | Uses an earlier base year and appears to apply a narrower counted spend pool, which can happen when employer funded prevention and certain recurring digital service revenues are not fully captured. |
| Industry Media B | USD 336.17 B (2025) | May include a broader mix of wellness and health management programs under prevention, and the pricing curve can shift depending on whether subscriptions are annualized consistently across regions. |
Screening and vaccination uptake data, along with payer coverage direction and disclosed program participation, are the checks that keep Mordor Intelligence tied to a repeatable prevention demand pool and a consistent revenue recognition logic. Looking at the table, the spread is explained mostly by base year choice and what gets counted as prevention versus adjacent health management spend, which is why clear inclusion rules and cross-checks matter for planning.


Key Questions Answered in the Report
How large will spending on preventive technologies be by 2031?
The preventive health technologies and services market is projected to reach USD 741.85 billion by 2031, expanding at a 12.45% CAGR from 2026.
Which segment is growing the fastest?
Services such as digital coaching and disease-management platforms are forecast to grow 14.76% per year through 2031, outpacing hardware sales.
Why are virtual delivery models gaining traction?
Twenty-three U.S. states now mandate payment parity for telehealth, while Medicare has made its pandemic telehealth flexibilities permanent, improving reimbursement and adoption.
Which region is expected to post the highest growth rate?
Asia-Pacific is set to record a 13.65% CAGR to 2031, fueled by large-scale public programs in China, India, Japan, and South Korea.
What keeps payers from reimbursing more preventive services?
Payers often require 24-month clinical evidence of sustained behavior change, which many digital therapeutics and coaching services have yet to provide.
How significant are data-privacy risks in this space?
High-profile breaches like 23andMe’s 2024 incident have prompted stricter regulations such as California’s Delete Act and Europe’s AI Act, raising compliance costs and launch timelines.
Page last updated on:






