Preimplantation Genetic Testing Market Size and Share
Market Overview
| Study Period | 2021 - 2030 |
|---|---|
| Forecast Data Period | 2025 - 2030 |
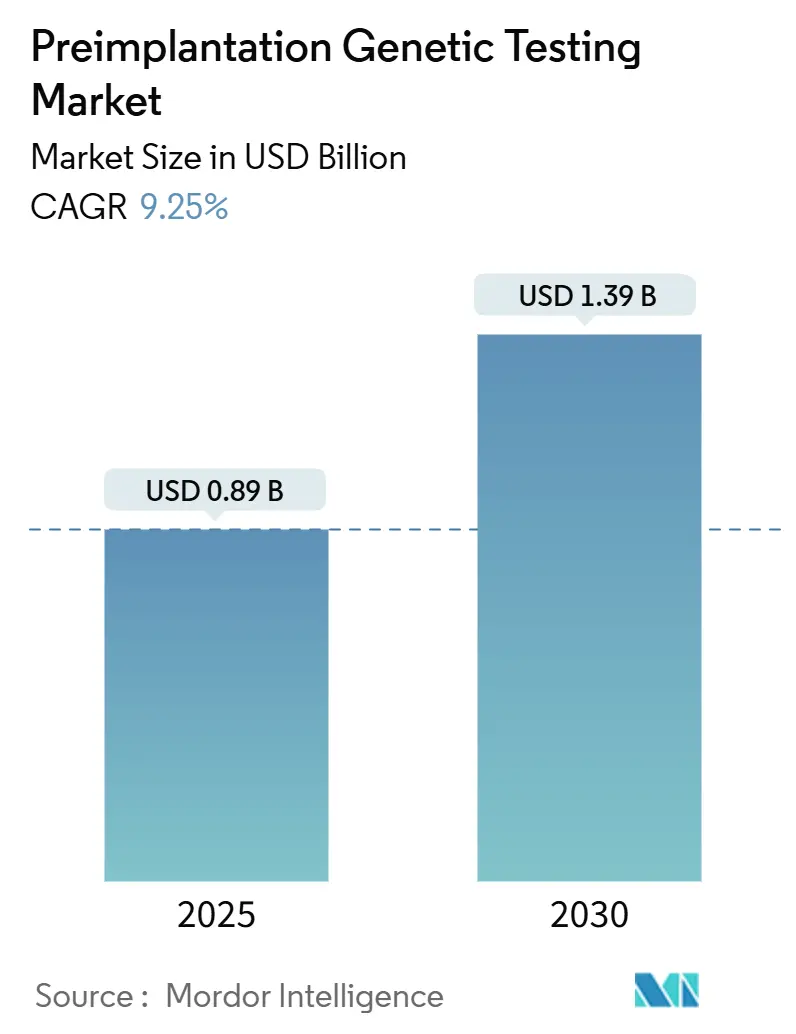
| Market Size (2025) | USD 0.89 Billion |
| Market Size (2030) | USD 1.39 Billion |
| Growth Rate (2025 - 2030) | 9.25% CAGR |
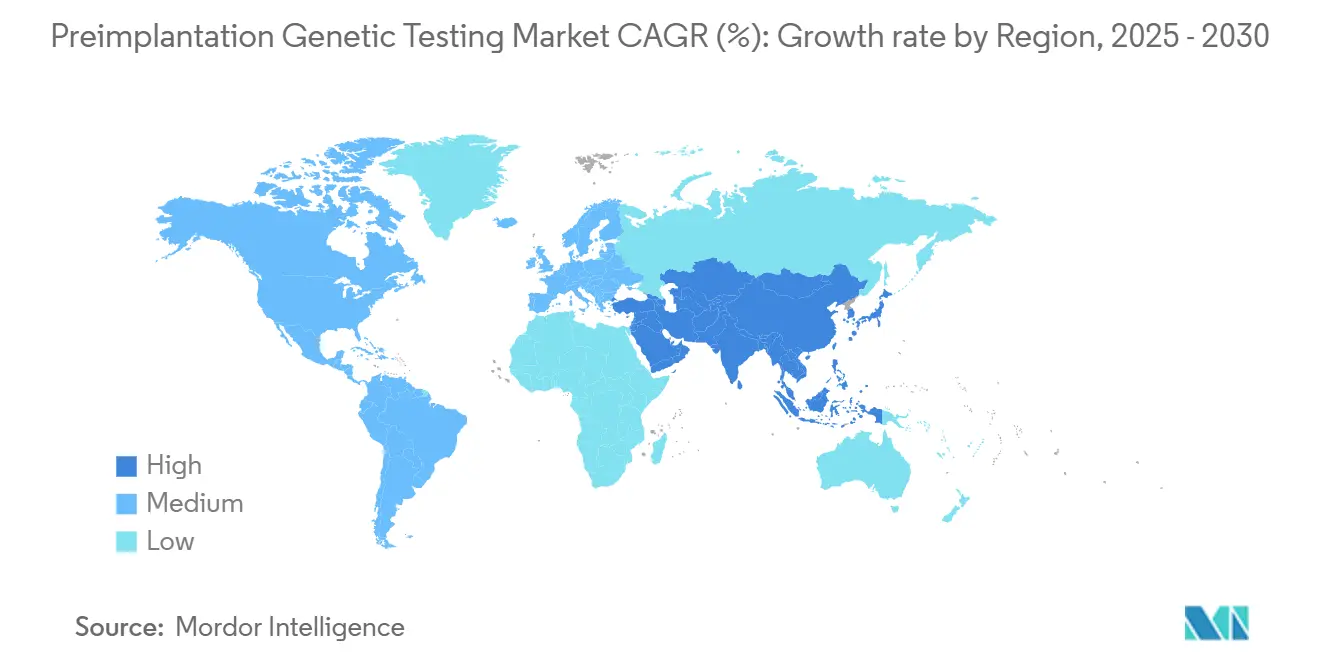
| Fastest Growing Market | Asia Pacific |
| Largest Market | North America |
Major Players *Disclaimer: Major Players sorted in no particular order Image © Mordor Intelligence. Reuse requires attribution under CC BY 4.0. | |
Preimplantation Genetic Testing Market Analysis by Mordor Intelligence
The preimplantation genetic testing market generated USD 891.58 million in 2025 and is expected to reach USD 1,387.6 million by 2030, reflecting a 9.25% CAGR during 2025-2030. Rising maternal age, rapid uptake of next-generation sequencing (NGS), and broader insurance mandates are enlarging the addressable patient pool. Artificial-intelligence tools now guide embryo prioritization with predictive accuracy approaching 88% for chromosomal normality. Non-invasive testing that captures cell-free DNA is gaining validation, lowering biopsy-related risks and accelerating clinic adoption. Meanwhile, employer-funded benefits in North America and new reimbursement codes in Europe are smoothing cost barriers. Competition is moderate; incumbents strengthen portfolios through M&A while start-ups target software-driven workflows that compress turnaround times and reduce per-test costs.
Key Report Takeaways
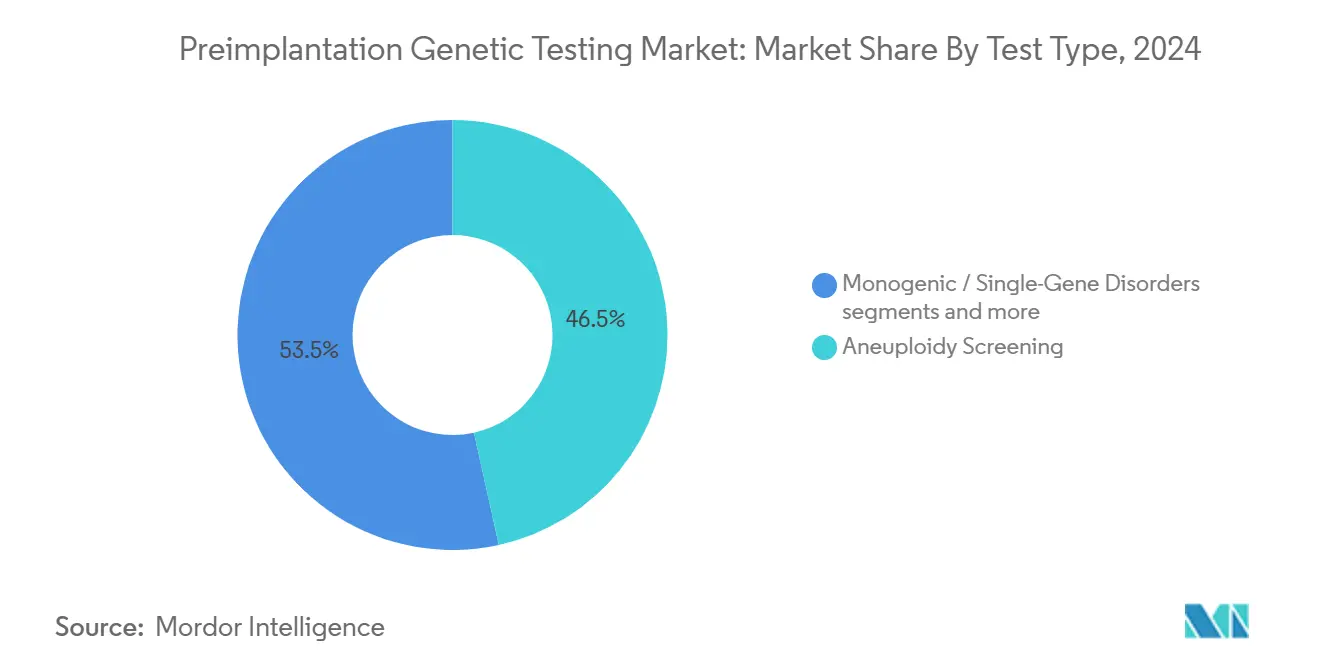
- • By test type, aneuploidy screening led with 46.54% of preimplantation genetic testing market share in 2024, while non-invasive PGT is forecast to expand at 10.35% CAGR to 2030.
- • By technology, NGS commanded 54.34% share of the preimplantation genetic testing market size in 2024; AI-assisted imaging is projected to grow at 10.93% CAGR through 2030.
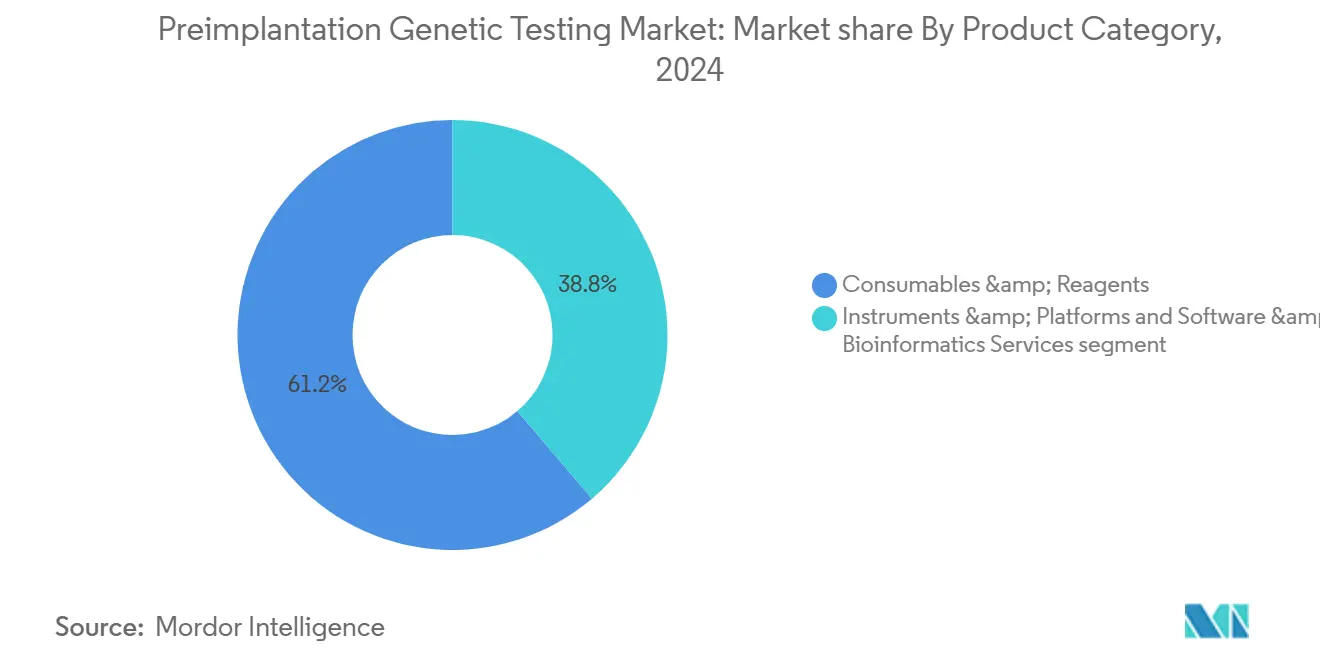
- • By product category, consumables and reagents held 61.23% revenue share in 2024; software and services represent the fastest segment with an 11.55% CAGR to 2030.
- • By end user, fertility clinics accounted for 67.34% of the preimplantation genetic testing market size in 2024 and are advancing at a 12.20% CAGR between 2025-2030.
- • By geography, North America led with 41.23% share in 2024; Asia-Pacific is the fastest-growing region at 12.89% CAGR through 2030.
Global Preimplantation Genetic Testing Market Trends and Insights
Driver Impact Analysis*
| Driver | (~) % Impact on CAGR Forecast | Geographic Relevance | Impact Timeline |
|---|---|---|---|
| Rising maternal age & infertility | +2.8% | Global, concentrated in high-income countries | Long term (≥ 4 years) |
| Rapid adoption of NGS platforms | +2.1% | North America & Europe, spreading to APAC | Medium term (2-4 years) |
| Expansion of fertility-clinic networks | +1.9% | APAC core, spill-over to MEA and Latin America | Medium term (2-4 years) |
| Non-invasive PGT using cell-free DNA | +1.6% | Global, early uptake in premium centers | Long term (≥ 4 years) |
| Employer-funded fertility benefits | +0.9% | North America & EU | Short term (≤ 2 years) |
| Source: Mordor Intelligence | |||
Rising Maternal Age & Infertility Prevalence
Chromosomal abnormality risk rises sharply after age 35, pushing demand for aneuploidy screening in the preimplantation genetic testing market. Asia-Pacific recorded significant increases in secondary infertility between 1990 and 2021, mirroring trends long observed in North America and Western Europe weekly.chinacdc.cn. Health systems now bundle genetic counseling with in-vitro fertilization (IVF) packages, positioning PGT-A as standard of care for patients with recurrent pregnancy loss. This clinical normalization creates stable, long-cycle revenue for testing laboratories and reagent suppliers. As average maternal age edges higher in emerging economies, the addressable population widens, sustaining long-term growth momentum.
Rapid Adoption of NGS-Based PGT Platforms
NGS delivers comprehensive chromosome coverage at lower per-sample cost than legacy fluorescence in situ hybridization. BGI Genomics’ DNBSEQ-G99 platform cut sequencing time to 3 hours in 2024, raising daily throughput for IVF labs news-medical.net. Simultaneous detection of aneuploidy, structural variants, and monogenic disorders on a single flow cell simplifies laboratory workflows, shortening result delivery from days to hours. Falling read costs allow clinics to offer bundled PGT panels, fostering wider patient acceptance despite persistent out-of-pocket payments. As reimbursement frameworks mature, NGS penetration is expected to deepen across mid-tier centers that previously relied on outsourced cytogenetic testing.
Expanding Global Network of Fertility Clinics & IVF Cycles
Organized clinic chains now capture nearly 40% of IVF cycles in India, up from a negligible base a decade ago. Similar franchising models are scaling rapidly in Indonesia, Vietnam, and the Gulf states. Chain ownership standardizes quality metrics, accelerates technology roll-outs, and permits volume-based reagent pricing. Government-backed medical-tourism programs in Malaysia and Thailand further enlarge the preimplantation genetic testing market by drawing cross-border patients seeking lower procedural costs. Network effects thus reinforce PGT adoption as new sites replicate proven protocols from flagship facilities.
Employer-Funded Fertility Benefits Covering PGT
Large US employers increasingly include three IVF cycles plus genetic testing within health-benefit packages. California Senate Bill 729 mandates coverage of up to three IVF cycles, including PGT, beginning in 2025. Federal employee health plans now reimburse unlimited cycles at selected centers, accelerating utilization among government workers [1]Source: United States Office of Personnel Management, “2025 FEHB IVF Coverage Expansion,” opm.gov . Similar benefit schemes are emerging in France and the Netherlands, compressing the financial barrier to PGT and stimulating near-term procedural volumes, particularly in corporate urban centers.
Restraint Impact Analysis*
| Restraint | (~) % Impact on CAGR Forecast | Geographic Relevance | Impact Timeline |
|---|---|---|---|
| Procedure & instrumentation cost barrier | -1.4% | Global, particularly acute in emerging markets | Medium term (2-4 years) |
| Ethical, religious & legal controversies | -0.8% | Regional variations, strongest in conservative markets | Long term (≥ 4 years) |
| Regulatory uncertainty for AI-driven embryo-selection algorithms | -0.6% | North America & EU primarily, expanding globally | Short term (≤ 2 years) |
| Clinical debate on discarding low-level mosaic embryos | -0.4% | Global, concentrated in advanced fertility centers | Medium term (2-4 years) |
| Source: Mordor Intelligence | |||
Procedure & Instrumentation Cost Barrier
Testing fees of USD 350-500 per embryo and IVF cycle costs above USD 24,000 in California place combined expenses beyond reach for many patients. Although consumable prices are falling, capital outlays for sequencers still deter smaller clinics. Gradual price erosion, competitive reagent sourcing, and payer mandates are expected to lift PGT penetration from today’s 5-6% of IVF cycles to about 25% by 2030. Until then, market growth in developing regions will hinge on government subsidies and tiered pricing models.
Ethical, Religious & Legal Controversies
Debate around polygenic risk score testing (PGT-P) and elective gender selection creates patchwork regulations. Singapore’s Bioethics Advisory Committee is evaluating guidelines for PGT-P, delaying commercial launch until 2026. In parts of the Middle East, religious authorities restrict embryo manipulation, limiting test scope to life-threatening conditions. Mosaic embryo transfer remains contentious; while recent studies show comparable live-birth rates to euploid embryos, consensus on reporting standards is lacking fertstertreports.org. These uncertainties temper immediate uptake in otherwise receptive markets.
*Our forecasts treat driver/restraint impacts as directional, not additive. The impact forecasts reflect baseline growth, mix effects, and variable interactions.
Segment Analysis
By Test Type: Aneuploidy Screening Sustains Volume Leadership
Aneuploidy screening accounted for 46.54% of preimplantation genetic testing market share in 2024, underscoring its role in miscarriage prevention. Demand is reinforced by rising maternal age and payer acceptance of PGT-A for repeated IVF failure. The preimplantation genetic testing market size for non-invasive PGT is projected to climb at a 10.35% CAGR to 2030, reflecting rapid clinical validation and patient preference. Adjacent segments such as monogenic disorder testing serve smaller but high-acuity cohorts, while structural rearrangement analysis addresses translocation carriers representing 2-5% of infertile couples.
Convergence toward multi-analyte assays allows labs to bundle aneuploidy, monogenic, and structural screening into one NGS run, curbing reagent overhead. Whole-genome sequencing offerings, such as GenEmbryomics’ Panacea GenomeScreen that scans 3,200 genes, illustrate the shift toward comprehensive embryo profiling. As quality metrics rise, clinics report lower cycle cancellations, bolstering revenue predictability for testing suppliers.


By Technology: NGS Dominance Meets AI-Driven Imaging Upside
NGS contributed 54.34% of 2024 revenue and remains the analytical backbone for PGT workflows. Oxford Nanopore’s PromethION 2 Integrated puts 290 Gb of throughput on a benchtop unit, enabling same-day turnaround for medium-volume labs. AI-assisted imaging ranks as the fastest-growing technology at 10.93% CAGR, offering non-invasive viability scoring that complements genetic data. Polymerase chain reaction and fluorescence in situ hybridization persist where targeted probes suffice, but their share is shrinking as reagent cost curves favor NGS.
Cross-platform convergence is gathering pace: some vendors integrate live-cell imaging outputs with genetic readouts to present composite embryo quality indices. Long-read sequencing addresses complex genomic regions that short-read platforms miss, a benefit for polygenic score calculation. As regulatory guidance for AI software matures, imaging solutions are expected to move from decision-support to fully autonomous triage tools, trimming lab workload.
By Product Category: Software Outpaces Hardware Capex
Consumables and reagents captured 61.23% of 2024 revenue due to their recurring nature in every test cycle. Yet software and bioinformatics services are expanding at 11.55% CAGR, reflecting escalating data volumes and clinician demand for interpretive dashboards. Instruments generate a stable installed base but face longer replacement cycles. Nucleus Genomics’ 2025 release enables evaluation of up to 20 embryos against 900 hereditary conditions, highlighting software’s role in scaling complex analytics.
Cloud deployment is standardizing; smaller labs can now upload raw FASTQ files for centralized analysis, circumventing on-site compute requirements. Vendor-agnostic platforms are emerging, allowing clinics to mix sequencer brands without losing workflow coherence. Service bundling—sequencing, analytics, reporting—simplifies procurement for clinics and secures long-term revenue for vendors.
By End User: Clinic Consolidation Boosts PGT Uptake
Fertility clinics controlled 67.34% of 2024 revenue and show the fastest growth at 12.20% CAGR as networks proliferate across Asia-Pacific and Latin America. Consolidated chains negotiate bulk reagent pricing and adopt uniform electronic medical records that integrate genetic reports. Hospitals represent a secondary channel, often outsourcing complex analytics but leveraging existing lab infrastructure for sample prep. Academic institutes anchor R&D, validating new methods and training embryologists who later migrate to private clinics.
As chains scale past 30-40 centers, they internalize genetic labs to protect margin and turnaround times. Instrument vendors respond with modular sequencers sized for 200-400 samples per week, matching chain throughput profiles. In parallel, national health systems in Japan and South Korea are adding fertility centers within teaching hospitals, widening access to PGT under subsidized fee schedules.
Geography Analysis
North America led with 41.23% revenue in 2024, propelled by employer coverage and state mandates that include PGT within IVF packages. The preimplantation genetic testing market size in the region is expected to stabilize at mid-single-digit growth as penetration nears saturation among privately insured couples. FDA draft guidance on AI-enabled software, issued in 2025, offers a defined pathway for algorithm validation, encouraging clinic adoption of decision-support tools[2]Source: FDA, “Marketing Submission Recommendations for AI-Enabled Device Software Functions,” fda.gov . Though growth decelerates, high average selling prices and broad test menus preserve attractive margins.
Asia-Pacific is the fastest-growing territory at 12.89% CAGR through 2030. Urbanization, delayed marriage, and pollution-related infertility bolster cycle volumes. India alone opens more than 60 new IVF centers annually, while China’s three-child policy fuels government incentives for assisted reproduction. Local champions like BGI Genomics supply cost-optimized NGS kits, closing the affordability gap and expanding the preimplantation genetic testing market. Rising medical tourism to Thailand and Malaysia further diversifies demand as international patients seek competitively priced comprehensive testing.
Europe offers steady mid-single-digit growth underpinned by cross-border reproductive care. Harmonized EU device regulations simplify sequencer imports and software certification. Clinics in Prague, Barcelona, and Athens attract patients from higher-cost Northern Europe, raising utilization of bundled PGT packages that include aneuploidy and monogenic panels. Public health insurers in France and Germany cover defined indications such as recurrent miscarriage, ensuring baseline demand. Ethical oversight remains stringent, moderating uptake of polygenic testing until formal guidance is issued.

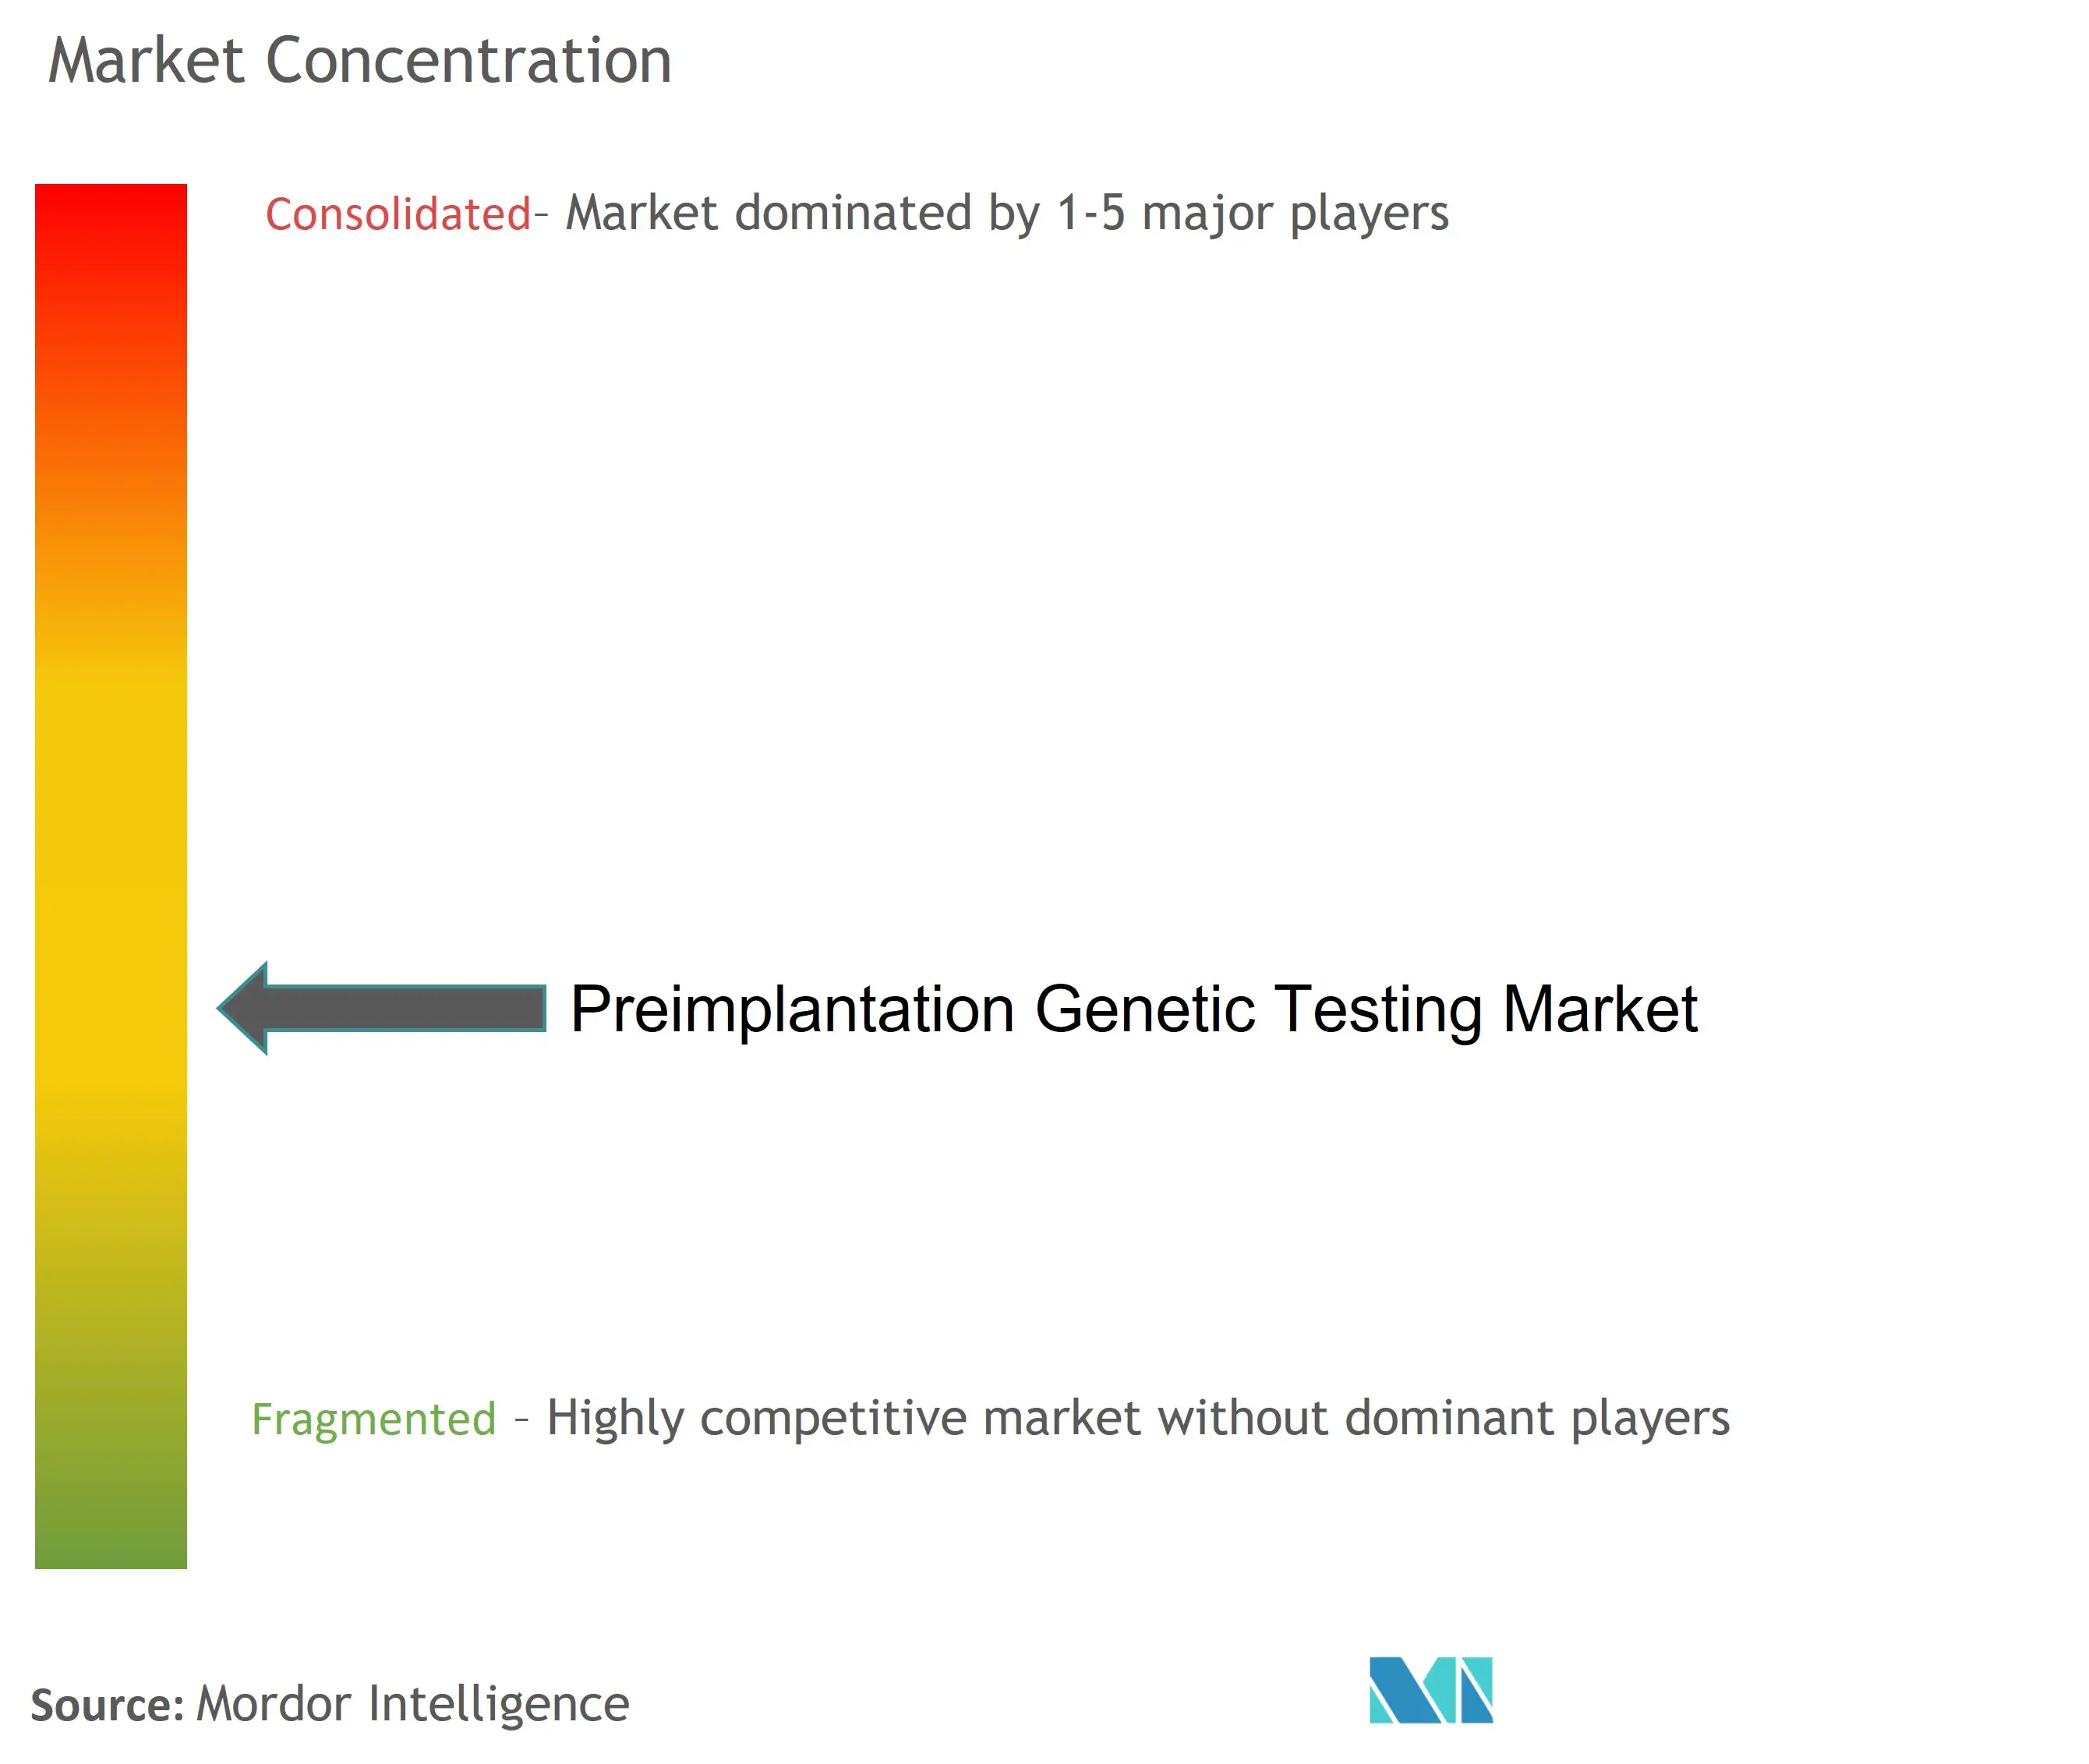
Competitive Landscape
The preimplantation genetic testing market remains moderately concentrated. The top five suppliers control an estimated 60-65% combined revenue, while dozens of regional laboratories compete on turnaround time and localized support. Illumina divested GRAIL in 2024 but continues to dominate sequencing hardware and reagents. Its 2025 alliance with Tempus AI extends analytics into reproductive genomics, offering end-to-end solutions from sample prep to embryo grading
CooperSurgical’s USD 875 million purchase of Cook Medical’s reproductive health division bolsters disposables and catheter ranges, enabling bundled sales to chain clinics. Natera posted USD 1.7 billion in 2024 revenue, up 56%, underlining the scale advantage of high-volume labs. Oxford Nanopore pivots toward desktop sequencers tailored for fertility labs, challenging incumbent short-read technologies.
Emerging players focus on software. GeneDx’s 2025 acquisition of Fabric Genomics brings AI-powered variant interpretation that feeds neonatal and embryo testing pipelines genedx.com. Nucleus Genomics targets embryo optimization analytics, while Genomic Prediction refines polygenic risk algorithms aimed at premium IVF centers. Partnerships between hardware suppliers and bioinformatics start-ups are expected to accelerate as clinics demand integrated, regulatory-cleared solutions.
Preimplantation Genetic Testing Industry Leaders
Illumina Inc
Thermo Fisher Scientific Inc
PerkinElmer Inc
Bioarray S L
Cooper Surgical
- *Disclaimer: Major Players sorted in no particular order

Recent Industry Developments
- June 2025: Nucleus Genomics launched Nucleus Embryo software in partnership with Genomic Prediction, covering 900 hereditary conditions
- June 2025: CooperSurgical finalized the USD 875 million acquisition of Cook Medical’s
- April 2025: GeneDx acquired Fabric Genomics for up to USD 51 million to enable decentralized, AI-powered genomic testing globally.


Research Methodology Framework and Report Scope
Market Definitions and Key Coverage
We define the preimplantation genetic testing (PGT) market as every laboratory workflow, reagent, instrument, and associated software service that screens or diagnoses embryo or oocyte genetic content before uterine transfer within an in-vitro-fertilization cycle. The study follows the clinical coding used by major fertility societies; therefore, PGT-A, PGT-M, PGT-SR, and emerging non-invasive imaging platforms are all in scope, whereas prenatal, carrier, or newborn genetic tests are not [mordorintelligence.com].
Scope Exclusions: Procedures performed after embryo transfer or during pregnancy, plus direct-to-consumer ancestry tests, are excluded.
Segmentation Overview
- By Test Type
- Aneuploidy Screening
- Monogenic / Single-Gene Disorders
- Structural Rearrangements
- By Technology
- Next-Generation Sequencing (NGS)
- Polymerase Chain Reaction (PCR)
- Fluorescence In-Situ Hybridization (FISH)
- Comparative Genomic Hybridization / Microarray
- AI-assisted Image-based & Non-Invasive Platforms
- By Product & Service
- Consumables & Reagents
- Instruments & Platforms
- Software & Bioinformatics Services
- By Application
- Aneuploidy & Maternal Age-related Risk
- Monogenic / Inherited Genetic Diseases
- HLA Typing for Stem-Cell Therapy
- Gender Selection & Family Balancing
- By End User
- Fertility & IVF Clinics
- Hospitals & Diagnostic Laboratories
- Academic & Research Institutes
- By Geography
- North America
- United States
- Canada
- Mexico
- Europe
- Germany
- United Kingdom
- France
- Italy
- Spain
- Rest of Europe
- Asia-Pacific
- China
- India
- Japan
- South Korea
- Australia
- Rest of Asia-Pacific
- South America
- Brazil
- Argentina
- Rest of South America
- Middle East and Africa
- GCC
- South Africa
- Rest of Middle East and Africa
- North America
Detailed Research Methodology and Data Validation
Primary Research
Mordor analysts held structured calls with embryologists, IVF-clinic managers, reference-lab directors, and equipment distributors across North America, Europe, and Asia-Pacific. These conversations validated biopsy adoption rates, consumable price corridors, and likely uptake of non-invasive PGT; allowing us to fine-tune regional demand curves.
Desk Research
Our team collated annual IVF cycle statistics from the CDC, ESHRE, and Australia's AIHW, tracked maternal-age trends through United Nations population data, and mapped fertility-clinic counts using regulatory registries in 17 countries [cdc.gov]. Supplementary insight came from peer-reviewed journals on NGS accuracy, national reimbursement schedules, and import tariffs for sequencing reagents. Company filings, investor decks, and patent families (via Questel) clarified average selling prices, shipment flows, and pipeline technologies. Several headline indicators, such as elective egg-freezing volumes and PGD billing codes, were logged to ground forward assumptions. This list represents key public sources; many additional open and paid datasets informed validation.
Market-Sizing & Forecasting
A top-down model begins with live-birth-adjusted IVF cycles, applies penetration coefficients for each PGT subtype, and multiplies by blended ASPs. Selective bottom-up roll-ups of reagent shipments and sequencing-run volumes test the totals. Key variables include average maternal age, clinic capacity additions, NGS cost curves, regulatory reimbursements, and single-gene-disease prevalence. Multivariate regression on these drivers generates base-case growth, while scenario analysis adjusts for technology price shocks and shifting ethical guidelines.
Data Validation & Update Cycle
Outputs pass variance checks against historical clinic revenue, customs codes, and import pricing; anomalies trigger analyst re-contact before sign-off. Reports refresh annually, with mid-cycle updates when policy or technology events materially move the baseline.
Why Our Preimplantation Genetic Testing Baseline Commands Reliability
Published figures vary because firms choose different embryo stages, product mixes, and refresh cadences. We anchor on IVF-cycle realities and keep conversion factors transparent, giving executives a number that can be traced back to clinic reception desks.
Key gap drivers include some publishers folding prenatal testing into totals; others exclude software services; a few convert currencies once a year, inflating long-range CAGRs; refresh lags of up to three years further widen gaps.
Benchmark comparison
| Market Size | Anonymized source | Primary gap driver |
|---|---|---|
| USD 816.1 Mn (2024) | Mordor Intelligence | - |
| USD 852.4 Mn (2024) | Global Consultancy A | Ignores software & bioinformatics sales; annual refresh lag |
| USD 830 Mn (2024) | Market Research Provider B | Combines prenatal screens and PGT, uses static ASP assumptions |
These contrasts show that Mordor's disciplined scope selection, live-cycle variables, and yearly updates offer the most balanced, reproducible baseline for strategic planning.


Key Questions Answered in the Report
What is the current value of the preimplantation genetic testing market?
The market generated USD 816.1 million in 2024 and is projected to reach USD 1,387.6 million by 2030.
Which test type holds the largest share of the preimplantation genetic testing market?
Aneuploidy screening dominated with 46.54% market share in 2024, owing to its well-established role in reducing miscarriage rates.
How fast is non-invasive PGT expected to grow?
Non-invasive PGT is forecast to expand at a 10.35% CAGR through 2030 as clinical validation accelerates.
Which region is growing fastest in the preimplantation genetic testing market?
Asia-Pacific is the fastest-growing region, advancing at a 12.89% CAGR fueled by rapid fertility-clinic expansion and declining test costs.
What technological trends are shaping the preimplantation genetic testing industry?
NGS remains the gold standard, but AI-assisted imaging and non-invasive cell-free DNA assays are emerging as high-growth technologies.
Page last updated on:


