Market Overview
| Study Period | 2020 - 2031 |
|---|---|
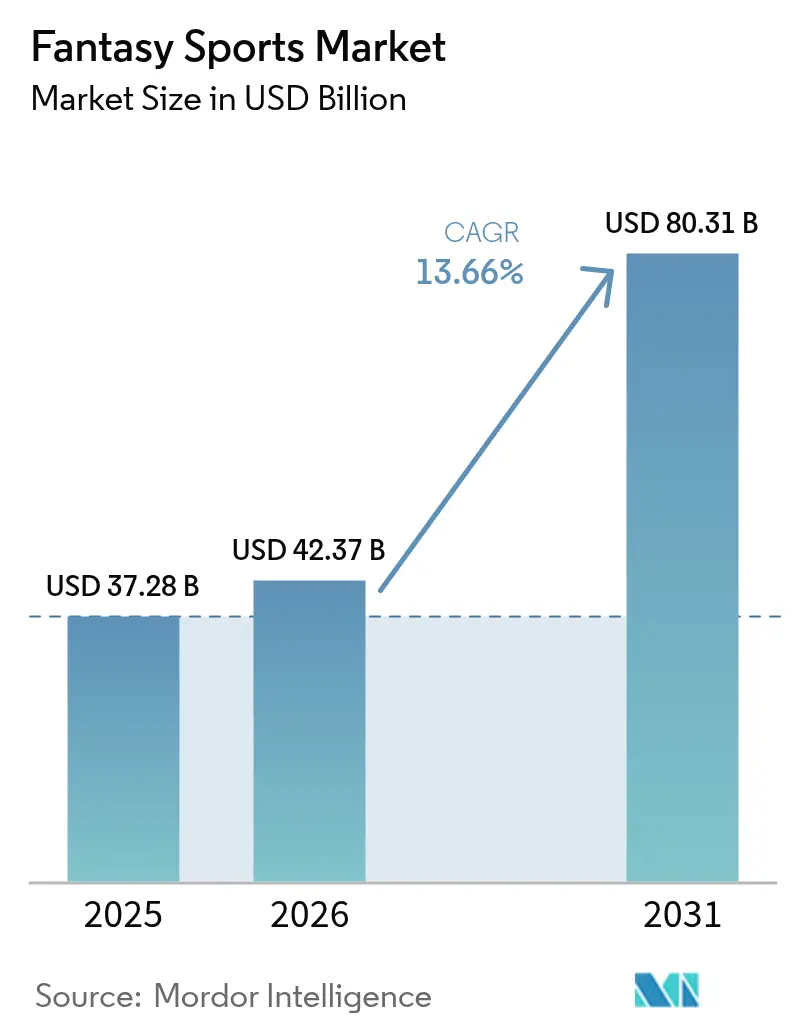
| Market Size (2026) | USD 42.37 Billion |
| Market Size (2031) | USD 80.31 Billion |
| Growth Rate (2026 - 2031) | 13.66% CAGR |
| Fastest Growing Market | Asia Pacific |
| Largest Market | North America |
| Market Concentration | Medium |
Major Players *Disclaimer: Major Players sorted in no particular order Image © Mordor Intelligence. Reuse requires attribution under CC BY 4.0. | |
Fantasy Sports Market Analysis by Mordor Intelligence
Fantasy sports market size in 2026 is estimated at USD 42.37 billion, growing from 2025 value of USD 37.28 billion with 2031 projections showing USD 80.31 billion, growing at 13.66% CAGR over 2026-2031. Robust mobile-first adoption, clearer regulations, and increasingly granular data analytics allow operators to convert passive fandom into interactive, skill-based play. The fantasy sports market benefits from multiple revenue streams, entry fees, digital collectibles, advertising, and subscriptions, making it less exposed to any single economic variable. Regulatory normalization in Brazil, incremental liberalization across U.S. states, and systemwide 5G rollout lower barriers to entry while boosting real-time engagement. Meanwhile, platform investments in artificial intelligence and official league data elevate user retention as personalized recommendations strengthen line-up success and perceived fairness.
Key Report Takeaways
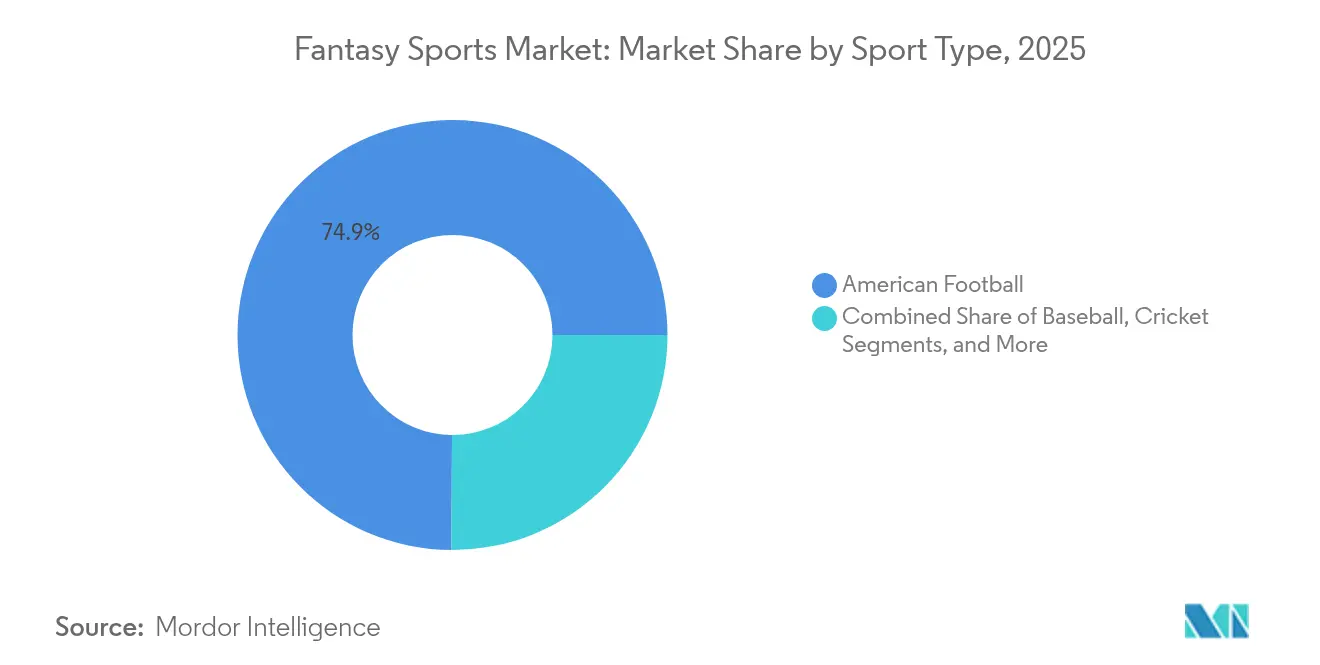
- By sport type, American football led with 74.92% fantasy sports market share in 2025; esports is expanding at a 14.64% CAGR through 2031.
- By platform, mobile applications captured 64.61% revenue in 2025 in the fantasy sports, while the segment is growing at 14.21% CAGR.
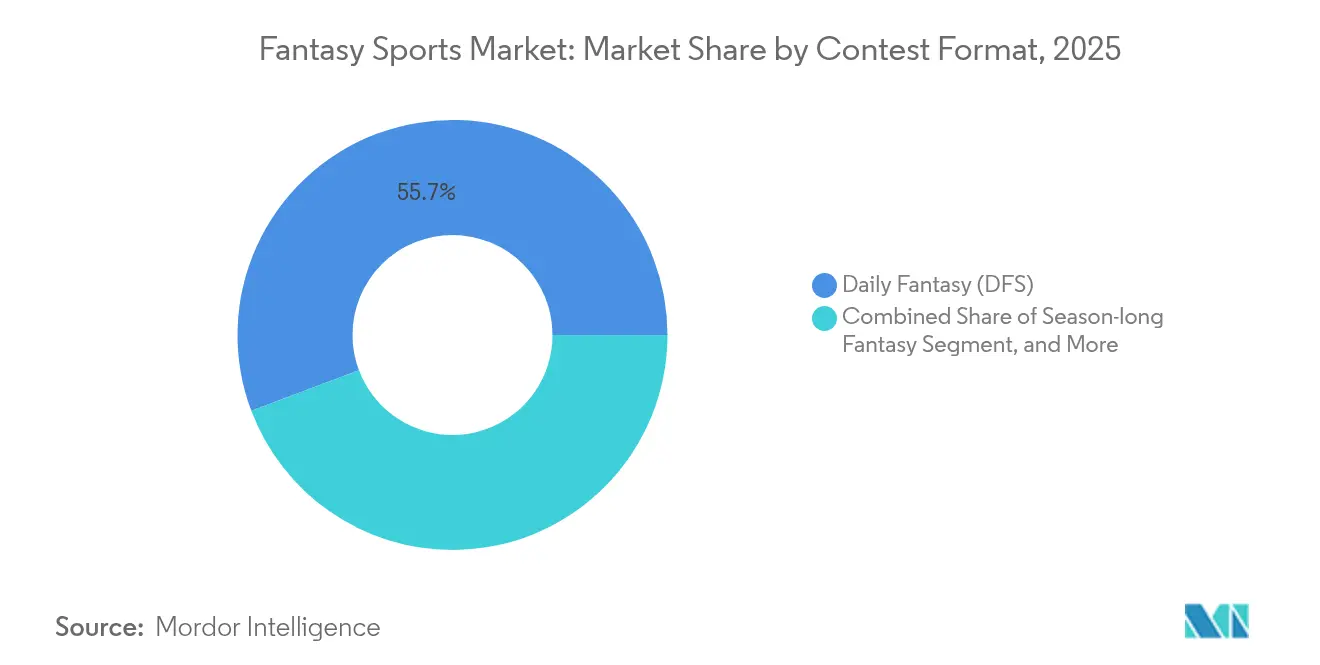
- By contest format, daily fantasy sports held 55.74% of the fantasy sports market size in 2025; micro/in-play fantasy is rising at a 13.85% CAGR.
- By revenue model, entry-fee contests accounted for 61.02% of the fantasy sports market size in 2025, whereas NFT/token-gated formats are scaling at a 14.02% CAGR.
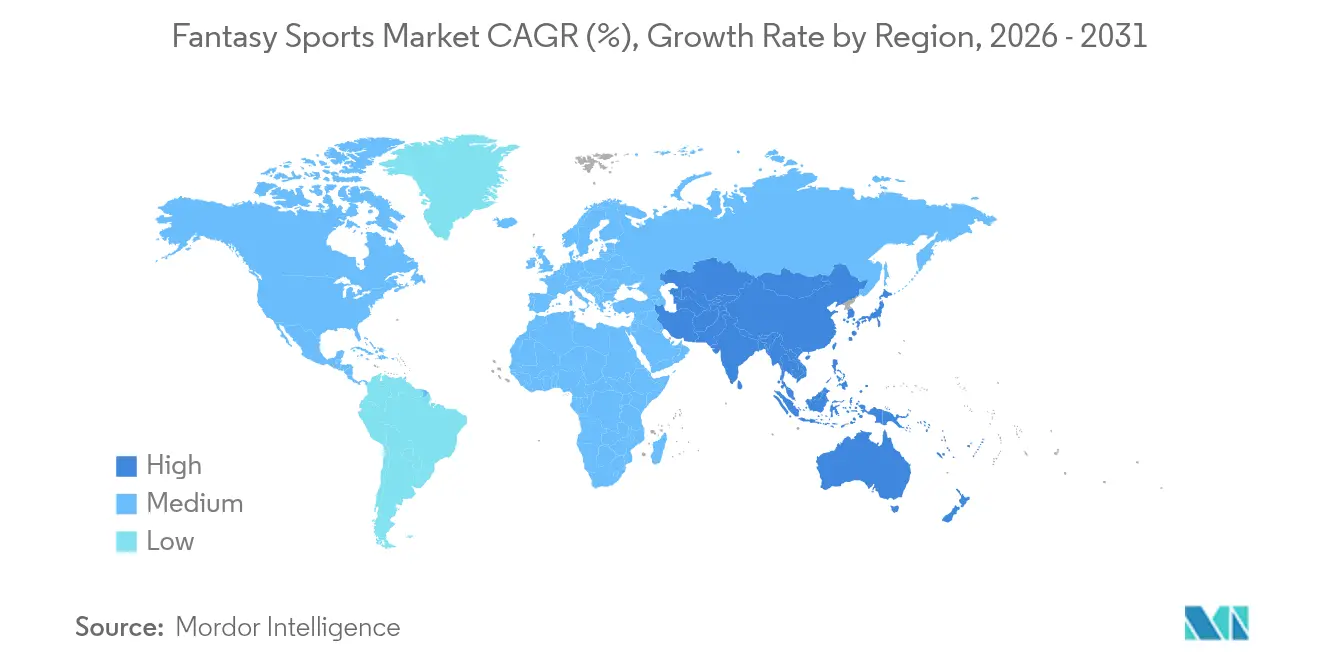
- By geography, North America dominated with 38.22% share in 2025 in the fantasy sports, yet Asia Pacific is forecast to climb at a 13.72% CAGR to 2031.
Note: Market size and forecast figures in this report are generated using Mordor Intelligence’s proprietary estimation framework, updated with the latest available data and insights as of 2026.
Global Fantasy Sports Market Trends and Insights
Drivers Impact Analysis*
| Driver | (~) % Impact on CAGR Forecast | Geographic Relevance | Impact Timeline |
|---|---|---|---|
| Smartphone-centric user base expansion | +2.5% | Global, strongest in Asia Pacific | Medium term (2-4 years) |
| Legalization of online sports wagering | +1.8% | North America and Latin America | Short term (≤2 years) |
| League-led partnerships and official data | +1.2% | Global, major sports markets | Medium term (2-4 years) |
| Real-time analytics and AI engagement | +0.9% | Global, early North America and EU | Long term (≥4 years) |
| Web3 collectibles and play-to-earn features | +0.7% | Global, regulation-dependent | Long term (≥4 years) |
| Rise of female fan participation | +0.6% | Global, Western markets | Medium term (2-4 years) |
| Source: Mordor Intelligence | |||


Smartphone-centric user base expansion
Mobile usage represented 65.43% of all fantasy sports transactions in 2024, and the channel is growing at 14.87% CAGR to 2030 as operators optimize push alerts, quick deposits, and geolocation features. PrizePicks crossed 1 million app downloads and supports 15 sports plus 25 leagues via an intuitive design that compresses research and contest entry into seconds. Fifth-generation networks shrink latency to milliseconds, enabling continuous prop-style contests that mirror live game flows. Operators file patents for mid-game roster edits, pointing to proprietary mobile capabilities as an engagement moat. In emerging markets where smartphones are the primary internet device, this mobile-first approach enlarges the fantasy sports market well beyond traditional desktop-reliant demographics.
Legalization of online sports wagering in new jurisdictions
Brazil opened a regulated sports betting framework in January 2025, with annual turnover estimated to reach USD 34 billion by 2028.[1]Brazilian Ministry of Finance, “Sports Betting Regulation Framework,” GOV.BR Regional spillover is underway as Mexico and Argentina evaluate parallel legislation covering skill-based gaming and real-money contests. This creates a timing advantage for first movers that can fast-track compliance and secure advertising partnerships before market saturation. Conversely, California’s Attorney General labeled daily fantasy sports illegal in July 2025, adding short-term volatility for operators that must now navigate a patchwork of rules on a state-by-state basis.[2]California Department of Justice, “Attorney General Opinion on Daily Fantasy Sports,” OAG.CA.GOV Firms with seasoned legal teams and modular platform architectures are better positioned to absorb the added compliance cost while scaling into newly open territories.
Growing league-led partnerships and official data licensing
Professional leagues now view fantasy integration as both a revenue extension and a fan-engagement flywheel. Amazon Prime Video’s expanded U.S. rights package, 66 NBA games plus NFL, WNBA, and NASCAR, creates room for real-time fantasy overlays that sync with live streams.[3]Amazon Corporate Site, “Prime Video Sports Rights Expansion,” AMAZON.COM PrizePicks’ multi-year sponsorship with Wave Sports + Entertainment drives discovery through Jason and Travis Kelce’s “New Heights” podcast, which generated 2.8 billion impressions in 2024 alone. These tie-ups secure premium data feeds, produce branded content, and cultivate user trust—advantages that small operators struggle to replicate.
Real-time analytics and AI-driven engagement features
FanDuel’s AceAI launched in 2024, offering conversational lineup guidance that taps live stats, weather, and betting lines.[4]FanDuel Newsroom, “AceAI Launch Announcement,” FANDUEL.COM MLB franchises integrate player biometrics to flag fatigue or injury risk, inputs that can automatically adjust recommended rosters. Platforms also deploy machine-learning models to predict churn and refine promotional spend, helping stretch every acquisition dollar in a fiercely competitive channel. AI is particularly impactful for micro-fantasy, where in-contest adjustments hinge on millisecond data ingestion.
Restraints Impact Analysis*
| Restraint | (~) % Impact on CAGR Forecast | Geographic Relevance | Impact Timeline |
|---|---|---|---|
| Regulatory uncertainty and compliance costs | -1.4% | Global, concentrated in emerging markets | Short term (≤2 years) |
| Data-privacy and integrity concerns | -0.8% | Global, EU and North America focus | Medium term (2-4 years) |
| Escalating customer-acquisition spending | -0.9% | Global, saturated markets | Short term (≤2 years) |
| Player fatigue from contest saturation | -0.7% | Global, advanced economies | Long term (≥4 years) |
| Source: Mordor Intelligence | |||
Regulatory uncertainty and patchwork compliance costs
California’s legal reversal spurred lawsuits from Underdog Fantasy and prompted immediate contest suspensions. Germany’s GGL has stepped up enforcement under its Interstate Treaty on Gambling, while Malta’s Bill 55 complicates cross-border license recognition. Each jurisdiction demands bespoke product tweaks, from payment flows to contest rules, raising legal spend and slowing feature rollouts. Smaller firms lacking dedicated compliance teams face consolidation pressure, giving large incumbents a structural edge.
Data-privacy and integrity concerns
Fantasy apps harvest location, behavioral, and financial data, which now fall under strict data-protection codes. The UK Information Commissioner’s Office fined prominent sportsbooks for undisclosed data sharing, signaling broader sector scrutiny. Platforms are responding with blockchain verification and user-controlled privacy dashboards, but development resources shift away from front-end innovation. High-profile breaches or opaque data practices risk eroding player trust, a key currency in the subscription-heavy fantasy sports industry.
*Our forecasts treat driver/restraint impacts as directional, not additive. The impact forecasts reflect baseline growth, mix effects, and variable interactions.
Segment Analysis
By Sport Type: Traditional dominance meets digital disruption
American football accounted for 74.92% of the fantasy sports market size in 2025, cementing its hold through deep NFL partnerships and habitual Sunday play. Yet esports is pacing a 14.64% CAGR to 2031 as Gen Z viewers elevate competitive gaming to mainstream status. This surge is unhindered by off-season gaps, offering year-round content cycles. Cricket enjoys outsized traction in India, where Dream11 hosts 210 million users, many drawn during high-profile IPL fixtures. Basketball and baseball preserve sizable pools thanks to player-prop depth and analytics familiarity, while golf and motor racing attract premium entry fees despite smaller audiences. Over the forecast horizon, the fantasy sports market is expected to show more balanced sport participation without eroding football’s revenue heft.
Operator responses mirror this diversification. Dedicated esports slates integrate Twitch APIs for live stat pulls, whereas cricket platforms optimize for high-frequency matches that encourage multi-entry play. American football remains the anchor product, but firms now bundle cross-sport promotions to reduce seasonality and lengthen player lifetime value. The endgame is a resilient revenue mix that stabilizes cash flow regardless of any single league’s broadcast calendar.


By Platform: Mobile applications steer the engagement revolution
Mobile captured 64.61% of the fantasy sports market share in 2025, a lead reinforced by 14.21% CAGR projections tied to faster chipsets and biometric login convenience. The desktop cohort sticks around for research-heavy tasks, but second-screen culture prioritizes the phone for contest entry and live sweats. Smart-TV integration is nascent; yet Amazon’s rights portfolio implies future scenarios where viewers draft prop picks straight from the remote. Cloud-synced accounts let users toggle across devices without losing lineup edits, sharpening overall retention.
Mobile-centric product roadmaps also lower barriers in geographies where PCs are scarce, amplifying reach in Southeast Asia and Latin America. Operators compete on load speeds, UX clarity, and one-tap deposits, distinguishing themselves in an ecosystem where app-store ratings translate directly into acquisition velocity. The fantasy sports market therefore hinges on continued mobile OS innovation and affordable data plans that keep latency and transaction costs minimal.
By Contest Format: Daily fantasy remains core as micro-contests accelerate
Daily fantasy sports contributed 55.74% of 2025 revenue, anchored by salary-cap lineups and guaranteed prize pools that users recognize as skill-forward contests. Micro/in-play fantasy is rising at a 13.85% CAGR, fueled by single-stat props that refresh every quarter or inning, thus converting idle viewers into real-time participants. Season-long formats endure in workplace leagues, stimulating water-cooler conversation that reinforces brand stickiness beyond game outcomes. Best-ball variants give casual fans a passive season experience, bridging the gap between intensive weekly roster tinkering and one-off prop picks.
Platforms now layer multiple formats into a single wallet, enabling cross-sell promotions that spread risk and lift average revenue per user. Regulators, however, scrutinize micro-contests for resemblance to sports betting, and firms must demonstrate skill predominance through transparent scoring algorithms. Sustainable growth will depend on clearly delineated format definitions and consistent player-education campaigns.
By Revenue Model: Entry fees hold sway but innovation gains ground
Entry-fee contests delivered 61.02% of 2025 receipts, appealing to users comforted by transparent rake structures. Nonetheless, NFT-gated contests are climbing at 14.02% CAGR as collectors monetize limited-edition player cards for lineup boosts. DraftKings shuttered one NFT line in 2024 after compliance headwinds, illustrating how regulatory flux tempers Web3 upside. Free-to-play advertising models serve as cost-effective funnels, seeding new users who may later opt into paid contests. Subscription tiers bundle advanced projections and exclusive tournaments, providing predictable monthly cash flow and shielding operators from seasonal variance.
Operators increasingly blend these monetization levers, adjusting the mix per region based on disposable income and online-payment norms. The fantasy sports market size therefore hinges on diversified monetization that cushions any single channel’s regulatory or economic shock.
Geography Analysis
North America sustained 38.22% fantasy sports market share in 2025, anchored by U.S. user familiarity and premium contest entry levels. Recent legal volatility in California underscores that maturity does not equal stability. Canada’s lighter federal oversight and Mexico’s pending legislation present near-term white space, while U.S. operators refine loyalty programs to offset soaring acquisition spend that reached USD 416 million in TV buys during 2024.
Asia Pacific is pacing a 13.72% CAGR to 2031, catalyzed by India’s cricket-centric user base and expanding 4G penetration. Dream11’s 210 million accounts show the scale potential when local sports passions and inexpensive data converge. Despite a 28% GST on entry fees, operators leverage regional payment gateways and vernacular content to sustain growth. China’s opportunity hinges on policy clarity, but Japan and Australia already furnish regulated pathways with high per-capita spend.
Europe offers mixed prospects. Germany’s strict ISTG regime raises compliance hurdles, whereas the UK remains sizable but constrained by ad-spend caps and data-privacy audits. Latin America, led by Brazil’s newly regulated wagering ecosystem, promises rapid expansion; projected turnover of USD 34 billion by 2028 signals ample liquidity for parallel fantasy offerings. Argentina and Mexico could unlock another 50 million prospects once frameworks solidify. Africa and the Middle East stay on long-term watchlists given infrastructural and legislative gaps, yet rising smartphone adoption makes future entry feasible once regulatory guardrails appear.

Competitive Landscape
Market leaders are consolidating specialized capabilities to widen their defense moats. DraftKings paid USD 750 million for Jackpocket, extending into digital lottery tickets, and separately acquired Simplebet for micro-betting tech that enriches its prop platform. Underdog Fantasy’s USD 70 million Series C, valuing the firm at USD 1.2 billion, equips a challenger brand to scale simplified draft formats that resonate with casual fans. PrizePicks ranked 8th on Deloitte’s 2024 Technology Fast 500, underscoring how focused UX and fast payouts can capture share even against capital-heavy incumbents.
Television and streaming promotions remain the biggest customer-acquisition lever, but cost inflation widens the gap between top-tier budgets and niche operators. Technology is another battlefield: AI-powered suggestion engines, roster-swap patents, and blockchain ticketing aim to differentiate sticky ecosystems. Compliance capabilities double as strategic assets as regulatory flux culls under-capitalized entrants. Ultimately, the fantasy sports market is tilting toward a group of well-funded players that can combine legal resilience, data science depth, and global brand recognition.
Fantasy Sports Industry Leaders
DraftKings Inc.
NFL Enterprises LLC
CBS Interactive Inc. (CBS Sports Digital)
FanDuel Group (Flutter Entertainment plc)
Yahoo Inc. (Yahoo Fantasy Sports)
- *Disclaimer: Major Players sorted in no particular order


Recent Industry Developments
- March 2025: PrizePicks expanded its Wave Sports + Entertainment partnership to amplify podcast-led acquisition via 2.8 billion annual impressions.
- April 2025: PrizePicks unveiled “The Draft,” a free-to-play game featuring USD 500,000 in prizes and secured NCPG iCAP accreditation, elevating responsible-gaming credentials.
- January 2025: Brazil activated a regulated sports betting regime expected to handle USD 34 billion in annual turnover by 2028, opening parallel fantasy channels for licensed operators.
- October 2025: DraftKings finalized its USD 750 million Jackpocket purchase, integrating new verticals and micro-betting capabilities.


Global Fantasy Sports Market Report Scope
Fantasy sports are online games where participants create virtual teams of real-life professional athletes. The market defines the revenue from the sales of fantasy sports platforms and services.
The fantasy sports market is segmented by type (football, baseball, cricket, basketball, and car racing), platform (website and mobile application), demographics (under 25 years, between 25 and 40 years, and above 40 years), application (individual competition and team competition), and geography (North America, Europe, Asia-Pacific, and Rest of the World). The market sizes and forecasts are provided in terms of value (USD) for all the above segments.
By Sport Type
| American Football |
| Basketball |
| Baseball |
| Cricket |
| Soccer |
| Motor Racing |
| Golf |
| Esports |
| Other Sport Types |
By Platform
| Website |
| Mobile Application |
| Smart TV / Console |
By Contest Format
| Season-long Fantasy |
| Daily Fantasy (DFS) |
| Micro / In-play Fantasy |
| Best-Ball |
By Revenue Model
| Entry-fee Based |
| Advertising-supported Free-to-Play |
| Subscription-based |
| NFT / Token-gated |
By Geography
| North America | United States | |
| Canada | ||
| Mexico | ||
| South America | Brazil | |
| Argentina | ||
| Rest of South America | ||
| Europe | United Kingdom | |
| Germany | ||
| France | ||
| Italy | ||
| Spain | ||
| Russia | ||
| Rest of Europe | ||
| Asia Pacific | China | |
| India | ||
| Japan | ||
| South Korea | ||
| Australia and New Zealand | ||
| Rest of Asia Pacific | ||
| Middle East and Africa | Middle East | Saudi Arabia |
| United Arab Emirates | ||
| Turkey | ||
| Rest of Middle East | ||
| Africa | South Africa | |
| Nigeria | ||
| Egypt | ||
| Rest of Africa | ||
| By Sport Type | American Football | ||
| Basketball | |||
| Baseball | |||
| Cricket | |||
| Soccer | |||
| Motor Racing | |||
| Golf | |||
| Esports | |||
| Other Sport Types | |||
| By Platform | Website | ||
| Mobile Application | |||
| Smart TV / Console | |||
| By Contest Format | Season-long Fantasy | ||
| Daily Fantasy (DFS) | |||
| Micro / In-play Fantasy | |||
| Best-Ball | |||
| By Revenue Model | Entry-fee Based | ||
| Advertising-supported Free-to-Play | |||
| Subscription-based | |||
| NFT / Token-gated | |||
| By Geography | North America | United States | |
| Canada | |||
| Mexico | |||
| South America | Brazil | ||
| Argentina | |||
| Rest of South America | |||
| Europe | United Kingdom | ||
| Germany | |||
| France | |||
| Italy | |||
| Spain | |||
| Russia | |||
| Rest of Europe | |||
| Asia Pacific | China | ||
| India | |||
| Japan | |||
| South Korea | |||
| Australia and New Zealand | |||
| Rest of Asia Pacific | |||
| Middle East and Africa | Middle East | Saudi Arabia | |
| United Arab Emirates | |||
| Turkey | |||
| Rest of Middle East | |||
| Africa | South Africa | ||
| Nigeria | |||
| Egypt | |||
| Rest of Africa | |||


Key Questions Answered in the Report
How large is the fantasy sports market in 2026?
It is estimated at USD 42.37 billion and is projected to reach USD 80.31 billion by 2031.
Which segment is growing fastest within the fantasy sports space?
Esports fantasy contests are expanding at 14.64% CAGR, outpacing every other sport type.
Why is mobile so critical for fantasy platforms?
Mobile apps hold 64.61% usage share and are forecast to grow at 14.21% CAGR thanks to latency-free notifications and streamlined payments.
Which region should operators prioritize for future growth?
Asia Pacific leads with a 13.72% CAGR, propelled by India’s 210 million fantasy players and rising smartphone penetration.
How are operators addressing regulatory risk?
Market leaders invest in dedicated compliance teams, modular tech stacks, and diversified revenue models to adapt quickly to changing laws.
Page last updated on:


