
Footwear Market Size and Share
Footwear Market Analysis by Mordor Intelligence
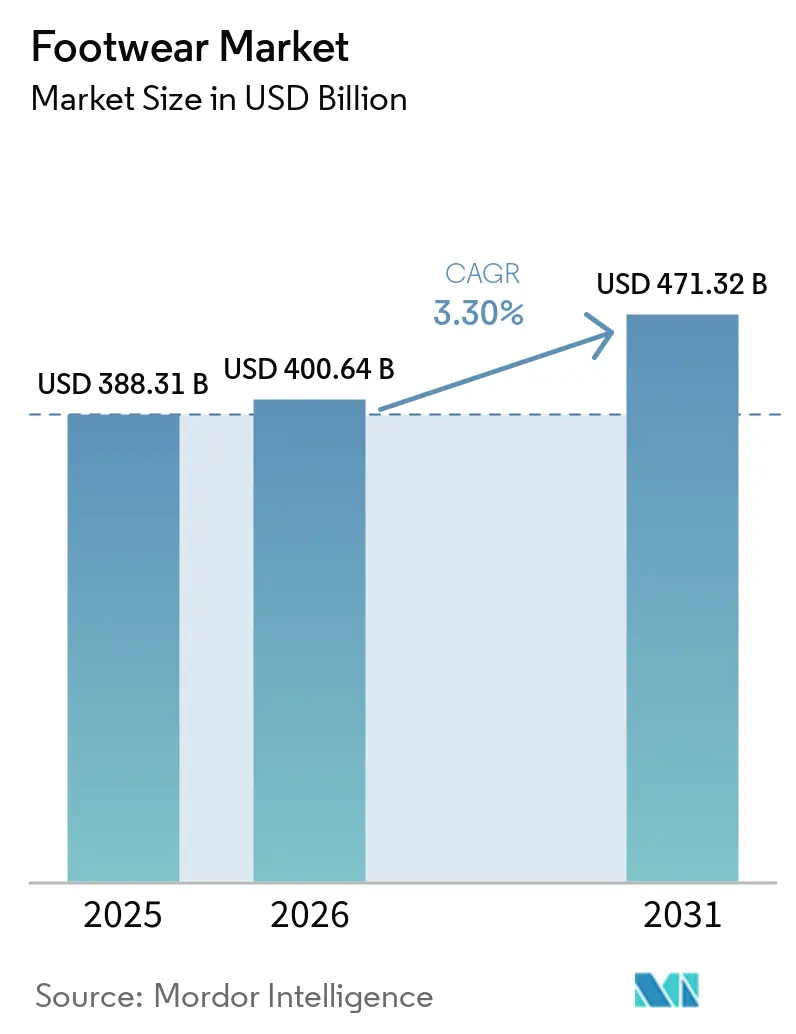
The footwear market size is expected to increase from USD 400.6 billion in 2026 to USD 413.9 billion in 2027 and reach USD 482.1 billion by 2032, growing at a CAGR of 3.1% over 2027-2032.
School-season interest in athletic and athleisure shoes in the United States supports footwear propositions spanning activity and everyday wear. Brands can develop that appeal through comfort construction, performance innovation, and material substitution. Retail and direct channels give brands complementary routes to buyers, so channel choice becomes part of product strategy. Material-cost exposure and counterfeit-related price pressures can constrain profitable sales even when product interest strengthens. Suppliers that hold comfort and material claims steady while pricing against cheaper counterfeit alternatives are better placed to keep margin as input costs fluctuate.
Key Report Takeaways
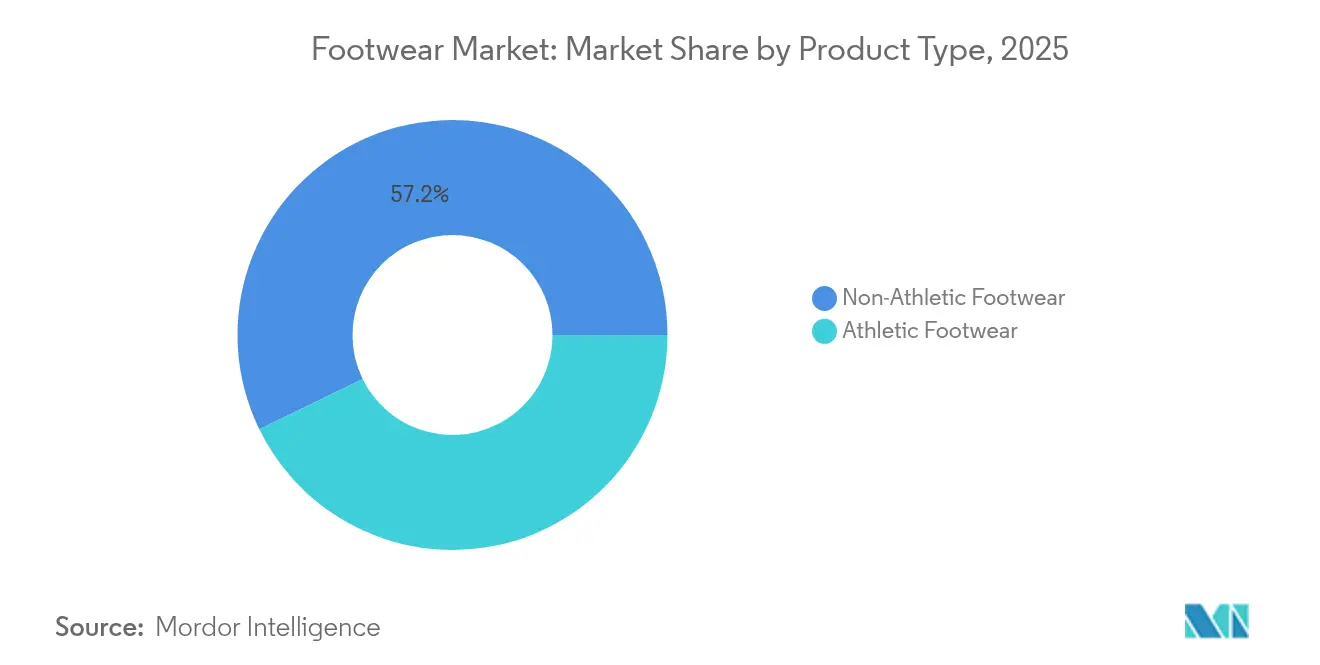
- By product type, non-athletic footwear held a 56.65% footwear market share in 2026, while athletic footwear is forecast to grow fastest at a CAGR of 4.5% over 2027-2032.
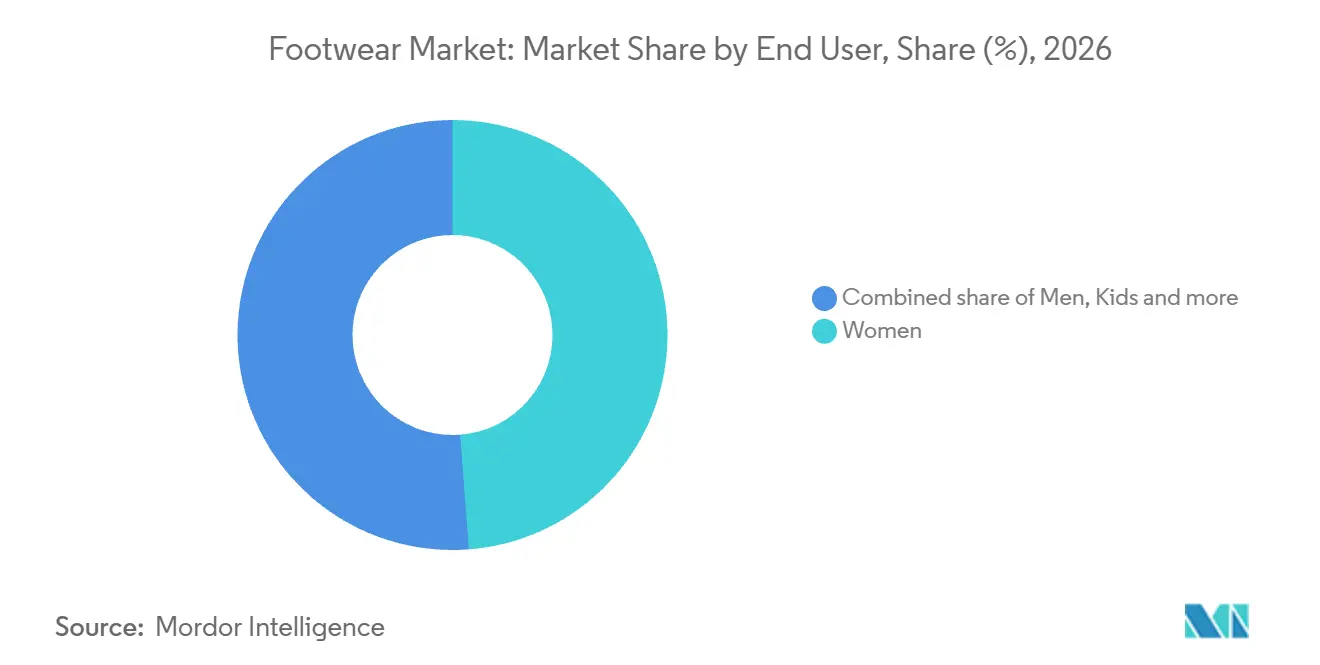
- Among end users, women held a 48.78% share of the footwear market size in 2026, with kids’ footwear forecast to grow fastest at a CAGR of 4.4% over 2027-2032.
- Mass footwear led the category split with 87.22% of market value in 2026, whereas premium footwear is forecast to grow fastest at a CAGR of 4.3% over 2027-2032.
- Distribution channels were led by specialty stores with a 57.36% share of market value in 2026, and online retail stores are forecast to expand fastest at a CAGR of 5.2% over 2027-2032.
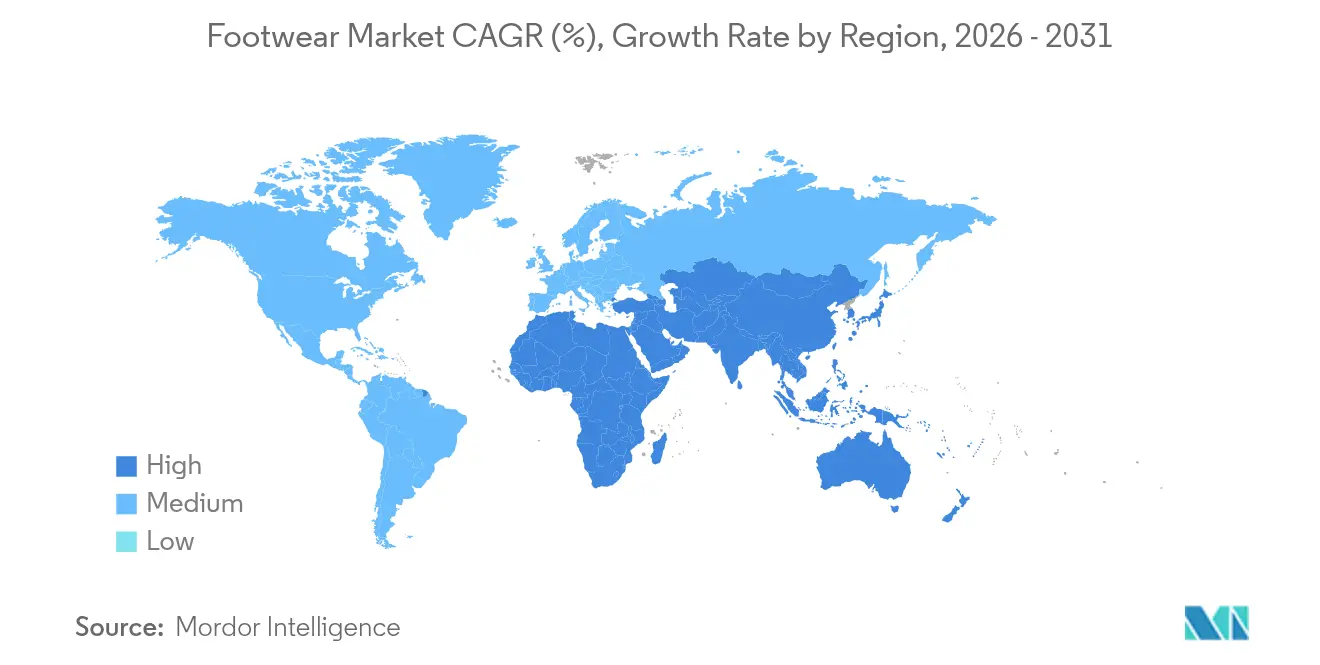
- Geographically, North America held 31.23% of market value in 2026, while South America is forecast to grow fastest at a CAGR of 4.65% over 2027-2032.
Note: Market numbers in this report are based on Mordor Intelligence's proprietary estimation framework, which combines nine months of actuals with Q4 projections for base year 2026.
Market Trends and Insights
Drivers Impact Analysis of Footwear Market*
| Driver | (~) % Impact on CAGR Forecast | Geographic Relevance | Impact Timeline |
|---|---|---|---|
| Surging Demand for Athleisure Footwear | +1.5% | United States of America | Short term (≤ 2 years) |
| Aggressive Marketing and Influencer Collaborations | +1% | United States, United Kingdom, China | Short term (≤ 2 years) |
| Rise of Sustainable and Bio-based Materials | +0.9% | Americas, Europe, Asia-Pacific | Medium term (2-4 years) |
| Growth of D2C Digital-Native Footwear Brands | +0.8% | Americas, Europe, Middle East, Africa, Asia-Pacific | Medium term (2-4 years) |
| Adoption of Smart and Connected Footwear | +0.2% | Kingdom of Denmark | Long term (≥ 4 years) |
| Expansion of Resale and Sneakerhead Culture | +0.3% | Japan, South Korea, Hong Kong, Great Britain | Medium term (2-4 years) |
| Source: Mordor Intelligence | |||
Surging Demand for Athleisure Footwear
Back-to-school spending gives athletic and athleisure footwear a demand opportunity beyond purchases tied solely to sporting activity. In a June 2026 U.S. survey, consumers expected back-to-school net spending on athletic and athleisure shoes to rise 11% from 2025. This expectation gives suppliers a reason to address the school-season buying occasion with a combined performance and everyday-wear proposition. The commercial mechanism is broader relevance for the same footwear category rather than dependence on a single sport. Brands can pursue that demand through versatile designs while preserving a clear reason for choosing the shoe. For retailers, the opportunity centers on capturing a defined seasonal spending intention before it disperses across competing product choices.
Aggressive Marketing and Influencer Collaborations
Marketing partnerships give footwear brands a route to connect functional products with a recognizable cultural identity. On November 10, 2025, Skechers announced actress and entrepreneur Sofía Vergara as its newest brand ambassador for fashion-meets-comfort footwear.[1] Adidas reported more than 9 billion views and over 400 million engagements across its digital ecosystem for its 2026 World Cup marketing. That brand-wide exposure illustrates the scale at which partnership-based storytelling can compete for consumer attention. For comfort footwear, a style-focused ambassador offers a more specific route into fashion consideration than broad campaign reach alone. The commercial task is to connect that attention to the shoe’s particular appeal, so recognition supports a product choice rather than becoming the entire proposition.
Rise of Sustainable and Bio-based Materials
Material substitution gives footwear brands a way to differentiate construction alongside styling. Recycled or renewable materials represented 23% by weight of On’s midsole compounds across all footwear styles in 2025, compared with 12% in 2024. Puma SE reported that 96.1% of PUMA and Cobra footwear contained at least one certified or recycled component in 2025, compared with 24% in 2020. The measure covers Cobra footwear only where it is sourced by PUMA Group Sourcing. The two measures describe different routes to material substitution, greater content within a compound and wider coverage of footwear products.
Growth of D2C Digital-Native Footwear Brands
Direct selling gives digital-native footwear brands a route to expand through formats they operate themselves. In 2022, On co-CEO Martin Hoffmann described the company as digital-native from its start. On Holding AG reported a 26% year-over-year increase in direct-to-consumer sales of footwear, apparel, and accessories for the quarter ended June 30, 2026. Its direct-to-consumer channel includes both its e-commerce platform and company retail stores. Owning both formats can give the brand control over how footwear construction and intended use are presented to potential buyers. Because On counts company stores alongside e-commerce, its direct-channel growth strengthens a route to buyers that depends on physical retail execution as well as digital selling.
Restraints Impact Analysis of Footwear Market*
| Restraint | (~) % Impact on CAGR Forecast | Geographic Relevance | Impact Timeline |
|---|---|---|---|
| Extensive Availability of Counterfeit Products | -0.7% | United Kingdom of Great Britain and Northern Ireland | Medium term (2-4 years) |
| Volatile Raw-Material Prices and Supply-Chain Disruptions | -0.5% | Vietnam, Indonesia, China | Short term (≤ 2 years) |
| ESG Scrutiny on Labor Practices | -0.3% | United States, China | Short term (≤ 2 years) |
| Anti-Plastic Legislation Limiting Synthetic Uppers | -0.2% | The French Republic | Short term (≤ 2 years) |
| Source: Mordor Intelligence | |||
Extensive Availability of Counterfeit Products
Counterfeit availability constrains legitimate brands by serving demand that may not transfer readily to authentic footwear. The UK Intellectual Property Office’s 2025 survey covered 200 UK adults who knowingly bought counterfeit footwear, excluding sports footwear. Asked what they would do without counterfeits, 22% said they would buy from the brand, 21% said they would go without footwear, and 40% would choose similar cheaper products.[2] These hypothetical choices suggest that counterfeit buyers are difficult for original suppliers to win back, even if imitation supply is removed. Counterfeit access leaves legitimate brands contesting a price-sensitive customer base whose stated alternatives often lead away from the original brand.
Volatile Raw-Material Prices and Supply-Chain Disruptions
Raw-material volatility can constrain affordable footwear supply even when materials remain physically obtainable. In its fiscal 2026 filing, Nike, Inc. said commodity and raw-material availability and price volatility had adversely affected, and could affect, costs, gross margins, and profitability.[3] In fiscal 2026, contract manufacturers’ factories in Vietnam, Indonesia, and China made approximately 52%, 27%, and 16% of NIKE Brand footwear, respectively, tying input-cost exposure to those production bases. Its filing identified cotton and petroleum derivatives among the raw materials used in products and the supply chain. Absorbing those costs limits earnings, while passing them into shoe prices can make the intended price point harder to sustain.
*Our forecasts treat driver/restraint impacts as directional, not additive. The impact forecasts reflect baseline growth, mix effects, and variable interactions.
Footwear Market Segment Analysis
By Product Type:
Casual Scale and Performance InnovationNon-athletic footwear accounted for a 56.65% share of the footwear market size in 2026. Crocs Brand’s footwear and related accessories generated USD 1 billion worldwide in Q2 2026, up 4.3% in reported dollars from Q2 2025. Crocs describes Croslite, used in the vast majority of its brand’s footwear, as a proprietary closed-cell resin formulated for lightweight, water-resistant comfort. Those characteristics give a casual franchise a construction-based proposition alongside its visual identity. Crocs sold 128.9 million Crocs Brand footwear units in 2025, up 1.5% from 2024, giving its widely used comfort material a high-volume commercial base.
Athletic footwear is the fastest-growing segment, with a forecast CAGR of 4.5% over 2027-2032. Adidas reported double-digit footwear revenue increases in several Performance categories in the first half of 2026, led by Running, Training, and Motorsport. The company attributed those results to a wider product offering and product innovation. These distinct sporting uses offer several routes to performance demand, allowing a footwear supplier to develop more than one commercial franchise.

By End User:
Women’s Scale and Kids’ SpecializationWomen represented a 48.78% footwear market share in 2026. Women’s footwear represented 61% of Caleres’ total net sales in fiscal 2025, which ended January 31, 2026. Caleres also said its Brand Portfolio gained share in women’s fashion footwear during the 13 weeks ended August 1, 2026, according to Circana. A substantial company sales base can thus coexist with an opportunity to improve competitive position within women’s footwear. With women’s footwear supplying most of Caleres’ sales, category-specific product and brand decisions can influence the commercial performance of its wider portfolio.
Kids’ footwear is forecast to be the fastest-growing segment, at a CAGR of 4.4% over 2027-2032. 361 Degrees International Limited reported 11.7% year-over-year growth in its Kids footwear revenue for the six months ended June 30, 2026. The group’s revenue and results primarily came from sales in China. A dedicated kids’ footwear business can address the young wearer’s fit and the adult buyer’s product choice through separate design and communication decisions. Within a China-focused group, growth in children’s shoes can diversify the sources of footwear revenue by buyer and wearer, beyond the adult sports customer.
By Category:
Mass Access and Year-Round Premium PositioningMass footwear was the largest segment, with an 87.22% share in 2026. UK footwear retailer Shoe Zone offers low-price shoes for the whole family and reports average annual retail sales of 12.8 million pairs. Its business spans town-center stores, retail parks, and digital retailing. A family-wide offer gives the retailer several footwear needs to address within the same low-price position.
Premium footwear is forecast to be the fastest-growing segment, with a CAGR of 4.3% over 2027-2032. Deckers Outdoor Corp.’s premium HOKA brand reported net sales of USD 703.5 million for the quarter ended June 30, 2026, up 7.7% year over year. HOKA sells performance footwear, apparel, and accessories, and Deckers describes its footwear line as year-round. An ongoing performance franchise offers premium footwear suppliers a way to maintain a recognizable selling proposition across seasons while extending the same brand into complementary apparel and accessories.
By Distribution Channel:
Specialty Networks and Digital Revenue GrowthSpecialty stores were the largest segment, with a 57.36% share in 2026. DEICHMANN reported around 4,700 physical stores and 40 online shops in more than 30 countries in March 2026. The group sold around 180 million pairs globally in 2025 across its store and online business. For footwear specialists, an established branch base offers a physical route to customers alongside the related digital offer. Together, those channels make the specialist store network part of a wider dedicated shoe-retail business, preserving a role for physical reach as digital sales develop.
Online retail stores are the fastest-growing segment, with a forecast CAGR of 5.2% over 2027-2032. India’s Metro Brands, a footwear and accessories retailer, reported e-commerce sales growth of about 11% year over year in H1 FY2026-27, including omnichannel transactions. In an April 2025 U.S. footwear consumer survey, 60% of respondents indicated purchase intent for athletic footwear from online-only retailers and 62% for non-athletic footwear. Stated intent spans both footwear types, while Metro Brands’ digital revenue growth shows that online expansion can include store-based footwear retailers.
Geography Analysis
North America Footwear Market
North America accounted for 31.23% of the footwear market size in 2026. NIKE Brand’s North America footwear revenue was USD 13.3 billion in fiscal 2026, up 5% from fiscal 2025 in both reported and currency-neutral terms, through wholesale and NIKE Direct channels. Its regional results included the distinct NIKE and Jordan brands, placing more than one footwear identity within the substantial company revenue base. Serving that base can require channel-specific brand execution, so winning independent wholesale accounts and sustaining demand through the brand’s own direct channel are different commercial tasks in North America.
South America Footwear Market
South America is forecast to be the fastest-growing geography, with a CAGR of 4.65% over 2027-2032. Vulcabras reported growth in its Brazilian domestic business in Q2 2026 compared with Q2 2025. The company linked its Q1 2026 athletic-footwear performance to consistent demand across 3 brands and production capacity expansion implemented during 2025. Capacity investment provides an operating route to serving additional footwear demand, linking brand performance with the ability to make more pairs.
Europe was Adidas’ home market and its largest region by net sales in 2025. In Asia-Pacific, Adidas opened Originals flagship stores in culturally relevant neighborhoods in Seoul and Shanghai in 2025, displaying many locally exclusive products. Those city-specific assortments can make the retail footprint a tool for product localization as well as distribution. Within Middle East and Africa, South Africa’s reported footwear exports to destinations outside Botswana, Eswatini, Lesotho, and Namibia totaled 3.69 million pairs in 2025. These examples show distinct commercial bases, with Adidas’ home-market sales position in Europe, locally exclusive flagship ranges in Seoul and Shanghai, and South African export volume.
Mordor Intelligence provides coverage of the footwear market across other key regional markets, including North America, each with their regulatory frameworks and demand patterns.
Regulatory Framework and Outlook
This comparison examines selected jurisdictions from the perspective of new footwear manufacturers and importers seeking market entry. The covered rules address different shoe types, from children’s footwear to protective products, so commercial effects follow each instrument’s product scope. The United Kingdom column covers the Great Britain framework. Policy attractiveness reflects the entry work under these requirements, while direction reflects announced changes affecting that work.
Regulatory Table of Footwear Market
| Decision factor | United States | United Kingdom | China | Brazil | South Africa |
|---|---|---|---|---|---|
| Primary authority | U.S. Consumer Product Safety Commission (CPSC) | Local Trading Standards and the Secretary of State for GB safety | Ministry of Emergency Management for protective footwear | Inmetro | National Regulator for Compulsory Specifications (NRCS) |
| Key instruments or direction | Certificate e-filing for covered children’s shoe imports | Footwear composition labeling; GB General Product Safety Regulations 2005 | GB 20098-2025 protective-footwear standard; proposed mandatory welding-footwear standard | Ordinance 459/2025 makes ABNT NBR 16679:2018 labeling compulsory | VC 9002 safety-footwear approval and referenced-standards framework |
| Commercial effect | Importers e-file certificates for covered imports from July 8, 2026; entries from foreign trade zones for consumption or warehousing from January 8, 2027 | Material labeling and safety duties; proactive-duty framework proposed March 2026, with consultation closed June 23, 2026 | Mandatory protective-footwear requirements from September 1, 2026; welding standard under approval with planned January 1, 2028 implementation | Noncompliant domestic and imported footwear sales permitted through December 30, 2026; later commercial sales must comply | South African legal-entity manufacturer/importer applicants must obtain approval for each safety-footwear type after conformity review |
| Current policy attractiveness | Medium | High | Medium | Medium | Low |
| Future direction of policy attractiveness | Hardening | Hardening | Hardening | Hardening | No change |
| Source: Mordor Intelligence | |||||
U.S. and Brazilian entry work becomes more prescriptive as existing certification and labeling scopes gain broader filing and sales-cutoff applications, respectively. Great Britain’s higher current rating reflects its defined labeling and safety framework, while the March 2026 proactive-duty proposal points toward more prescriptive supply-chain obligations. China’s protective-footwear rating reflects mandatory product requirements and a welding-footwear project under approval with planned implementation on January 1, 2028. South Africa’s lower entry rating reflects local-applicant and per-type approval duties, while continuity follows from an existing approval route and a standing standard-update process.
Value Chain Stages
The value chain compares where footwear specifications, material formulation, manufacturing, and distribution create supplier revenue. In 2025, Adidas supplied specifications to independent partners and outsourced almost all production across its footwear, apparel, and accessories business. Nike had 205 strategic Tier 2 material suppliers for footwear and apparel as of May 31, 2026, and its contract manufacturers bought the principal production materials. This division makes a footwear specification a coordination point between brand-controlled design and partner-controlled purchasing, tying material choices to the factory capabilities needed to execute them.
Value Chain Analysis Table of Footwear Market
| Primary activity | Key participants | Value capture | Bottleneck | Resilience response |
|---|---|---|---|---|
| Product design and specification | Footwear brand owners such as Adidas AG and Nike, Inc. | Branded product sales | Translating intended use into manufacturable specifications | Align technical specifications with production partners before committing volume |
| Material formulation and supply | Footwear-material suppliers such as BASF SE | Footwear-material sales | Matching compound hardness to component requirements | Qualify grades against the requirements of each component |
| Footwear manufacturing | Footwear manufacturers such as Pou Chen Corporation and Yue Yuen Industrial (Holdings) Limited | Manufactured-footwear sales | 4 contract manufacturers made approximately 60% of NIKE Brand footwear in fiscal 2026 | Maintain qualified alternatives for brand-specific production programs |
| Distribution and retail | Direct-channel operators such as Nike, Inc.; branded distributors such as Adidas AG | Wholesale and retail product sales | Aligning execution across owned channels and independent wholesale accounts | Define channel responsibilities across the brand and independent accounts |
| Source: Mordor Intelligence | ||||
Concentrated allocation of a large brand’s footwear production gives qualified manufacturing capability strategic importance beyond the sale of an individual shoe. Keeping alternatives qualified can preserve a brand’s sourcing options when a particular production program becomes constrained. As materials change, coordinating compound selection with manufacturing specifications can increase the commercial importance of partners able to turn a design into repeatable production.
Competitive Landscape
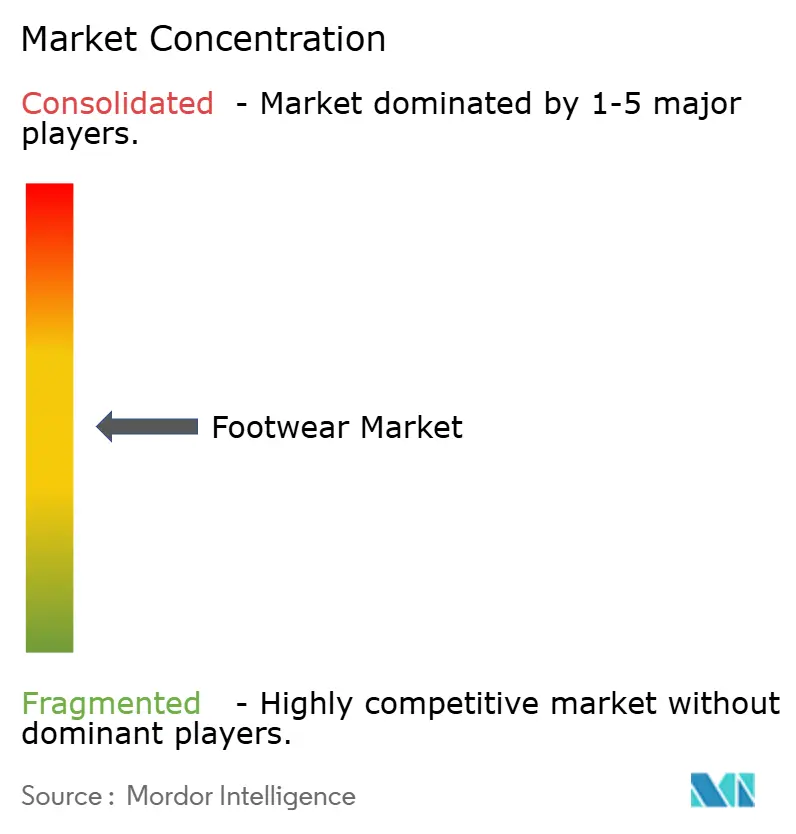
Large branded portfolios anchor competition, led in athletic footwear and apparel by Nike, Inc., the world’s largest seller in that combined category. Nike, Inc.’s NIKE Brand footwear revenue was USD 7 billion in the quarter ended August 31, 2026, its first quarter of fiscal 2027, down 6% on a currency-neutral basis from the prior-year quarter. Adidas AG markets athletic and sports lifestyle products, while Puma SE sells footwear, apparel, and accessories. Skechers USA, Inc., which 3G Capital acquired on September 12, 2025, designs, develops, and markets lifestyle and performance footwear, apparel, and accessories for men, women, and children. VF Corporation’s Vans brand offered performance and casual footwear and apparel through global wholesale and direct-to-consumer channels in fiscal 2026, within a portfolio including Timberland and The North Face.
Adidas global footwear revenue increased 2% on a currency-neutral basis in the first half of 2026 compared with the first half of 2025. That growth came despite a conservative sell-in approach. The company linked that approach to its focus on full-price business within a promotional marketplace. Adidas’ approach puts the commercial burden on persuading buyers to choose its footwear at full price, making product appeal central to its response to promotional competition.
In the first half of 2026, Puma SE’s footwear sales fell 6.9% year over year on a currency-adjusted basis, while On Holding AG’s shoe sales rose 11.5% in reported terms. On October 7, 2026, Anta Sports Products Ltd. completed its acquisition of a 29.06% stake in Puma SE from Artémis SAS, becoming its largest shareholder. Completion followed receipt of all relevant regulatory approvals and fulfillment of customary closing conditions. Anta became Puma’s largest shareholder after a first half in which Puma’s footwear sales fell and On’s shoe sales rose.
Footwear Industry Leaders
-
Nike, Inc.
-
Adidas AG
-
Puma SE
-
Skechers USA, Inc.
-
VF Corporation
- *Disclaimer: Major Players sorted in no particular order
Footwear Market Companies Covered in this Report
- Nike, Inc.
- Adidas AG
- Puma SE
- VF Corporation
- Skechers USA, Inc.
- ASICS Corporation
- Under Armour, Inc.
- New Balance Athletics, Inc.
- Deckers Outdoor Corp.
- Anta Sports Products Ltd.
- Li-Ning Company Ltd.
- ABC-MART
- Kering SA (Gucci)
- Wolverine World Wide, Inc.
- Misto Holdings Corp.
- LVMH Moët Hennessy Louis Vuitton SE (Louis Vuitton)
- Brooks Sports, Inc.
- Bata India
- Columbia Sportswear Company
- Crocs, Inc.
Key Opportunities for Market Participants
The opportunities below compare ways to keep usable footwear commercially saleable under the EU’s changing treatment of unsold stock. From July 19, 2026, EU rules prohibited large companies from destroying unsold clothes, clothing accessories, and footwear. Medium-sized companies become covered from 2030, while specified destruction derogations require evidence and reporting. This change gives footwear sellers a reason to recover value from suitable pairs and prevent avoidable residual stock.
Market Opportunities Table of Footwear Market
| Opportunity | Why now | Buyer / lead segment | Recommended play | Main barrier | Likely beneficiaries |
|---|---|---|---|---|---|
| Inspected returned-footwear resale | Large-company destruction prohibition applied in July 2026 | EU footwear retailers with suitable returned pairs | Inspect, clean, grade, and resell suitable returned shoes | Processing cost relative to each pair’s resale value | Footwear resale operators such as Nike, Inc. |
| Restore repairable unsold footwear | Damage derogation tests repair and refurbishment feasibility | EU sellers holding damaged but recoverable shoes | Price restoration work against expected shoe resale value | Technical feasibility and restoration economics | Footwear refurbishers and sellers able to recover saleable pairs |
| Staged supply of replenishable footwear | Prevention duty accompanies the July 2026 prohibition | EU footwear brands and retailers | Offer staged orders for repeatable footwear ranges | Matching production commitments to uncertain sell-through | Footwear producers able to support staged supply |
| Source: Mordor Intelligence | |||||
Nike Refurbished resells returned gently worn, like-new, or slightly imperfect Nike footwear and apparel after inspection and cleaning. For covered unsold apparel, clothing accessories, and footwear made unacceptable for consumer use by damage, the EU permits destruction only when repair and refurbishment are not technically feasible or cost-effective. Operators relying on that derogation must retain specified evidence for 5 years and provide it to authorities on request. The central opening is to turn technically recoverable shoes into saleable stock while pricing restoration work against the value of each pair.
Recent Industry Developments in Footwear Market
- Oct 2026: Nike released the Hybrid RN training shoe globally on Nike.com on October 8, for workouts combining running, lifting, and dynamic movement.
- Oct 2026: Anta Sports Products Ltd. completed its acquisition of a 29.06% stake in Puma SE from Artémis SAS on October 7, becoming its largest shareholder. Completion followed all relevant regulatory approvals and fulfillment of customary closing conditions.
- Sep 2026: Nike announced September 17 as the early, limited online release date for its Alphafly 4 marathon shoe, with broader online and select-retail availability scheduled for October 29.
Footwear Market Report Scope and Research Methodology
Market Definition and Coverage
The global footwear market measures annual retail spending on footwear sold to end users worldwide. Sales are classified by footwear type, end user, price category, distribution channel, and geography.
Scope exclusions: Hosiery and apparel, separately sold shoe-care products, separately sold replacement footwear parts, raw materials sold to footwear manufacturers, and footwear repair and maintenance services are excluded.
Segments Covered in This Report
- By Product Type
- Athletic Footwear
- Running Shoes
- Sports Shoes
- Trekking/Hiking Shoes
- Other Athletic Footwear
- Non-Athletic Footwear
- Boots
- Flip-Flops/Slippers
- Sneakers
- Other Non-Athletic Footwear
- Athletic Footwear
- By End User
- Men
- Women
- Kids
- By Category
- Mass
- Premium
- By Distribution Channel
- Supermarkets/Hypermarkets
- Specialty Stores
- Online Retail Stores
- Other Distribution Channels
- By Geography
- North America
- United States
- Canada
- Mexico
- Rest of North America
- Europe
- Germany
- United Kingdom
- France
- Italy
- Spain
- Russia
- Netherlands
- Belgium
- Sweden
- Rest of Europe
- Asia-Pacific
- China
- India
- Japan
- South Korea
- Australia
- Indonesia
- Rest of Asia-Pacific
- South America
- Brazil
- Argentina
- Colombia
- Rest of South America
- Middle East and Africa
- Saudi Arabia
- United Arab Emirates
- Turkey
- South Africa
- Rest of Middle East and Africa
- North America
Data Sources, Market Sizing, and Validation
Desk Research
Public sources such as the World Footwear Yearbook from APICCAPS, national customs and trade-statistics agencies, the U.S. Census Bureau, Eurostat, and patent offices help track footwear production, consumption, retail activity, cross-border flows, and product innovation. Trade flows and industry output provide checks on supply and geography, while retail and household statistics help frame end-user demand. Patents and technical literature illuminate changes in materials, comfort, and performance.
Company filings, investor presentations, and reputable business press can add detail on footwear sales, price mix, channel exposure, sourcing, and regional performance, with company measures treated as cross-checks rather than market totals. These sources are illustrative and are not exhaustive, and further sources inform collection, validation and clarification.
Primary Interviews and Surveys
Structured interviews with footwear brand, retail, manufacturing, and distribution executives can test the interpretation of public evidence on consumer sales, price tiers, product mix, and channel coverage. Survey responses and follow-up questions can clarify gaps in regional or segment evidence, while comparing independent respondent views with retail, company, and trade indicators helps identify estimates requiring further review.
Distribution of primary research fieldwork respondents
| Company type | Respondent position | Region |
|---|---|---|
| Top tier: 34% | CXOs: 20% | APAC: 40% |
| Mid tier: 46% | Functional/Unit leaders: 35% | EMEA: 30% |
| Smaller Players: 20% | Managers: 45% | Americas: 30% |
Market-Sizing & Forecasting
The estimate starts with a top-down view of global end-user footwear retail spending and divides the total across product type, end user, category, channel, and geography. A practical demand model tracks population and household spending, footwear pairs consumed, replacement frequency, average retail prices, and the mix of athletic, casual, and premium products. Trade and production data check whether regional supply and consumption patterns are plausible. Historical series support a multivariate regression, with scenario analysis for changes in discretionary spending, input-cost pass-through, and online-channel growth. Segment shares follow observed sales mix and documented regional and channel patterns, then reconcile to the market total. Selective bottom-up checks can compare sampled retail pairs and average selling prices or roll up available supplier and retailer disclosures, with missing observations bounded using comparable markets and public indicators. Interviews can test whether forecast assumptions for replacement, prices, product mix, and channel shifts reflect commercial conditions, and resulting adjustments are checked against independent demand and supply signals.
Data Validation & Update Cycle
Analysts triangulate retail and household indicators with production, trade, and company disclosures, then investigate outliers, inconsistent units, and unexplained year-over-year or regional movements before sign-off. A second analyst reviews source lineage, calculations, segment reconciliations, and forecast assumptions. Unresolved material differences trigger source checks or respondent re-contact where suitable. The dataset is refreshed annually, reassessed between cycles after material changes in trade, consumer demand, regulation, or supply, and receives a final evidence and calculation review before delivery.
Mordor Intelligence's Footwear Market Size Versus Other Published Estimates
Published estimates can differ in the transactions and products they count and the inputs used to model demand. The global footwear market measures annual retail spending on footwear sold to end users worldwide.
Key Gap Drivers include the study's defined coverage and market-specific modeling choices. A practical demand model tracks population and household spending, footwear pairs consumed, replacement frequency, average retail prices, and the mix of athletic, casual, and premium products.
Benchmark comparison
| Source | Market Size | Gaps in Research Methodology |
|---|---|---|
| Mordor Intelligence | USD 413.9 B (2027) | |
| Industry Consultancy A | USD 476.8 B (2025) | At its 2025 base, this estimate is 15.2% above this report's 2027 value of USD 413.9 B, 2 years later. Its reported revenue series gives greater weight to premium and luxury demand, which the source identifies as a footwear spending trend. |
| Regional Consultancy B | USD 364.4 B (2027) | At its 2027 base, this estimate is 12.0% below this report's 2027 value of USD 413.9 B. Its retail-sales forecast covers fashion and casual footwear plus athletic footwear and applies a 2.9% annual growth assumption for 2022-2027. |
Mordor Intelligence's analysts triangulate retail and household indicators with production, trade, and company disclosures, then investigate outliers, inconsistent units, and unexplained year-over-year or regional movements before sign-off.
Key Questions Answered in the Report
What is the footwear market size and growth outlook?
The market is expected to reach USD 413.9 billion in 2027 and USD 482.1 billion by 2032, growing at a CAGR of 3.1% over 2027-2032.
What is driving demand for athletic and athleisure shoes?
In a June 2026 U.S. survey, back-to-school consumers expected net spending on athletic and athleisure shoes to rise 11% from 2025.
Which is the largest footwear product segment?
Non-athletic footwear accounted for 56.65% of the global market in 2026, making it the largest product segment.
Which companies compete in the footwear industry?
Major companies include Nike, Inc., Adidas AG, Puma SE, Skechers USA, Inc., and VF Corporation.
What is a key cost challenge for shoe brands?
Nike said in its fiscal 2026 filing that raw-material availability and price volatility had adversely affected costs, gross margins, and profitability.
Which regions lead footwear sales and forecast growth?
North America led with a 31.23% share of the global market in 2026. South America is forecast to grow fastest at a CAGR of 4.65% over 2027-2032.