Synthetic Diamond Market Size and Share
Market Overview
| Study Period | 2021 - 2031 |
|---|---|
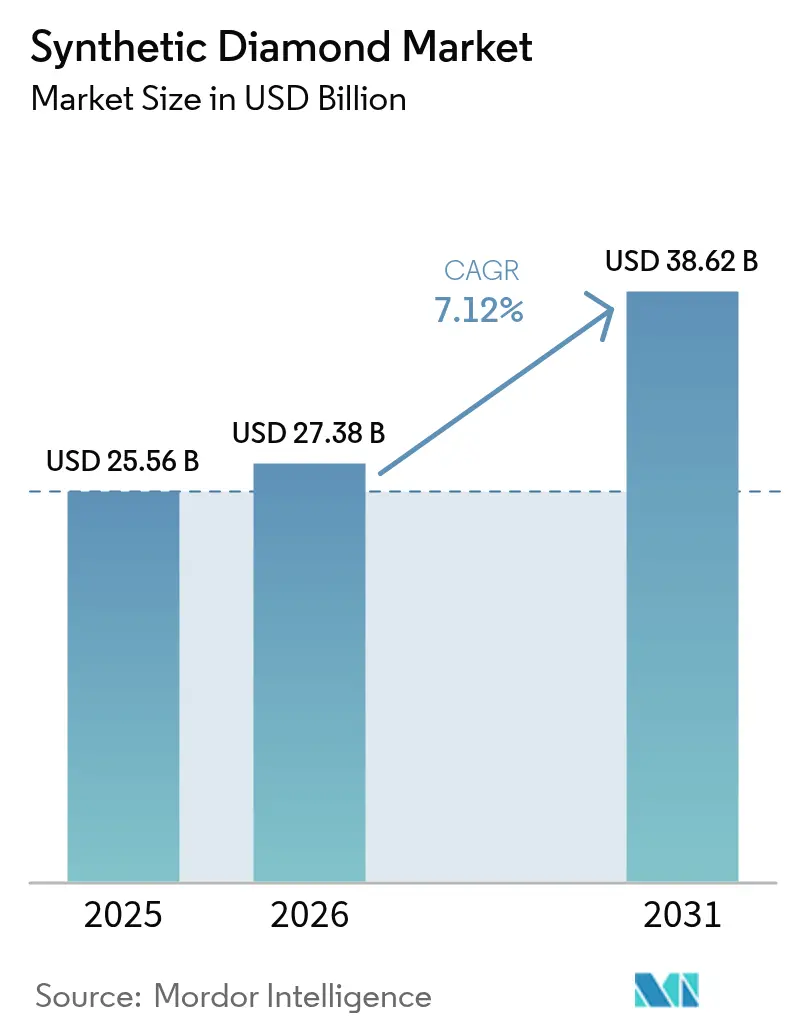
| Market Size (2026) | USD 27.38 Billion |
| Market Size (2031) | USD 38.62 Billion |
| Growth Rate (2026 - 2031) | 7.12% CAGR |
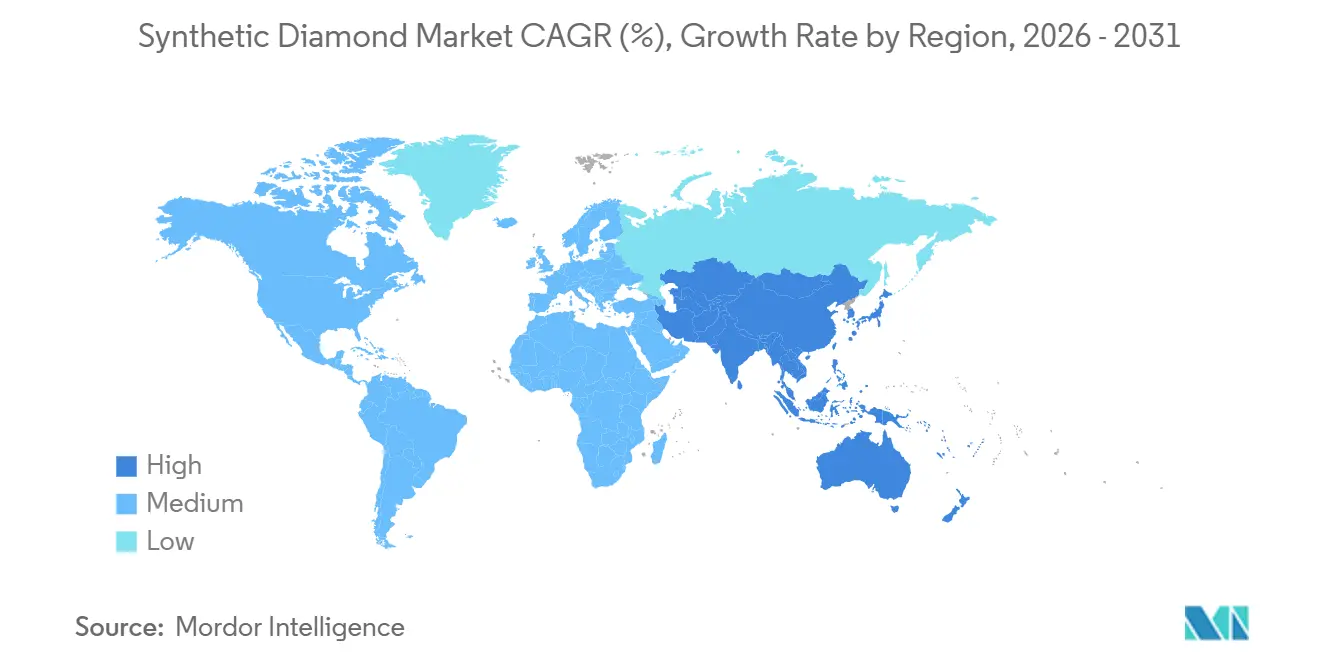
| Fastest Growing Market | Asia Pacific |
| Largest Market | Asia Pacific |
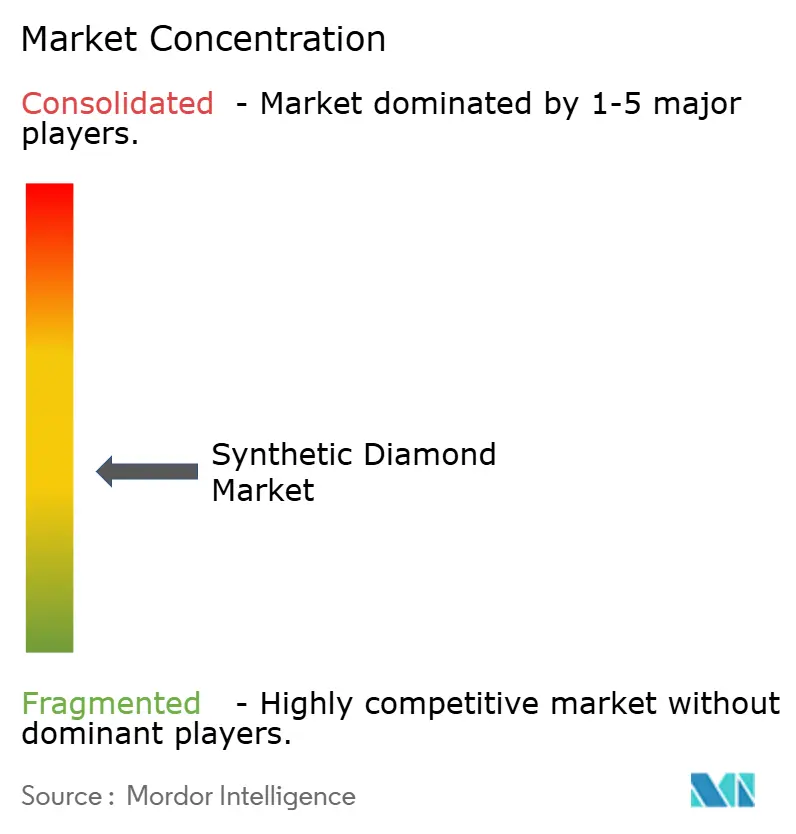
| Market Concentration | Medium |
Major Players *Disclaimer: Major Players sorted in no particular order Image © Mordor Intelligence. Reuse requires attribution under CC BY 4.0. | |
Synthetic Diamond Market Analysis by Mordor Intelligence
The Synthetic Diamond Market size was valued at USD 25.56 billion in 2025 and is estimated to grow from USD 27.38 billion in 2026 to reach USD 38.62 billion by 2031, at a CAGR of 7.12% during the forecast period (2026-2031). Demand for 5G/6G base-station components, battery gigafactories, and quantum-sensor prototypes is expanding revenue opportunities beyond the traditional jewelry segment. Meanwhile, rough stones continue to serve as a key revenue driver for construction and drilling applications. High Pressure High Temperature (HPHT) production helps maintain low unit costs for industrial abrasives. However, the significant increase in Chemical Vapor Deposition (CVD) investments highlights the growing importance of factors such as purity, wafer diameter, and thermal conductivity in achieving competitive advantage. The Asia-Pacific region leads the market, driven by China's extensive HPHT production clusters and India's export incentives. In contrast, North American growth is supported by defense procurement and energy-efficient semiconductor initiatives. Despite the positive outlook for the synthetic diamond market, challenges such as high capital intensity, evolving consumer perceptions, and issues related to thick-film thermal management remain key concerns.
Key Report Takeaways
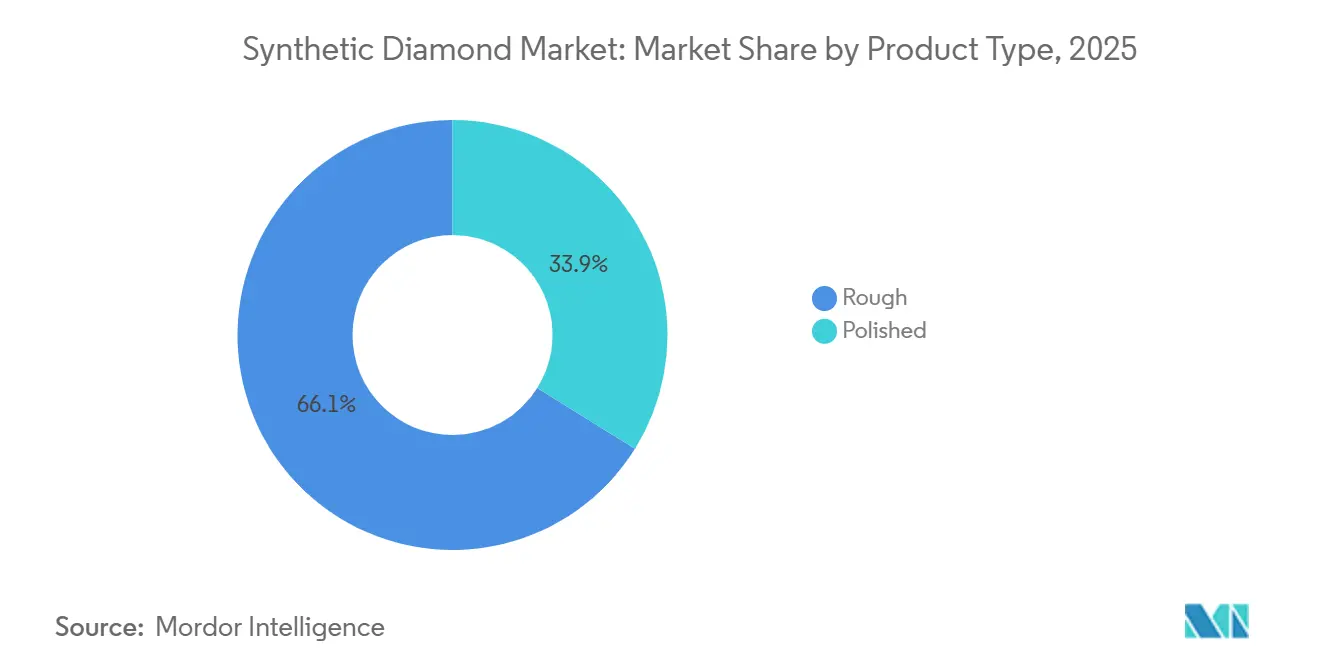
- By product type, rough diamonds led with 66.12% of the synthetic diamond market share in 2025, while polished diamonds are advancing at a 9.41% CAGR through 2031.
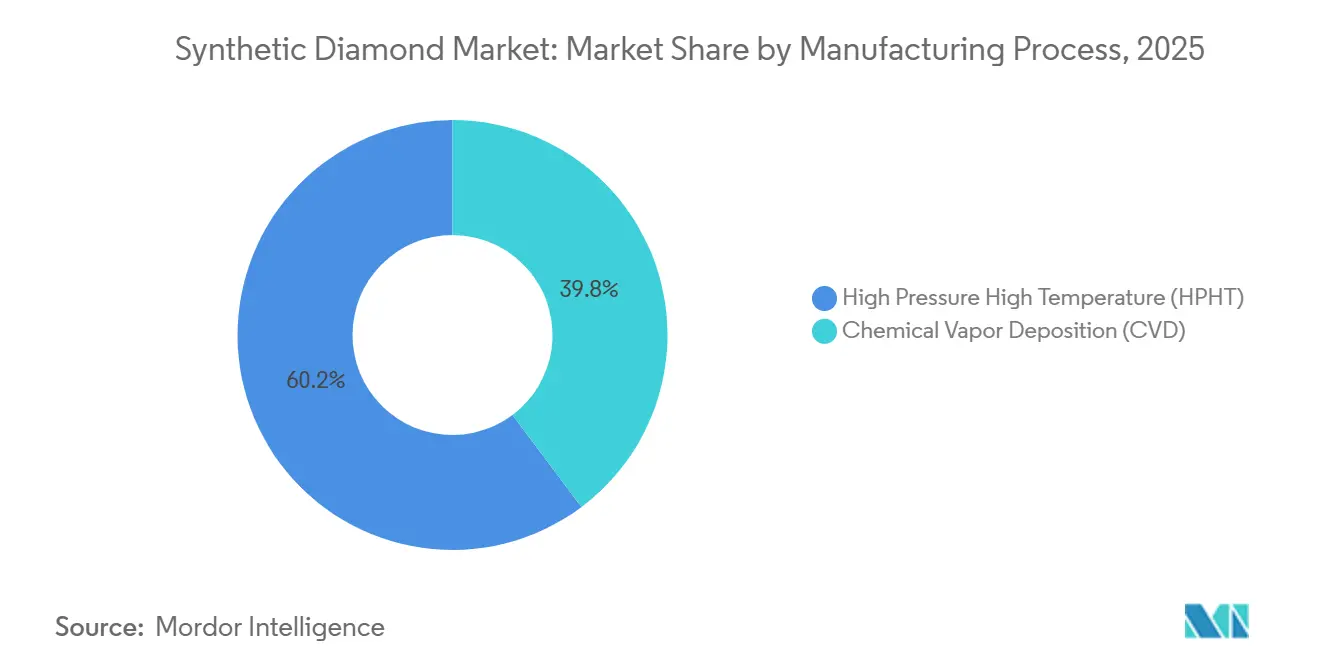
- By manufacturing process, High Pressure High Temperature (HPHT) accounted for 60.24% of the synthetic diamond market share in 2025; Chemical Vapor Deposition (CVD) is projected to expand at a 10.56% CAGR through 2031.
- By geography, Asia-Pacific captured 56.67% of the synthetic diamond market share in 2025 and is forecast to grow at a 8.15% CAGR through 2031.
Note: Market size and forecast figures in this report are generated using Mordor Intelligence’s proprietary estimation framework, updated with the latest available data and insights as of 2026.
Global Synthetic Diamond Market Trends and Insights
Drivers Impact Analysis*
| Driver | (~) % Impact on CAGR Forecast | Geographic Relevance | Impact Timeline |
|---|---|---|---|
| Rising demand for CVD diamonds in 5G/6G RF filters | +1.1% | Global, led by North America, APAC (China, South Korea, Japan) | Medium term (2-4 years) |
| Industrial-grade diamond surge from EV battery gigafactories | +1.4% | APAC core (China, South Korea), spill-over to North America, Europe | Short term (≤ 2 years) |
| Growth in super-abrasives for automated CNC machining | +0.9% | Global, concentrated in Germany, Japan, United States | Long term (≥ 4 years) |
| Luxury brands' sustainability shift to lab-grown fancy-color stones in GCC | +0.7% | Middle-East (UAE, Saudi Arabia, Qatar), spill-over to Europe | Medium term (2-4 years) |
| HPHT nanodiamond use in quantum-sensing chipsets | +0.8% | North America, APAC (Japan, South Korea), Europe (Germany, UK) | Long term (≥ 4 years) |
| Source: Mordor Intelligence | |||


Rising Demand for CVD Diamonds in 5G/6G RF Filters
Diamond's thermal conductivity, which is about five times higher than copper, enables GaN amplifiers to function at greater power densities without overheating. This benefit was demonstrated in Verizon and AT&T's 2024 trials of diamond-backed RF modules, which showed an 18% increase in component lifespan and a 12% reduction in cooling expenses. The 2025 collaboration between Element Six and Orbray to commercialize 100 mm GaN-on-diamond wafers is aimed at millimeter-wave base stations, expected to be deployed in large volumes before 6G standards are introduced by 2028. Furthermore, Japan's communications ministry allocated JPY 30 billion (USD 200 million) in subsidies to boost telecom-grade CVD capacity, reducing dependence on HPHT-heavy Chinese supply chains for domestic OEMs. These advancements are driving revenue within the synthetic diamond market toward high-margin substrates instead of gemstones.
Industrial-Grade Diamond Surge from EV Battery Gigafactories
Electrode-slurry mixers with diamond-tipped impellers have a lifespan ten times longer than tungsten-carbide blades, a durability advantage that led companies such as CATL, LG Energy Solution, and Samsung SDI to adopt diamond tooling for new production lines in China and Korea starting in 2025. Similarly, separator-film laser optics rely on diamond heat sinks to prevent thermal lensing. With the 1,200 GWh of annual cell output by 2030, each new gigafactory represents USD 2-5 million in recurring diamond tooling demand, providing stability to the synthetic diamond market amid fluctuations in jewelry demand[1]International Energy Agency, “Battery Manufacturing Outlook 2030,” iea.org.
Growth in Super-Abrasives for Automated CNC Machining
Diamond wheels process aerospace-grade Inconel 40% faster than cBN alternatives while reducing heat generation. This efficiency has led Germany's EUR 15 billion machine-tool export sector to standardize diamond tooling for electric-motor housings. Sandvik's USD 1.9 billion acquisition of Hyperion Materials in 2024 integrated super-abrasive consumables with CNC software capable of auto-tuning feed rates, creating a lock-in effect for OEMs. Automated, lights-out factories rely on such dependable solutions during unmanned night shifts, further driving industrial demand for synthetic diamonds.
Luxury Brands’ Sustainability Shift to Lab-Grown Fancy-Color Stones in GCC
Damas Jewellery's 2024 launch of nitrogen-doped yellow CVD diamonds, priced 60% lower than natural equivalents, appealed to ethically conscious millennial buyers in Dubai. Swarovski introduced a blockchain-verified lab-grown flagship in 2025 to leverage the GCC's 8% jewelry market growth. Meanwhile, Saudi Arabia allocated SAR 500 million to support domestic CVD producers under Vision 2030. The region's Sharia-compliant focus on provenance has turned sustainability into a premium feature, creating a niche market for synthetic diamonds in the GCC.
Restraints Impact Analysis*
| Restraint | (~) % Impact on CAGR Forecast | Geographic Relevance | Impact Timeline |
|---|---|---|---|
| High capex-intensive manufacturing | -0.8% | Global, acute in North America and Europe | Short term (≤ 2 years) |
| Consumer confusion over LGD price depreciation vs. natural diamonds | -0.6% | North America, Europe, select APAC markets | Medium term (2-4 years) |
| Thermal management issues in thick-film CVD wafers more than 1 mm | -0.5% | Global, concentrated in semiconductor hubs (US, Japan, South Korea, Taiwan) | Medium term (2-4 years) |
| Source: Mordor Intelligence | |||
High Capex-Intensive Manufacturing
A commercial CVD plant with 25 reactors requires an investment of USD 50-80 million, while HPHT presses necessitate high-voltage infrastructure, adding an additional USD 10 million in site preparation costs. These capital-intensive requirements limit market entry to well-funded firms. For instance, Diamond Foundry's EUR 2.35 billion wafer facility in Spain was made possible only through the European Investment Bank's underwriting of EUR 800 million in debt, a scale unattainable for most new entrants. Additionally, electricity tariffs favor hydropower regions, influencing the geographic concentration of synthetic diamond production.
Consumer Confusion Over LGD Price Depreciation vs. Natural Diamonds
Lab-grown diamond retail prices dropped by 35% between 2022 and 2025, diminishing the perceived value of engagement rings and leading to Pandora's exit from the category in 2024. The U.S. Federal Trade Commission (FTC) now requires retailers to disclose that lab-grown diamonds have "no resale value," a regulation intended to enhance transparency but one that also dampens discretionary jewelry demand[2]U.S. Federal Trade Commission, “Guides for the Jewelry Industry,” ftc.gov. Until secondary markets for lab-grown diamonds develop, growth in the jewelry segment will remain subdued compared to industrial applications, limiting overall expansion in the synthetic diamond market.
*Our forecasts treat driver/restraint impacts as directional, not additive. The impact forecasts reflect baseline growth, mix effects, and variable interactions.
Segment Analysis
By Product Type: Rough Diamonds Dominated, Polished Diamonds Expanded in Niche Applications
Rough diamonds accounted for 66.12% of revenue in 2025, driven by their use in construction saws, mining drill bits, and shale-well PDC cutters, which collectively supported the synthetic diamond market for heavy-industry applications. A single highway resurfacing project required up to 200 kg of diamond grit, while Baker Hughes’ HPHT bits demonstrated an 18% faster drilling rate in the Permian Basin during 2025 trials. Price competition, particularly from Henan Huanghe Whirlwind, which increased its HPHT capacity by 12% in 2024, kept average selling prices in the range of USD 80-120 per carat, reinforcing rough diamonds' revenue leadership.
Polished diamonds posted a 9.41% CAGR through 2031, driven by applications in substrates, heat spreaders, and nanocrystalline coatings, which outpaced traditional jewelry uses. IBM’s NV-center quantum processor opened pathways for medical imaging and sensing, while orthopedic implants coated with diamond reached unit values of USD 5,000 per carat for ISO-13485-certified grades. These non-jewelry applications diversified the end markets, reducing the synthetic diamond market's dependence on fashion trends.

By Manufacturing Process: CVD Gained Momentum in High-Value Applications
High Pressure High Temperature (HPHT) accounted for 60.24% of revenue in 2025, primarily due to its cost-efficient production of abrasive grit and mid-clarity gems, which dominated commoditized applications. Zhengzhou Sino-Crystal’s 50 new presses, each producing 200 carats per month, emphasized durability over purity. With energy consumption at 150 kWh per carat, HPHT remained cost-competitive; however, it was limited to producing wafers no wider than 10 mm and could not achieve sub-ppm nitrogen levels.
Chemical Vapor Deposition (CVD) grew at a 10.56% CAGR through 2031, enabling the production of 150 mm wafers with nitrogen levels below 0.1 ppm, which were critical for RF filters and quantum sensors. In 2025, Element Six shipped 100 mm telecom-grade wafers, reducing chip-tiling yield losses. Despite challenges such as stress-cracking in wafers thicker than 1 mm, advancements in gradient-doping and multi-zone heating showed potential. As telecom OEMs increasingly specified diamond substrates for 6G rollouts, CVD's share of the synthetic diamond market expanded.
Geography Analysis
Asia-Pacific led the market with 56.67% of revenue in 2025, supported by China’s Henan HPHT super-clusters, where electricity costs averaged USD 0.04/kWh and presses operated at near full capacity. India’s 2024 export incentives, which granted lab-grown diamonds the same duty exemptions as software, attracted USD 800 million in investments, boosting the synthetic diamond market for Gujarat-based CVD exporters by 2028. Japan’s Sumitomo Electric, which supplied 40% of global semiconductor-grade wafers, added JPY 20 billion in capacity in 2025 to meet defense orders. Meanwhile, South Korea’s SK Materials formed a USD 300 million joint venture with Coherent to localize supply near Samsung fabs.
North America benefited from a USD 550 billion U.S.-Japan tech pact and Diamond Foundry’s vertically integrated Oregon facility, which shipped 50,000 carats of aerospace-grade wafers in 2025. Canada’s Lucara partnered with New Diamond Technology to establish a CAD 100 million HPHT plant leveraging low-carbon hydro energy, diversifying regional feedstock. While Mexico and the U.S. Gulf Coast remained focused on downstream jewelry finishing, federal critical-material designations drove investments toward wafer-grade CVD facilities.
In Europe, growth centered around Diamond Foundry’s EUR 2.35 billion wafer hub in Spain, Germany’s demand for super-abrasives, and the UK’s hallmarking regime, which labeled lab-grown pieces as “LG,” gaining consumer acceptance. South America, and Middle-East and Africa exhibited focused growth pockets. Brazil reduced import tariffs on synthetic rough diamonds to establish a USD 200 million export trade, while Saudi Arabia funded local CVD production as part of Vision 2030. South Africa retained Element Six R&D operations but shifted large-scale production to lower-cost regions, reflecting broader market realignments.

Competitive Landscape
The market remained moderately fragmented, with over 30 regional suppliers, while electronics-grade wafers were concentrated among five integrated firms, including Element Six, Sumitomo Electric, Coherent, Diamond Foundry, and Applied Diamond. These companies held critical CVD patents and operated ISO-certified clean rooms. Sandvik’s 2024 acquisition of Hyperion combined tooling hardware with CNC analytics, creating barriers to entry. New entrants leveraged modular “microfactories” from ADAMAS ONE, costing USD 3 million and producing 10,000 carats annually for boutique jewelers, bypassing traditional wholesale channels.
Technological advancements focused on vapor-chemistry improvements that could reduce CVD cycle times by 30%, lowering costs by USD 100 per carat and enhancing jewelry economics. Patent filings from 2024-2025 revealed that Element Six, IBM, and Lockheed held 60% of granted NV-center intellectual property, creating significant barriers for new quantum-sensor entrants. Additionally, ISO drafted a thermal-conductivity test standard (ISO/DIS 24234), favoring firms with in-house metrology capabilities. Overall, competitive positioning in the synthetic diamond market depended on capital resources, intellectual property portfolios, and targeted end-market strategies.
Synthetic Diamond Industry Leaders
De Beers Group (Element Six)
Henan Huanghe Whirlwind CO.,Ltd.
Sumitomo Electric Industries, Ltd.
Zhengzhou Sino-Crystal Diamond Co., Ltd.
Diamond Foundry
- *Disclaimer: Major Players sorted in no particular order

Recent Industry Developments
- December 2025: Diamond Foundry invested approximately EUR 2.35 billion (USD 2.58 billion) in a synthetic diamond wafer facility in Trujillo, Spain. Supported by the Spanish government and EU funding, the facility was designed to become Europe's largest high-tech diamond hub for semiconductors, manufacturing single-crystal diamond (SCD) wafers for 5G, electric vehicles (EVs), and power electronics.
- June 2024: De Beers Group (Element Six) and Orbray collaborated to manufacture high-quality, wafer-scale single-crystal (SC) synthetic diamonds. The partnership combined Element Six's large-area deposition technology with Orbray’s heteroepitaxial sapphire process to focus on applications in 6G, AI, and power electronics, aiming to enhance thermal management and semiconductor performance.


Global Synthetic Diamond Market Report Scope
Synthetic diamonds, also known as artificial diamonds, are mainly fabricated through two processes, including the high-pressure, high-temperature (HPHT) process and the chemical vapor deposition (CVD) method. It finds its major application in end-user industries like construction, electronics, mining, oil and gas, and other industries.
The synthetic diamond market is segmented by product type, manufacturing process, and geography. By product type, the market is segmented into rough and polished. The rough type is further segmented into construction, mining, oil and gas, and other rough types. The polished type is further segmented into electronics, healthcare, and other polished types. By manufacturing process, the market is segmented into high pressure high temperature (HPHT) and chemical vapor deposition (CVD). The report also covers the market size and forecasts for the synthetic diamond in 16 countries across major regions. For each segment, the market sizing and forecasts have been done on the basis of value (USD).
| Rough | Construction |
| Mining | |
| Oil and Gas | |
| Other Rough Types | |
| Polished | Jewelry |
| Electronics | |
| Healthcare | |
| Other Polished Types |
| High Pressure High Temperature (HPHT) |
| Chemical Vapor Deposition (CVD) |
| Asia-Pacific | China |
| India | |
| Japan | |
| South Korea | |
| ASEAN Countries | |
| Rest of Asia-Pacific | |
| North America | United States |
| Canada | |
| Mexico | |
| Europe | Germany |
| United Kingdom | |
| France | |
| Italy | |
| Spain | |
| NORDIC Countries | |
| Rest of Europe | |
| South America | Brazil |
| Argentina | |
| Rest of South America | |
| Middle-East and Africa | Saudi Arabia |
| South Africa | |
| Rest of Middle-East and Africa |
| By Product Type | Rough | Construction |
| Mining | ||
| Oil and Gas | ||
| Other Rough Types | ||
| Polished | Jewelry | |
| Electronics | ||
| Healthcare | ||
| Other Polished Types | ||
| By Manufacturing Process | High Pressure High Temperature (HPHT) | |
| Chemical Vapor Deposition (CVD) | ||
| By Geography | Asia-Pacific | China |
| India | ||
| Japan | ||
| South Korea | ||
| ASEAN Countries | ||
| Rest of Asia-Pacific | ||
| North America | United States | |
| Canada | ||
| Mexico | ||
| Europe | Germany | |
| United Kingdom | ||
| France | ||
| Italy | ||
| Spain | ||
| NORDIC Countries | ||
| Rest of Europe | ||
| South America | Brazil | |
| Argentina | ||
| Rest of South America | ||
| Middle-East and Africa | Saudi Arabia | |
| South Africa | ||
| Rest of Middle-East and Africa | ||


Key Questions Answered in the Report
What is the size of the synthetic diamond market?
The synthetic diamond market stands at USD 27.38 billion in 2026 and is projected to reach USD 38.62 billion by 2031.
Which region generated the highest revenue in 2025?
Asia-Pacific leads with 56.67% of 2025 revenue, anchored by China’s HPHT clusters and India’s incentive-backed CVD exporters.
What is driving the increased use of diamond in 5G and 6G hardware?
Diamond’s superior thermal conductivity allows GaN power amplifiers in base stations to operate at higher frequencies without overheating, extending component life and shrinking cooling budgets.
Why are lab-grown diamond prices falling?
Rapid capacity additions and cost declines have driven retail prices down about 35% since 2022, and secondary markets remain underdeveloped, pressuring jewellery margins.
Page last updated on:


