Platinum Group Metals Market Size and Share
Market Overview
| Study Period | 2021 - 2031 |
|---|---|
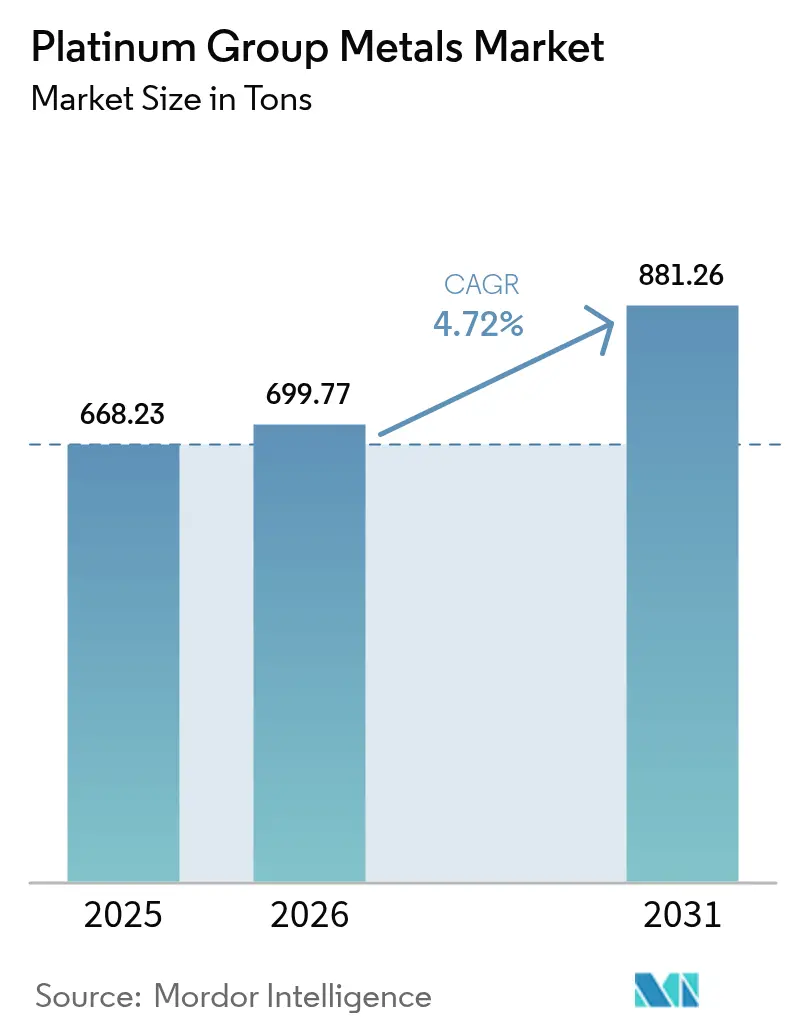
| Market Volume (2026) | 699.77 tons |
| Market Volume (2031) | 881.26 tons |
| Growth Rate (2026 - 2031) | 4.72% CAGR |
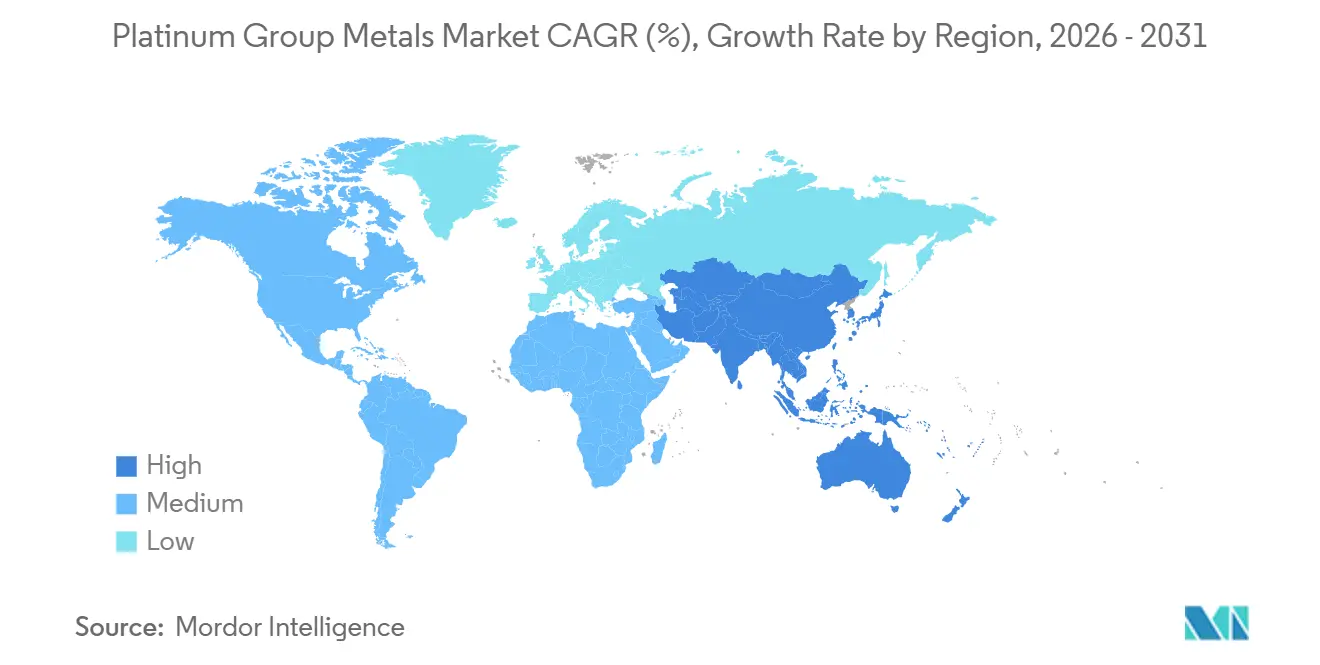
| Fastest Growing Market | Asia Pacific |
| Largest Market | Asia Pacific |
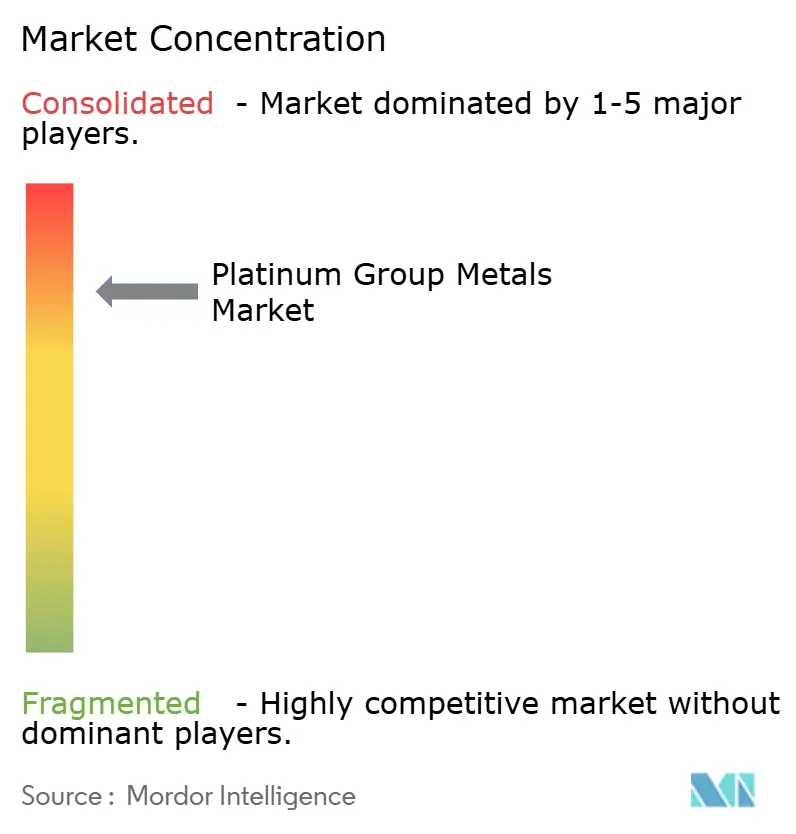
| Market Concentration | High |
Major Players *Disclaimer: Major Players sorted in no particular order Image © Mordor Intelligence. Reuse requires attribution under CC BY 4.0. | |
Platinum Group Metals Market Analysis by Mordor Intelligence
The Platinum Group Metals Market size was valued at 668.23 tons in 2025 and is estimated to grow from 699.77 tons in 2026 to reach 881.26 tons by 2031, at a CAGR of 4.72% during the forecast period (2026-2031). Demand keeps tilting away from legacy autocatalysts toward low-carbon technologies, especially hydrogen infrastructure, while advanced electronics unlock new use cases for ruthenium and iridium. Palladium’s 46.55% share in 2025 is slipping because gasoline-vehicle makers are engineering platinum-rich catalysts, whereas iridium’s 8.92% CAGR reflects proton-exchange-membrane (PEM) electrolyser growth in North America and Europe. Rhodium and ruthenium prices remain volatile, so original-equipment manufacturers (OEMs) are striking shorter offtake contracts to hedge exposure. Recycling economics are tightening the cost curve, secondary material already meets 57% of European Union demand and is forecast to capture more than one-third of global supply by 2031.
Key Report Takeaways
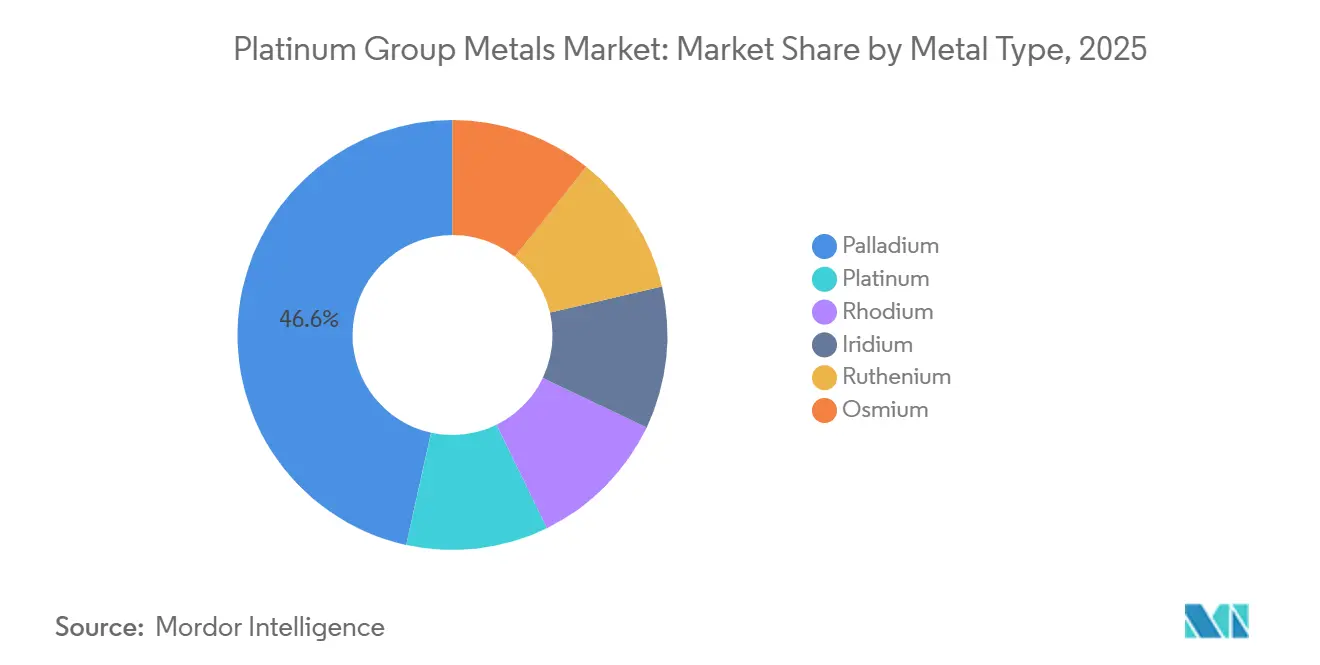
- By metal type, palladium led with 46.55% revenue share in 2025, whereas iridium is projected to expand at an 8.92% CAGR through 2031.
- By application, jewelry held 28.75% of the Platinum group metals market size in 2025, while fuel cells are advancing at a 28.47% CAGR to 2031.
- By source, primary mining supplied 71.40% of volume in 2025; secondary recycling is the fastest-growing source at a 7.08% CAGR through 2031.
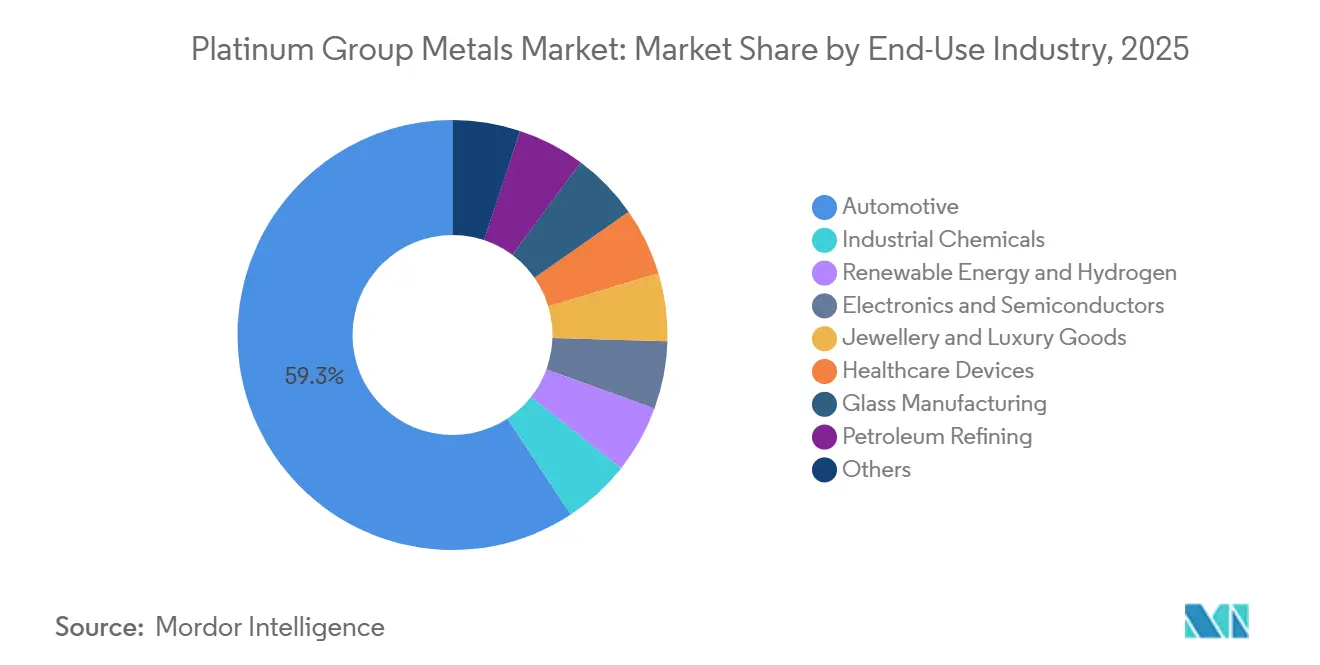
- By end-use industry, automotive accounted for 59.25% of the Platinum group metals market size in 2025; renewable energy and hydrogen applications are set to grow at a 9.32% CAGR between 2026-2031.
- By geography, Asia-Pacific commanded 51.60% of the Platinum group metals market share in 2025, and is projected to expand at a 5.03% CAGR through 2031
Note: Market size and forecast figures in this report are generated using Mordor Intelligence’s proprietary estimation framework, updated with the latest available data and insights as of 2026.
Global Platinum Group Metals Market Trends and Insights
Drivers Impact Analysis*
| Driver | (~) % Impact on CAGR Forecast | Geographic Relevance | Impact Timeline |
|---|---|---|---|
| Surging demand for autocatalysts in emerging-market ICE vehicles | +1.2% | Asia-Pacific (India, ASEAN), South America (Brazil, Argentina) | Medium term (2-4 years) |
| PEM-electrolyser build-out across North America and EU hydrogen hubs | +1.8% | North America, Europe | Long term (≥4 years) |
| IC substrate plating boom in high-end electronics (Ruthenium focus) | +0.9% | Global, concentrated in Asia-Pacific semiconductor hubs | Medium term (2-4 years) |
| Dual-metal upswing from Pd-for-Pt catalyst substitution | +0.6% | Global, strongest in North America and Europe automotive | Short term (≤2 years) |
| Platinum-based ammonia cracking solutions for maritime e-fuels | +0.4% | Europe, Asia-Pacific maritime corridors | Long term (≥4 years) |
| Source: Mordor Intelligence | |||


Surging Demand for Autocatalysts in Emerging-Market ICE Vehicles
India produced 4.2 million passenger vehicles in 2024, and BS-VI Phase 2 rules raised platinum group metal loadings more than 60% per unit to hit stringent nitrogen-oxide caps[1]International Council on Clean Transportation, “Global Vehicle Emissions Standards,” theicct.org. Thailand, Indonesia, and Vietnam together assembled about 4 million vehicles in 2024, and flex-fuel cars in Brazil added rhodium-rich catalysts to withstand higher combustion temperatures. Mexico’s 3.5 million-unit production for U.S. exports faces Tier 3 Bin 70 rules that prompt over-specification of metal content. The International Council on Clean Transportation foresees 12 million extra light-vehicle sales across emerging markets between 2026 and 2031, with internal-combustion engines still holding more than 70% share in price-sensitive segments.
PEM-Electrolyser Build-Out Across Hydrogen Hubs
Platinum demand for hydrogen climbed from 40 thousand ounces in 2023 to an expected 476 thousand ounces by 2028, with PEM systems contributing most of the rise. The US Inflation Reduction Act earmarked USD 7 billion for regional hubs that will consume 200-250 g of platinum and 15-20 g of iridium per MW by 2027. Europe’s Fit for 55 package targets 10 million t of renewable hydrogen by 2030, but iridium scarcity could cap PEM capacity at roughly 45 GW unless alternative electrolysis technologies scale.
IC Substrate Plating Boom in Advanced Electronics
Applied Materials and imec showed in 2024 that ruthenium liners improve resistance–capacitance by up to 71% in sub-5 nm interconnects, unlocking ruthenium demand of 18-22 t by 2026 as TSMC and Samsung shift to 3 nm logic[2]Applied Materials, “Ruthenium Barriers for Advanced Nodes,” appliedmaterials.com. Ruthenium’s 4.7 eV work function cuts leakage 40% against cobalt, critical for power-dense chiplet designs. Hard-disk drives released 8-10 t of platinum annually as shipments slowed, and semiconductor fabs absorbed the freed metal without supply strains.
Dual-Metal Upswing from Pd-for-Pt Catalyst Substitution
Palladium’s price collapse from USD 3,000 / oz in 2022 to USD 1,000 / oz in 2024 triggered 540-700 k oz of switching into platinum-heavy catalysts. Further substitution will be modest until the 2027-2028 model-year refreshes because formulations are frozen two years before launch. Diesel oxidation catalysts are already platinum-rich, and delayed Euro 7 rules will lift metal loadings another 10-15% from 2027.
Restraints Impact Analysis*
| Restraint | (~) % Impact on CAGR Forecast | Geographic Relevance | Impact Timeline |
|---|---|---|---|
| Persistent PGM price volatility constraining OEM offtake contracts | -0.8% | Global, acute in automotive and electronics | Short term (≤2 years) |
| Escalating energy and water intensity of deep-level South African mines | -1.1% | South Africa, spillover to global supply | Medium term (2-4 years) |
| Closed-loop recycling growth reducing primary metal demand | -0.7% | Europe, North America, Japan | Long term (≥4 years) |
| Source: Mordor Intelligence | |||
Persistent PGM Price Volatility Constraining OEM Contracts
Rhodium plunged 85% from USD 29,800 / oz in 2021 to USD 4,500 / oz in 2024, squeezing tier-one supplier margins by up to 500 bps as fixed contracts matured. Palladium’s 40% intrayear swings forced Japanese and German automakers to shorten hedge horizons to six-nine months, shifting inventory risk to refiners. Iridium lacks a deep futures curve, so price discovery depends on thin bilateral trades, deterring long-run capacity investment.
Escalating Energy and Water Intensity of South African Mines
Sibanye-Stillwater, Impala Platinum, and Anglo American Platinum saw 2024 output drop 11-14% as shafts descended beyond 3 km, where cooling absorbs up to 30% of operating costs. Eskom’s 12.74% tariff hike, rolling blackouts, and water deficits in the Bushveld Complex lifted cash costs by USD 80-120 / oz. Zimbabwe added 450 k oz in 2024, but logistics bottlenecks limit its ability to offset South African declines.
*Our forecasts treat driver/restraint impacts as directional, not additive. The impact forecasts reflect baseline growth, mix effects, and variable interactions.
Segment Analysis
By Metal Type: Iridium Leads Growth as Electrolyser Economics Tighten
Iridium’s 8.92% CAGR positions it as the fastest-growing element inside the platinum group metals market, even though it accounted for only 3-4 t in 2025. PEM electrolyser makers are slicing coating thickness from 3 µm to 1 µm, which halves iridium intensity while still demanding more tonnage than the 2023 baseline. Palladium’s 46.55% share is receding as battery-electric sales rise in China and substitution into platinum accelerates across US and EU gasoline platforms. Rhodium’s volatility spurs OEMs to engineer palladium-rhodium blends that trade 5-8% conversion efficiency for cost predictability. Ruthenium’s move into sub-5 nm interconnects lifts yearly demand by 10-12 t, while osmium stays a sub-500 kg niche. Combined, these shifts redistribute platinum group metals market share toward a more diversified mix.


By Application: Fuel Cells Surge as Jewelry Plateaus
Fuel cells are projected to climb at a 28.47% CAGR and could top 10% of the platinum group metals market size by 2031 as Toyota, Hyundai, and Chinese truck makers roll out PEM drivetrains and data-center backup systems. Jewelry, with a share of 28.75% in 2025, stagnates because Chinese and Indian consumers pivot to gold and synthetics when platinum breaches USD 1,000 / oz. Autocatalysts still dominate volume, but their share declines as battery-electric models take up a quarter of new-car sales in major markets by 2026. Electronics gain incremental lift from ruthenium interconnects, while medical and chemical catalysts provide a steady baseline demand.
By Source: Secondary Recycling Gains as Primary Output Stagnates
Primary mines supplied 71.40% of 2025 tonnage, but secondary flows are climbing 7.08% annually, driven by mandatory EU take-back laws, the UK’s 300 k-unit Johnson Matthey plant, and US autocatalyst feedstock captured by the new Montana JV between Sibanye-Stillwater and Glencore. China’s aging vehicle parc will add 180-220 k oz of recoverable metals yearly after 2027. Deep-level cost inflation and power shortages in South Africa leave recycling as the low-cost swing supplier within the platinum group metals market.
By End-Use Industry: Automotive Dominates, Renewable Energy Surges
The automotive industry commanded 59.25% of end-use volume in 2025, yet renewable energy and hydrogen will grow at 9.32% through 2031 as proton-exchange membrane electrolysers convert policy commitments into gigawatt-scale installations and fuel-cell electric vehicles expand beyond niche deployments. Electronics now absorb the incremental ruthenium flow, whereas industrial chemicals and glass act as slow-growth pillars. Jewelry’s softness and refining’s plateau create a future landscape where hydrogen value chains, data centers, and healthcare consume a higher share of the platinum group metals market size.
Geography Analysis
Asia Pacific owns 51.60% of the platinum group metals market volume and is set to grow 5.03% annually. India’s BS-VI Phase 2 standards, ASEAN’s 4 million-vehicle assembly base, and South Korea’s semiconductor expansions underpin demand. North America leverages USD 7 billion in hydrogen-hub incentives and produces 10.5 million light vehicles, which hold high catalyst loadings to satisfy Tier 3 standards. Europe’s Fit for 55 plan and postponed Euro 7 rules raise both hydrogen and autocatalyst requirements, yet recycling already meets 57% of its needs. South Africa provides more than 70% of the world's platinum, but power, water, and depth constraints cut 2024 output by double digits, while Zimbabwe’s incremental 450 k oz cannot fully offset losses. These dynamics keep regional supply-demand balances tight and reinforce the strategic value of recycling in the platinum group metals market.

Competitive Landscape
The Platinum Group Metals market is highly consolidated. Vertical integration shields miners like Sibanye-Stillwater, which couples South African shafts with Montana refining. Technology leadership, iridium-saving coatings, mechanochemical recycling, and ruthenium interconnect IP define value capture as the platinum group metals market transitions toward hydrogen and electronics. Patent filings on iridium-free anodes and ruthenium barriers surged in 2024-2025, pointing to supply-constrained metals as R&D hotspots. Start-ups focusing on plasma-assisted refining and low-temperature leaching aim to undercut incumbent tolling fees, intensifying competition downstream.
Platinum Group Metals Industry Leaders
Anglo American plc
Norilsk Nickel
Impala Platinum Holdings Ltd
Sibanye-Stillwater Limited
Northam Platinum Holdings Limited
- *Disclaimer: Major Players sorted in no particular order

Recent Industry Developments
- February 2026: Southern Palladium announced that it expects to reach the first reef at the Bengwenyama platinum group metals project around 2027, moving the Eastern Limb venture from concept toward early development.
- October 2025: Tharisa Mining released the technical details of its underground expansion project at its namesake platinum mine in South Africa, estimating an initial investment of USD 547 million over the next 10 years.


Global Platinum Group Metals Market Report Scope
Platinum (Pt), palladium (Pd), rhodium (Rh), ruthenium (Ru), osmium (Os), and iridium (Ir) are the six elements that comprise the platinum group metals (PGMs). They are widely used in various applications, such as electronics, jewelry, the chemical industry, and the medical industry, among others.
The platinum group metals market is segmented by metal type, application, source, end-use industry, and geography. By type, the market is segmented into platinum, palladium, rhodium, iridium, ruthenium, and osmium. By application, the market is segmented into autocatalysts, electrical and electronics, fuel cells, glass, ceramics and pigments, jewelry, medical (dental and pharmaceuticals), chemical industry, and other (aerospace, sensors, water, and forensics). By source, the market is segmented into primary (mined) and recycled/secondary. By end-use industry, the market is segmented into automotive, industrial chemicals, renewable energy and hydrogen, electronics and semiconductors, jewellery and luxury goods, healthcare devices, glass manufacturing, petroleum refining, and others. The report also covers the market sizes and forecasts in 15 countries across the major region. For each segment, the market sizing and forecasts have been done based on volume (tons).
| Platinum |
| Palladium |
| Rhodium |
| Iridium |
| Ruthenium |
| Osmium |
| Auto Catalysts |
| Electrical and Electronics |
| Fuel Cells |
| Glass, Ceramics and Pigments |
| Jewellery |
| Medical (Dental and Pharma) |
| Chemical Industry |
| Other (Aerospace, Sensors, Water, Forensics) |
| Primary (Mined) |
| Recycled/Secondary |
| Automotive |
| Industrial Chemicals |
| Renewable Energy and Hydrogen |
| Electronics and Semiconductors |
| Jewellery and Luxury Goods |
| Healthcare Devices |
| Glass Manufacturing |
| Petroleum Refining |
| Others |
| Asia-Pacific | China |
| India | |
| Japan | |
| South Korea | |
| ASEAN | |
| Rest of Asia-Pacific | |
| North America | United States |
| Canada | |
| Mexico | |
| Europe | Germany |
| United Kingdom | |
| France | |
| Italy | |
| Spain | |
| Rest of Europe | |
| South America | Brazil |
| Argentina | |
| Rest of South America | |
| Middle-East and Africa | Saudi Arabia |
| South Africa | |
| Rest of Middle-East and Africa |
| By Metal Type | Platinum | |
| Palladium | ||
| Rhodium | ||
| Iridium | ||
| Ruthenium | ||
| Osmium | ||
| By Application | Auto Catalysts | |
| Electrical and Electronics | ||
| Fuel Cells | ||
| Glass, Ceramics and Pigments | ||
| Jewellery | ||
| Medical (Dental and Pharma) | ||
| Chemical Industry | ||
| Other (Aerospace, Sensors, Water, Forensics) | ||
| By Source | Primary (Mined) | |
| Recycled/Secondary | ||
| By End-Use Industry | Automotive | |
| Industrial Chemicals | ||
| Renewable Energy and Hydrogen | ||
| Electronics and Semiconductors | ||
| Jewellery and Luxury Goods | ||
| Healthcare Devices | ||
| Glass Manufacturing | ||
| Petroleum Refining | ||
| Others | ||
| By Geography | Asia-Pacific | China |
| India | ||
| Japan | ||
| South Korea | ||
| ASEAN | ||
| Rest of Asia-Pacific | ||
| North America | United States | |
| Canada | ||
| Mexico | ||
| Europe | Germany | |
| United Kingdom | ||
| France | ||
| Italy | ||
| Spain | ||
| Rest of Europe | ||
| South America | Brazil | |
| Argentina | ||
| Rest of South America | ||
| Middle-East and Africa | Saudi Arabia | |
| South Africa | ||
| Rest of Middle-East and Africa | ||


Key Questions Answered in the Report
What is the projected volume for platinum group metals in 2031?
The market is forecast to reach 881.26 tons by 2031, up from 699.77 tons in 2026, reflecting a 4.72% CAGR.
Which segment adds the most incremental growth by 2031?
Fuel cells expand at a 28.47% CAGR, becoming the fastest-growing application as hydrogen infrastructure scales.
Why is iridium demand rising so quickly?
PEM electrolysers for green hydrogen need iridium-coated anodes, so capacity additions drive an 8.92% CAGR.
How will recycling influence future supply balances?
Secondary material is expected to meet 40-45% of total demand by 2031 as EU and U.S. collection rates climb.
Which region leads consumption today?
Asia accounts for 51.60% of 2025 volume and remains the largest regional consumer through the forecast period.
Page last updated on:


