
Base Metals Market Size and Share
Market Overview
| Study Period | 2021 - 2031 |
|---|---|
| Market Volume (2026) | 141.52 Million tons |
| Market Volume (2031) | 169.87 Million tons |
| Growth Rate (2026 - 2031) | 3.72 % |
| Fastest Growing Market | Asia Pacific |
| Largest Market | Asia Pacific |
| Market Concentration | Medium |
Major Players *Disclaimer: Major Players sorted in no particular order Image © Mordor Intelligence. Reuse requires attribution under CC BY 4.0. | |
Base Metals Market Analysis by Mordor Intelligence
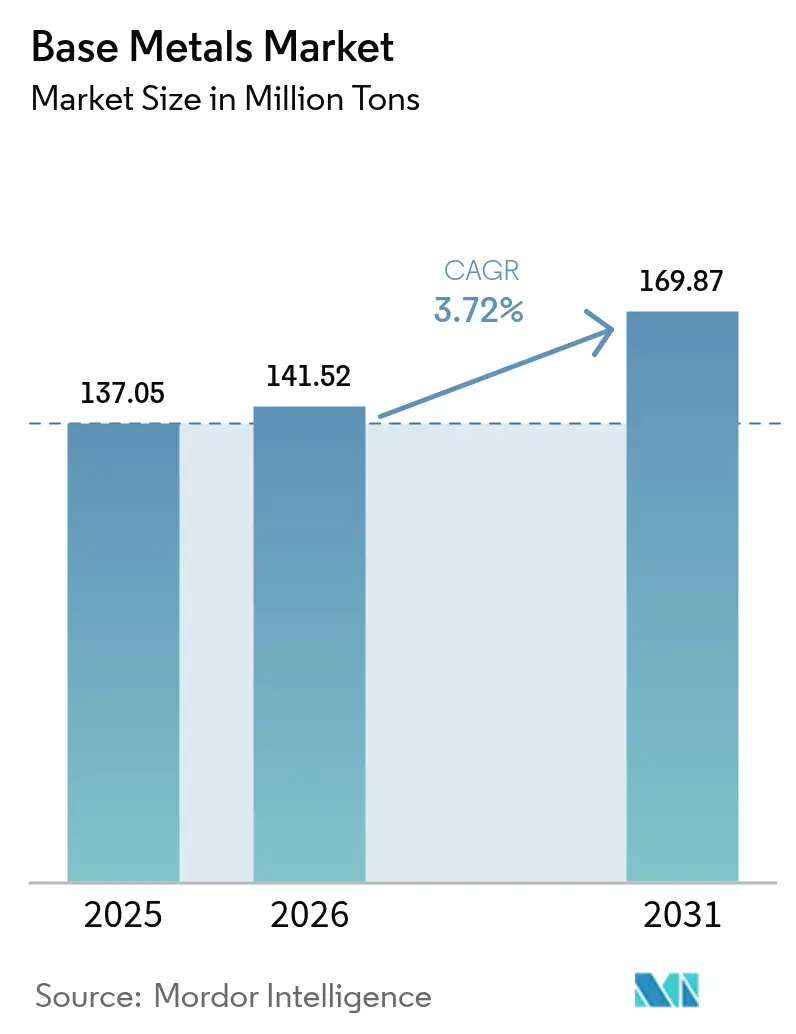
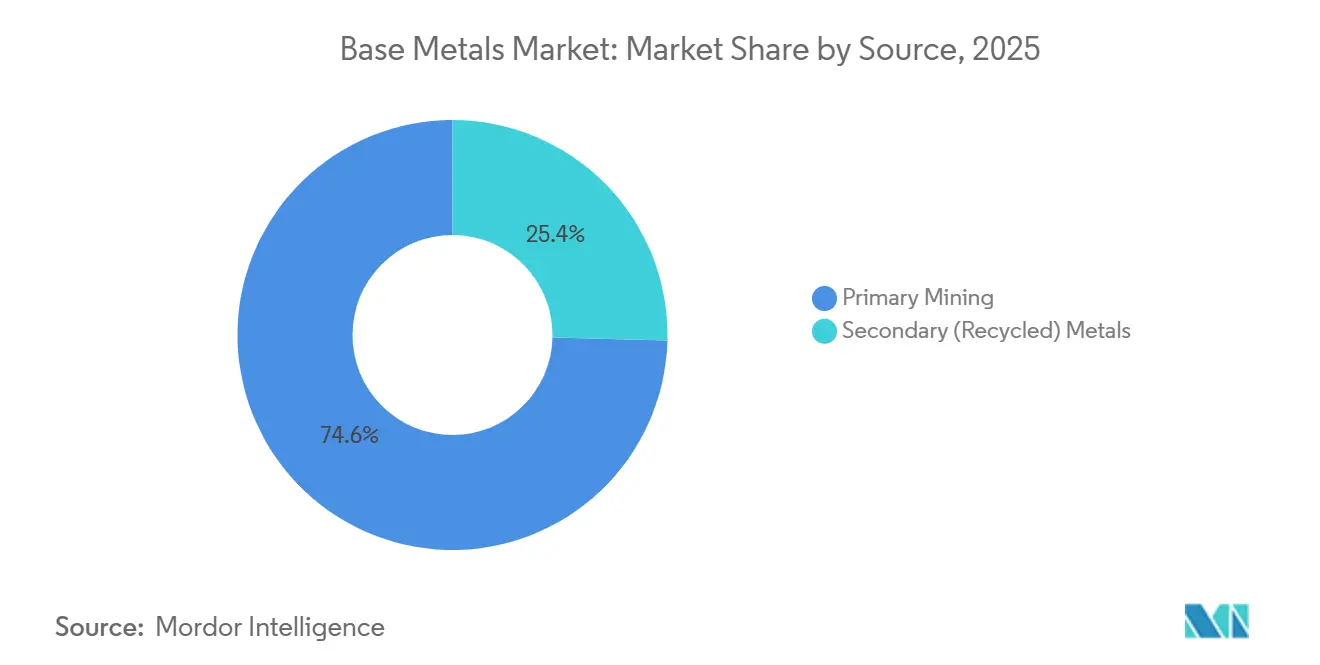
The Base Metals Market size is projected to expand from 137.05 Million tons in 2025 and 141.52 Million tons in 2026 to 169.87 Million tons by 2031, registering a CAGR of 3.72% between 2026 to 2031. The headline numbers obscure sharp contrasts beneath the surface: electrification policies are propelling copper and zinc into double-digit project pipelines, whereas aluminium and lead margins are being compressed by fast-rising carbon-compliance costs that many smelters cannot pass through. Asia-Pacific commanded 49.81% of 2025 volume and will grow fastest at 5.29% through 2031, yet China’s construction slowdown is redirecting tonnage toward India’s infrastructure build-out and Southeast Asia’s data-center corridor. Primary mining supplied 74.60% of 2025 output, but secondary metals are expanding at 4.91% as automakers lock in closed-loop contracts to hit scope-3 targets.
Key Report Takeaways
- By source, primary mining led with 74.60% of base metal market share in 2025, while secondary metals are forecast to post the fastest 4.91% CAGR through 2031.
- By metal type, copper commanded 44.79% of base metal market share in 2025; zinc is poised to expand at the highest 5.47% CAGR between 2026 and 2031.
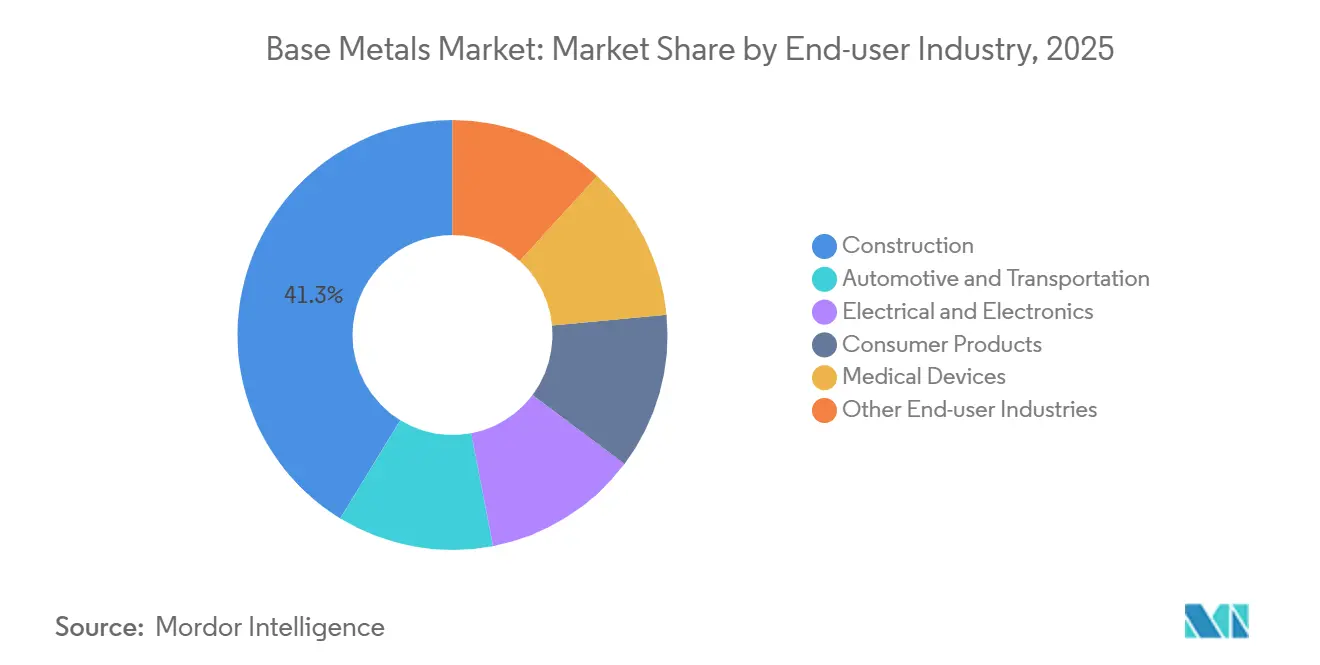
- By end-user industry, construction absorbed 41.27% of base metal market share in 2025, whereas electrical and electronics will register the quickest 4.82% CAGR to 2031.
- By geography, Asia-Pacific captured 49.81% of base metal market share in 2025 and will also deliver the leading 5.29% CAGR to 2031.
Note: Market size and forecast figures in this report are generated using Mordor Intelligence’s proprietary estimation framework, updated with the latest available data and insights as of 2026.
Market Trends and Insights
Drivers Impact Analysis of Base Metals Market*
| Driver | (~) % Impact on CAGR Forecast | Geographic Relevance | Impact Timeline |
|---|---|---|---|
| Expanding copper demand for EV wiring and charging infrastructure | +1.2% | Global, with concentration in China, Europe, North America | Medium term (2–4 years) |
| Infrastructure stimulus in emerging economies | +0.9% | Asia-Pacific (India, ASEAN), Middle-East, Africa | Long term (≥4 years) |
| Aluminium substitution in automotive lightweighting | +0.6% | North America, Europe, China | Medium term (2–4 years) |
| Strategic stockpiling for critical-mineral security | +0.5% | China, United States, European Union | Short term (≤2 years) |
| Improved mining, processing and recycling capabilities | +0.4% | Global, with early adoption in OECD markets | Long term (≥4 years) |
| Source: Mordor Intelligence | |||
Expanding Copper Demand for EV Wiring and Charging Infrastructure
Each battery-electric car needs 83 kg of copper, nearly four times the 23 kg required in internal-combustion models. Rapid charger installations add another 8 kg per unit, and grid reinforcement adds 15-20 kg per charging point, compounding demand[1]U.S. Department of Energy, “EV Charger Copper Requirements,” energy.gov . China installed 1.1 million public chargers in 2025, and Europe added 420,000, together creating 180,000 tons of incremental copper pull that year. Transformers now have 18-24-month order backlogs, pushing a slice of copper demand into future quarters. Offtake agreements linked to national infrastructure programs help producers lock in volumes at premium terms, protecting margins amid volatile spot treatment charges.
Infrastructure Stimulus in Emerging Economies
India’s USD 1.4 trillion National Infrastructure Pipeline earmarks 38% for power generation and transmission, implying uptake of 2.8 million tons of copper and 4.1 million tons of aluminium by 2030. Southeast Asia added 620 MW of new data-center IT capacity in 2025, with every megawatt requiring 12 tons of copper, underscoring a new, durable demand vector. Saudi Arabia’s NEOM will deploy 26 GW of renewables by 2030, soaking up 340,000 tons of aluminium and 85,000 tons of copper. Compared with earlier stimulus cycles that favored steel and cement, today’s programs prioritize electrification, extending replacement cycles and boosting margin potential for diversified miners. Mid-tier operators positioned near fast-growing emerging markets stand to gain share at the expense of incumbents locked into decelerating regions.
Aluminium Substitution in Automotive Lightweighting
The average battery-electric vehicle incorporated 180 kg of aluminium in 2025, up from 150 kg in 2023, as automakers replaced steel in body panels and castings to preserve range. Ford’s F-150 Lightning, built with an all-aluminium body, shaved 320 kg of curb weight and extended driving distance by 15% without a larger battery. Gigacasting techniques adopted by Tesla, Hyundai, Volvo, and GM collectively add 240,000 tons of aluminium demand by 2026. European smelting shrank 8% in 2025 after energy prices exceeded EUR 150/MWh, forcing OEMs to import higher-footprint metal from China and the Middle-East. North American restarts hinge on long-term power contracts below USD 40/MWh, a threshold Alcoa met at Warrick, Indiana in 2025.
Strategic Stockpiling for Critical-Mineral Security
China added 200,000 tons of copper and 150,000 tons of zinc to state reserves in H1 2025, the largest build-up since 2016. The United States expanded its National Defense Stockpile to include nickel and cobalt, approving USD 500 million in 2025 purchases. The European Union’s Critical Raw Materials Act now mandates members to hold 60 days of consumption by 2030, a buffer equating to 180,000 tons of copper, 90,000 tons of nickel, and 120,000 tons of aluminium. While stockpiling provides a price floor during downturns, unsignaled releases—China offloaded 80,000 tons of copper in late 2025—introduce sudden volatility. Suppliers embedded in strategic-reserve frameworks enjoy stable contracts, reducing exposure to cyclical dips.
Restraints Impact Analysis of Base Metals Market*
| Restraint | (~) % Impact on CAGR Forecast | Geographic Relevance | Impact Timeline |
|---|---|---|---|
| Rising carbon pricing on energy-intensive smelting | -0.8% | Europe, North America, China (pilot schemes) | Medium term (2–4 years) |
| Trade-policy volatility and supply-chain disruptions | -0.6% | Global, with acute impact on North America, Europe, China trade corridors | Short term (≤2 years) |
| Environmental and community-consent pressures | -0.4% | Latin America, North America, Australia | Long term (≥4 years) |
| Source: Mordor Intelligence | |||
Rising Carbon Pricing on Energy-Intensive Smelting
Europe’s Carbon Border Adjustment Mechanism levies EUR 90 per ton of CO₂ on imported aluminium, inflating Chinese and Russian billet costs by USD 400-500 per ton. Norsk Hydro curtailed 120,000 tons at its Slovalco smelter in 2025 when power prices hit EUR 150/MWh, despite premium product pricing. China’s ETS expanded to aluminium and copper in 2025, allocating emissions permits below historic intensity, compelling smelters to buy offsets or adopt renewables. Retrofitting cells is technically feasible, but grid-tie lead times of 3-5 years delay decarbonization. Hydro- and geothermal-powered smelters in Iceland, Quebec, and the U.S. Northwest now earn USD 200-300 per ton margin premiums over coal-based rivals.
Trade-Policy Volatility and Supply-Chain Disruptions
Washington’s 2025 extension of Section 232 tariffs to semi-finished aluminium added a blanket 10% duty, diverting 280,000 tons of Chinese exports to Vietnam and Thailand[2]U.S. Department of Commerce, “Section 232 Aluminium Tariffs Expansion,” commerce.gov . Indonesia’s tighter nickel-export ban now covers matte below 70% purity, shifting 1.8 million tons of processing onshore and raising freight costs for Japanese and Korean buyers. China’s 2025 export controls on antimony and rare-earths have injected alloying-metal anxiety into copper and aluminium chains, even though substitutes exist. Firms now run duplicate supply routes, adding 12-18% to working capital as lead times lengthen. Near-shoring refineries and tolling agreements mitigate tariff exposure but add operational complexity that favors actors with healthy balance sheets.
*Our forecasts treat driver/restraint impacts as directional, not additive. The impact forecasts reflect baseline growth, mix effects, and variable interactions.
Base Metals Market Segment Analysis
By Source:
Recycling Gains as Automakers Lock Closed-Loop ContractsSecondary metals expanded 4.91% CAGR from 2026 to 2031, beating the overall base metals market growth as carmakers and electronics firms sign long-term scrap pacts to hit scope-3 targets. Primary mining still dominated at 74.60% of 2025 volume but is grappling with 12-15-year permitting cycles and rising energy costs, squeezing margins and delaying new output. Recycled copper reached 2.8 million tons in 2025, representing 38% of end-of-life vehicles and appliance collections. The International Copper Study Group forecasts recycled feed will cover 35% of demand by 2030, reinforcing the medium-term appeal of circular supply loops.
Recycling aluminium consumes 95% less energy than smelting, offering a cost hedge of USD 800-1,000 per ton at power prices above USD 80/MWh. Glencore’s Italian battery-recycling hub will process 25,000 tons of packs yearly, supplying 15% of its refined nickel output by 2028 and illustrating how the base metals market size for closed-loop nickel is set to accelerate. Lead already sources 85% of tonnage from spent batteries, a blueprint copper and aluminium are replicating through deposit-return schemes in the EU and California. Scrap availability is the main bottleneck; EV batteries last 12-15 years, so a wave of black-mass supply will not crest until the early 2030s.


By Metal Type:
Zinc Outpaces Copper on Galvanizing and Grid InfrastructureZinc is the fastest-growing metal within the base metals market, clocking a 5.47% CAGR to 2031, powered by hot-dip galvanizing for renewable-energy towers and grid pylons in corrosive coastal zones. Copper still owned 44.79% of 2025 tonnage, yet benchmark treatment charges slid under USD 20 per ton, the lowest in a decade, flagging ore scarcity. China’s solar mounting consumed a large amount of galvanized steel during 2025, and the 1,200 GW solar build plan through 2030 will need more amount of zinc.
Aluminium is undergoing a geographic pivot. European smelting slipped 8% to 3.1 million tons in 2025, while Middle-Eastern output jumped 12% to 6.8 million tons on cheap gas and 20-year power contracts. Nickel demand is splitting, whereas battery-grade nickel is expanding, a niche that will redefine base metals market share inside the cathode sector. Lead is flat, hurt by lithium-ion starter batteries edging into 35% of new-vehicle sales by 2031. Tin has a restricted annual demand, limiting its pricing impact despite higher solder loadings per electronics unit.
By End-user Industry:
Electronics Overtakes Automotive in Growth VelocityConstruction consumed 41.27% of 2025 output, amid China’s property retrenchment and a Western pivot from residential projects to infrastructure upgrades. In contrast, the electrical and electronics sector is on track for a 4.82% CAGR through 2031, fueled by AI data centers, 5G nodes, and power-dense semiconductors that triple copper load per server rack to 45 kg. Hyperscale operators rolled out 1,800 MW of AI-specific capacity in 2025, translating into 81,000 tons of extra copper pull that year.
Automotive and transportation is expanding as EV penetration hit 18% of light-vehicle sales, lifting copper intensity from 23 kg to 83 kg per unit. Consumer electronics are accelerating as device cycles extend and miniaturization trims copper content to 15 g per smartphone. Medical device demand is growing, thanks to robotics and imaging equipment that depend on aluminium frames and copper coils. Suppliers balancing construction wire with high-purity cathodes—Aurubis offers both—stand to capture a higher slice of base metals market size as demand skews toward electronics.

Geography Analysis
APAC Base Metals Market
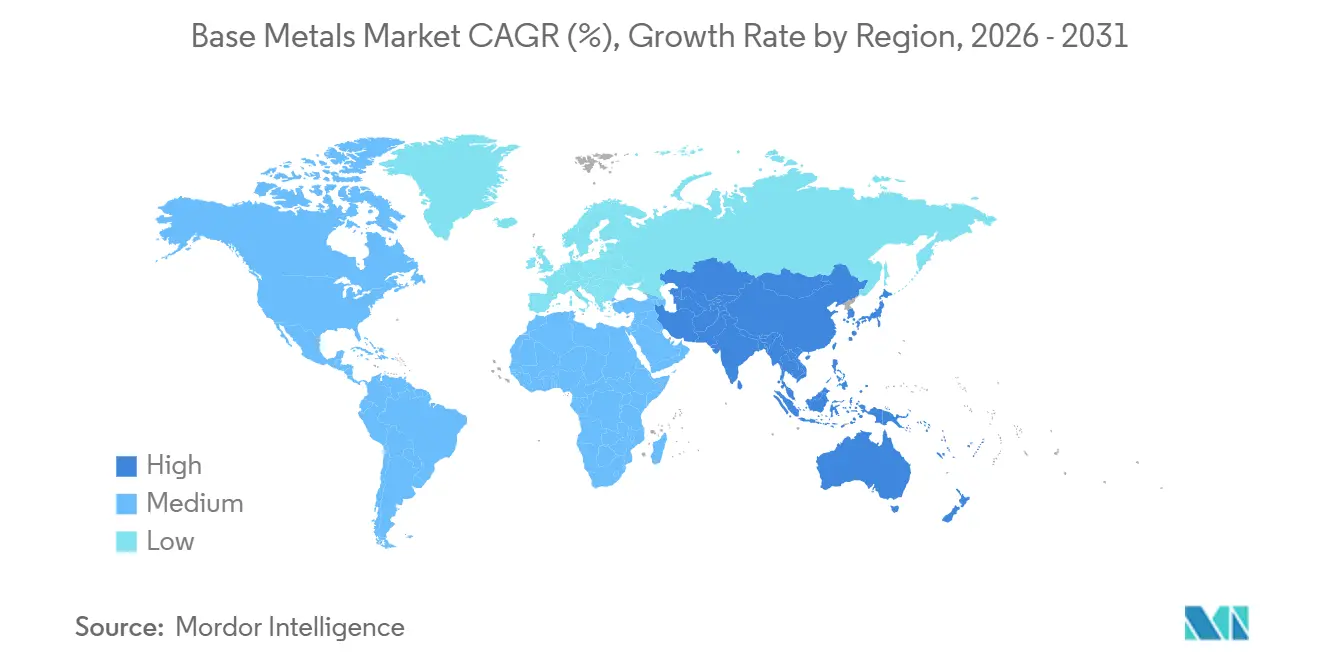
Asia-Pacific retained 49.81% of tonnage in 2025 and will deliver a leading 5.29% CAGR, yet the region’s outlook is bifurcated. China's demand is declining as residential starts fell 18% and local-government debt eroded stimulus headroom. India, by contrast, surged on the back of a USD 1.4 trillion public-works program that is front-loading power-grid expansion and renewables integration. ASEAN countries added 620 MW of data-center load in 2025, each megawatt calling for 12 tons of copper, turning the region into a fresh growth corridor for the base metals market.
North America and EMEA Base Metals Market
North America is growing on the strength of the Infrastructure Investment and Jobs Act and the Inflation Reduction Act, both of which incentivize local sourcing of metal for grids and EV supply chains. Europe is under structural pressure after primary aluminium output dropped 8% amid triple-digit power prices, forcing buyers to import higher-footprint billet despite carbon-border levies. Middle-East and Africa is expanding as Saudi Arabia’s NEOM and Egypt’s new capital city procure large volumes of aluminium and copper for energy-efficient buildings and electrified transit.
South America and APAC Base Metals Market
South America is paced by Brazil and Chile, yet political gridlock in Peru has delayed four copper-mine expansions, a drag that may limit regional growth. Freight markets are adapting: miners are switching from Capesize vessels to smaller Panamax routes to hit India’s shallow-draft ports, a shift that could raise per-ton shipping costs by 7-9% but speed cycle times by two weeks. Logistics recalibration is becoming a competitive differentiator in the base metals market as demand centers re-map toward India and ASEAN.

Regulatory Landscape
Base metals supply and trade are increasingly governed by critical-minerals industrial policy and carbon-linked trade measures. In the European Union, the Critical Raw Materials Act (CRMA) has formalized targets for domestic extraction (10%) and processing (40%), and the European Court of Auditors highlighted execution gaps in Special Report 04/2026, reinforcing scrutiny on project permitting, financing, and execution for copper, aluminium, nickel, zinc, and other base metals. In parallel, Europe has been tightening carbon-compliance economics for energy-intensive smelting through mechanisms such as the Carbon Border Adjustment Mechanism (CBAM), raising the importance of emissions data, traceability, and low-carbon power sourcing for traded aluminium and other metal products.
In the United States, the final 2025 USGS List of Critical Minerals (published in the Federal Register) included base metals such as copper, lead, and zinc, supporting a policy framework that links domestic processing, secure supply, and funding programs. The U.S. Department of Energy has continued to run Critical Minerals and Materials (CMM) programs, including Accelerator funding windows with defined 2026 timelines, directing capital toward mid-stage processing and validation. Across exporting jurisdictions, tighter licensing, export restrictions, and trade-policy tools are shaping availability and routing of ores and concentrates, contributing to regulatory divergence that pushes producers and buyers toward diversified sourcing, near-shoring/tolling, and more robust compliance reporting for cross-border flows.
Value Chain Analysis
The base metals value chain spans upstream exploration and mining, concentration/beneficiation, smelting and refining, semi-fabrication (wire rod, billet, sheet, ingot), distribution to end-use sectors, and growing circular loops via scrap collection and recycling. Primary mining still accounts for most output (74.60% share in 2025), but the chain is being reshaped by declining ore grades, long lead times for new mines, and shifting treatment charges, which elevate the importance of reliable concentrate supply and access to modern smelting capacity. Downstream pull is increasingly tied to electrification and power infrastructure, raising demand for high-purity copper and specialty aluminium products, while carbon-cost exposure at smelters influences where metal is refined and how premiums are set.
Recycling and closed-loop sourcing are gaining weight as manufacturers seek lower embedded emissions and improved supply security, tightening the link between scrap aggregators, refiners, and end users. This shift is reinforced by large producers and regions investing in processing modernization and new capacity: for example, KGHM announced a USD 8.55 billion KGHM 2.0 strategy in July 2026 to modernize deep-level copper mining and lift production capability in Poland, while large copper complexes such as Ivanhoe Mines Kamoa-Kakula have advanced integrated smelting/refining milestones (including first anodes and updated ramp-up plans). Trade-policy friction and strategic stockpiling also affect midstream logistics, encouraging hub-and-spoke networks around major processing centers and more frequent use of tolling, blending, and diversified shipping routes to keep units moving from mine gate to fabricator.
Competitive Landscape
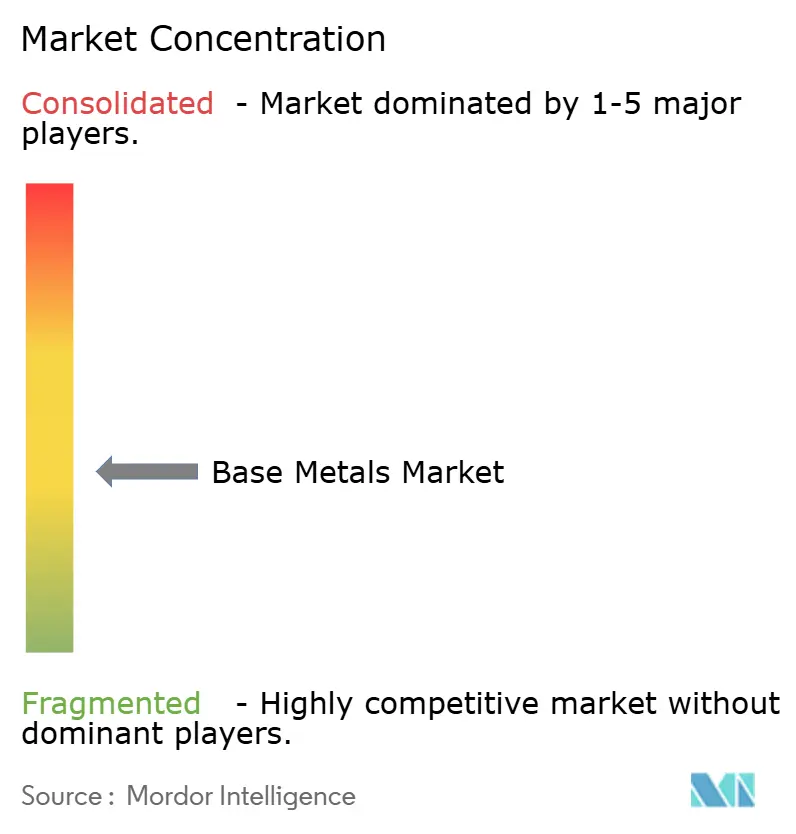
The base metals industry shows moderate concentration: the top five conglomerates—BHP, Rio Tinto, Glencore, Freeport-McMoRan, and Vale—held roughly 35% of refined capacity in 2025, giving mid-tier firms room to specialize regionally. Strategic direction has pivoted toward vertical integration into recycling and downstream processing. BHP’s tie-up with Redwood Materials to handle battery scrap and Rio Tinto’s equity stake in Matalco’s remelting network illustrate the swing from throughput expansion to margin defense amid falling head grades and volatile treatment charges.
Emerging disruptors include junior miners such as Arizona Sonoran Copper, whose Cactus project cleared U.S. federal permitting in 18 months versus a seven-year norm, and battery-recycling pioneers Li-Cycle and Ascend Elements, which have secured guaranteed offtake from automakers keen to derisk cathode supply. Technological dispersion is stark: some smelters deploy AI process controls that cut electricity use 8%, while others still run 40-year-old potlines vulnerable to Europe’s carbon-border fees. Firms able to toggle between primary ore and scrap, shift product mix toward high-margin alloys, and lock power contracts below USD 40/MWh will out-earn peers shackled to rigid cost structures and coal-fired grids.
Process innovation is extending asset life. Rio Tinto’s Nuton leaching unlocked 50,000 tons of copper from low-grade sulfides at Kennecott, while Glencore’s Italian recycling plant will recover metals equal to 15% of its nickel cathode output by 2028. ESG metrics now condition debt pricing, with lenders cutting interest spreads up to 40 basis points for smelters achieving scope-2 intensity below 4 tCO₂e per ton of aluminium. Operational agility and transparent emissions profiles therefore determine not only customer preference but also capital access in the modern base metals market.
Base Metals Industry Leaders
BHP
Freeport-McMoRan
Rio Tinto
Vale S.A.
Glencore
- *Disclaimer: Major Players sorted in no particular order
Base Metals Market Companies Covered in this Report
- Alcoa Corporation
- Anglo American PLC
- Aurubis AG
- BHP
- First Quantum Minerals Ltd.
- Freeport-McMoRan
- Glencore
- Grupo Mexico
- Jiangxi Copper Corporation
- Jubilee Metals Group PLC
- Lundin Mining Corporation
- Norilsk Nickel
- Norsk Hydro ASA
- Rio Tinto
- Sumitomo Metal Mining Co., Ltd.
- Vale S.A.
- Vedanta Resources Limited
- Zijin Mining Group Co. Ltd

Market Opportunities and Future Outlook
A key whitespace is in low-carbon, traceable metal supply that meets tightening buyer and policy requirements while reducing exposure to carbon-linked trade costs, particularly for aluminium and copper. CBAM-driven cost differentials and broader decarbonization roadmaps are pushing demand for metal produced with low-carbon electricity and documented emissions performance, creating room for smelters and refiners with hydro-, geothermal-, or renewables-backed power contracts and for recyclers that can supply secondary units at materially lower energy intensity. Secondary metals are also supported by automaker and electronics closed-loop contracting, but scrap availability remains a gating factor, creating opportunities for improved collection, sorting, and high-yield recovery capacity near major manufacturing hubs.
Another opportunity area is the project pipeline tied to grid build-outs, EV charging, and data center electrification, which is pulling forward mine, concentrator, and smelter investments and permitting activity. Recent filings and milestones underscore where investment is being directed: Capstone Copper submitted the Mantos Blancos Phase II project into Chile’s EIA process in June 2026, Trekor submitted a detailed project description to British Columbia’s Environmental Assessment Office for the Yellowhead copper project in July 2026, and Ivanhoe Mines advanced Kamoa-Kakula’s integrated smelting capability (first anodes in January 2026) alongside updated ramp-up plans. Alongside these, policy tools such as Argentina’s RIGI incentive regime (noted for Vicuña in 2026) and the European Commission’s Transition Pathway for metals under the Clean Industrial Deal are shaping where capital is deployed across mining, processing, and circularity, favoring operators that can align permitting, power sourcing, and downstream offtake into bankable development pathways.
Recent Industry Developments in Base Metals Market
- July 2026: BHP secured environmental approval for the Escondida copper mine expansion in Chile, enabling early works as part of a multiyear development program. The approval helps maintain continuity at a tier-one asset and supports a longer-term supply outlook for concentrate and refined copper.
- February 2026: Freeport-McMoRan finalized an agreement extending operating rights in the Grasberg Minerals District through 2041, reinforcing long-duration tenure and underpinning planning for sustaining capital and downstream commitments.
- January 2025: BHP and Lundin Mining completed the joint acquisition of Filo Corp and formed Vicuña Corp as a 50/50 joint venture holding the Filo del Sol and Josemaria copper projects in the Vicuña district of Argentina and Chile. Consolidating these assets under a single JV structure streamlines development and funding pathways and increases strategic optionality for future concentrate supply into a market facing tightening project timelines.


Base Metals Market Report Scope and Research Methodology
Market Definition and Coverage
For this study, the base metals market is defined as the global supply and demand balance for commonly used industrial metals, measured in physical volume, and tracked across mining output and recycled metal flows into end-use consumption.
Scope exclusions: Excludes precious metals and excludes downstream fabricated metal products beyond primary and secondary metal supply volumes.
Segments Covered in This Report
- By Source
- Primary Mining
- Secondary (Recycled) Metals
- By Metal Type
- Copper
- Aluminium
- Zinc
- Nickel
- Lead
- Tin
- By End-user Industry
- Construction
- Automotive and Transportation
- Electrical and Electronics
- Consumer Products
- Medical Devices
- Other End-user Industries
- By Geography
- Asia-Pacific
- China
- India
- Japan
- South Korea
- Australia
- ASEAN Countries
- Rest of Asia-Pacific
- North America
- United States
- Canada
- Mexico
- Europe
- Germany
- United Kingdom
- France
- Italy
- Spain
- NORDIC Countries
- Russia
- Rest of Europe
- South America
- Brazil
- Argentina
- Rest of South America
- Middle-East and Africa
- Saudi Arabia
- United Arab Emirates
- Qatar
- South Africa
- Nigeria
- Egypt
- Rest of Middle-East and Africa
- Asia-Pacific
Data Sources, Market Sizing, and Validation
Desk Research
Desk research was used to set the fact base on base metal production, apparent consumption, and trade movements before any assumptions were added. We relied on public sources such as the USGS, World Bureau of Metal Statistics, UN Comtrade, International Aluminium Institute, and International Copper Study Group, which help anchor mined output, refined metal availability, and regional trade direction.
To convert the raw supply signals into a usable market model, company annual reports, investor presentations, and sustainability disclosures were reviewed to understand capacity changes, recycling mix, and operating-rate commentary. News and financial platforms and a metals and minerals production and capacity database were also used selectively to confirm plant start-ups, curtailments, and the context around price-linked operating behavior. These examples are not exhaustive, and many other public sources were also referred to for data collection, validation, and clarification.
Primary Interviews and Surveys
Primary interviews and surveys were used to stress-test the desk inputs, especially where trade re-exports, secondary supply, or end-use pull signals were not clean. We spoke with producers, recyclers, distributors, and large industrial buyers across APAC, EMEA, and the Americas, and then used their feedback to validate utilization, recycling share, and demand timing assumptions.
Distribution of primary research fieldwork respondents
| Company type | Respondent position | Region |
|---|---|---|
| Top tier: 34% | CXOs: 17% | APAC: 48% |
| Mid tier: 49% | Functional/Unit leaders: 31% | EMEA: 33% |
| Smaller Players: 17% | Managers: 52% | Americas: 19% |
Market-Sizing & Forecasting
The core sizing logic starts from a top-down build where production and trade data are used to reconstruct regional metal availability, which is then mapped to demand by end-use industry. Results are corroborated with selective bottom-up approximations, such as sampled producer capacity rollups, channel checks with distributors, and spot checks of volume splits by key consuming sectors, so totals can be adjusted when gaps show up.
Key inputs used in the model include mined and refined output volumes, secondary (recycled) metal share, capacity additions and curtailments, regional import and export balances, and end-use activity indicators tied to construction, automotive and transportation, and electrical and electronics demand. When data is missing for smaller countries, proxy indicators are applied from similar economies and then normalized using trade intensity and industrial activity signals.
For forecasting, we use scenario analysis supported by short-run smoothing on historical volume series, and then align the forward path with expert expectations on utilization changes, recycling ramp-ups, and regional demand timing. Assumptions are kept traceable to observable series so the model can be repeated consistently each update cycle.
Data Validation & Update Cycle
Validation is handled through step-by-step checks where model outputs are compared with independent signals like production growth rates, trade balances, and known capacity events, and then reviewed for variances that do not fit industry realities. When a number moves too sharply, we re-check the underlying series, confirm unit conversions, and re-contact relevant experts to understand whether the shift is real or a data timing issue.
Before sign-off, the work is reviewed by another analyst to catch inconsistencies across regions, metals, and end uses, and then one final refresh pass is done close to publication so clients get the most current view. Reports are refreshed annually, with interim updates triggered by material events such as major smelter disruptions, policy changes affecting trade, or sharp price cycles that change operating behavior.
Mordor Intelligence's Base Metals Market Sizing Compared With Other Published Estimates
Published market sizes for base metals can look far apart, even when the same metals are discussed, because the measurement unit, value chain point, and included metal list often differ across studies. Another frequent driver is timing, since shifts in output, recycling flows, and trade can quickly make older assumptions feel out of date.
Excluded precious metals sit outside Mordor Intelligence's scope, and the market is tracked in million tons rather than being converted into a dollar value using price assumptions that can swing sharply by year and region. Differences also come from whether a source treats mining and refined metal as one pool, whether secondary metal is counted fully, and whether the study uses a single price deck versus a blended regional approach for currency conversion and inflation.
Benchmark comparison
| Source | Market Size | Gaps in Research Methodology |
|---|---|---|
| Mordor Intelligence | USD 0.14 B (2026) | |
| Trade Publisher A | USD 866.10 B (2024) | Reported in value terms, which embeds price assumptions and typically reflects a mining or broader industry revenue view rather than volume of base metals supplied and consumed. |
| Industry Research Portal B | USD 872.00 B (2024) | Uses a value-based total with wider value chain interpretation and multi-form product framing, which can pull in downstream pricing effects beyond primary and secondary metal volumes. |
The spread in the table mainly reflects unit choice and scope positioning along the value chain, rather than a simple disagreement on demand direction. By keeping the model tied to production, recycling share, and trade balance signals, we can explain each step clearly and avoid totals being driven mainly by volatile price decks.


Key Questions Answered in the Report
What is the size of the base metals market?
The size of the base metals market stands at 141.52 million tons in 2026 and is projected to reach 169.87 million tons by 2031, growing at a 3.72% CAGR from 2026-2031.
Which metal is expected to grow fastest through 2031?
Zinc will expand at a 5.47% CAGR, driven by galvanizing demand in renewable-energy and grid projects.
How will recycling influence future supply?
Secondary metals are growing 4.91% CAGR as closed-loop systems scale.
Which region offers the highest growth prospects?
Asia-Pacific will post the fastest 5.29% CAGR, led by India’s infrastructure pipeline and ASEAN data-center investments.
Page last updated on:


 Your data is secure and never sold or shared.


