Gold Market Size and Share
Market Overview
| Study Period | 2020 - 2031 |
|---|---|
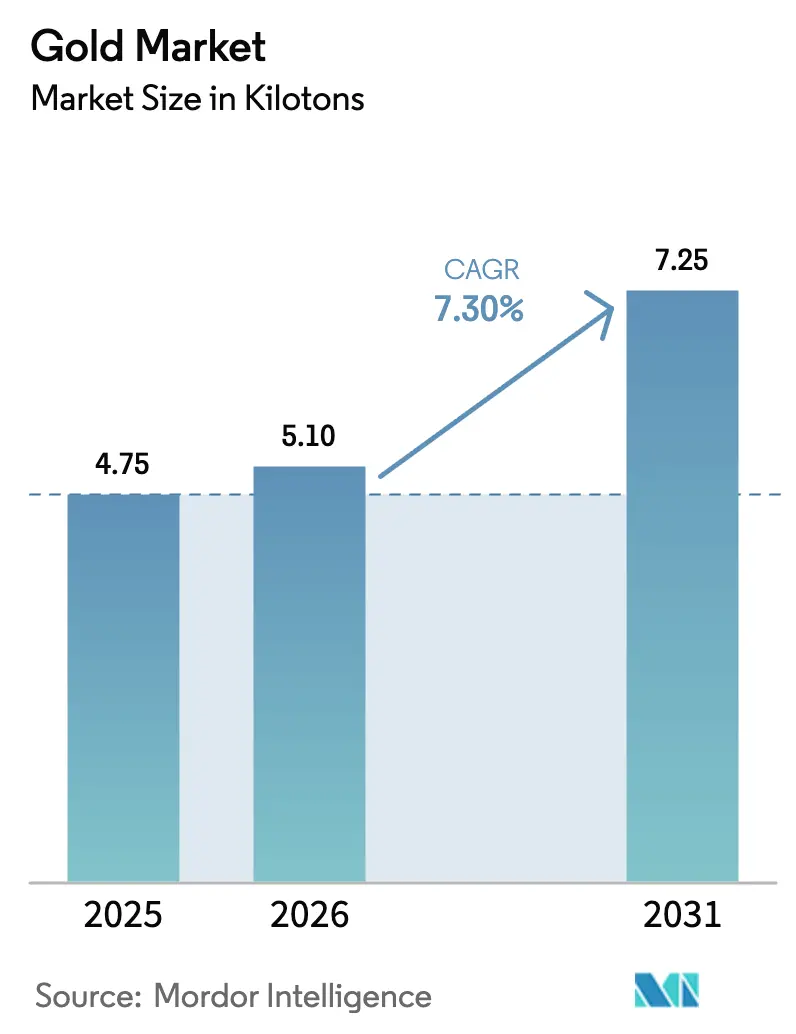
| Market Volume (2026) | 5.1 kilotons |
| Market Volume (2031) | 7.25 kilotons |
| Growth Rate (2026 - 2031) | 7.30% CAGR |
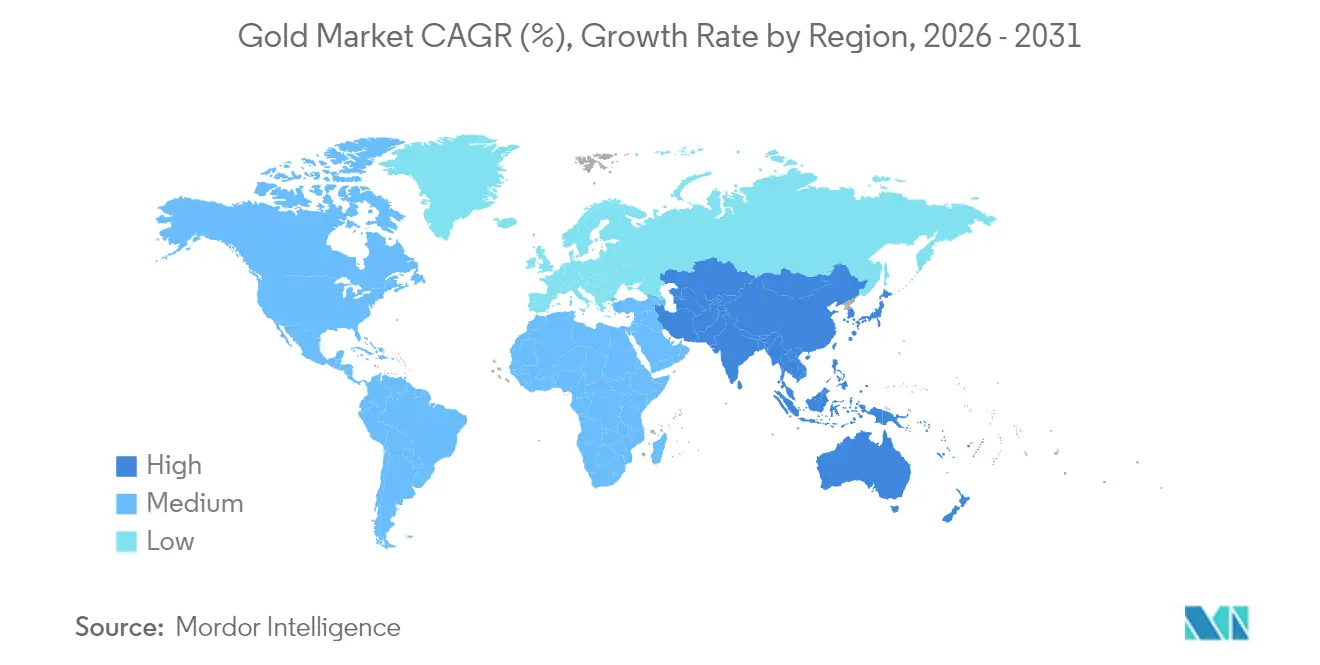
| Fastest Growing Market | Asia Pacific |
| Largest Market | Asia-Pacific |
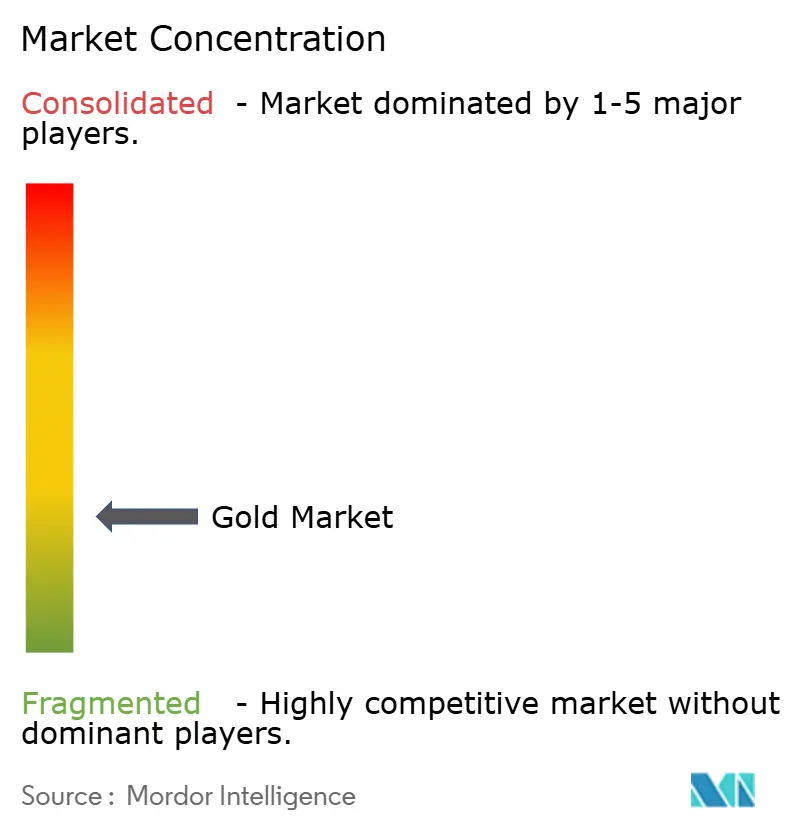
| Market Concentration | Low |
Major Players *Disclaimer: Major Players sorted in no particular order Image © Mordor Intelligence. Reuse requires attribution under CC BY 4.0. | |
Gold Market Analysis by Mordor Intelligence
The Gold Market size market is expected to grow from 4.75 kilotons in 2025 to 5.1 kilotons in 2026 and is forecast to reach 7.25 kilotons by 2031 at 7.30% CAGR over 2026-2031. Robust central-bank accumulation, persistent geopolitical risk, and the expanding role of gold in advanced electronics keep demand rising even as mined supply faces structural cost pressures. Asia-Pacific remains the heartbeat of consumption, while North America and Europe amplify investment flows through exchange-traded products. Recycled volumes accelerate on sustainability mandates, tokenized products broaden retail access, and miners pursue mergers to offset declining ore grades. Across the forecast horizon, disciplined supply management and digital-asset innovation underpin Gold's resilience and support multi-year price strength.
Key Report Takeaways
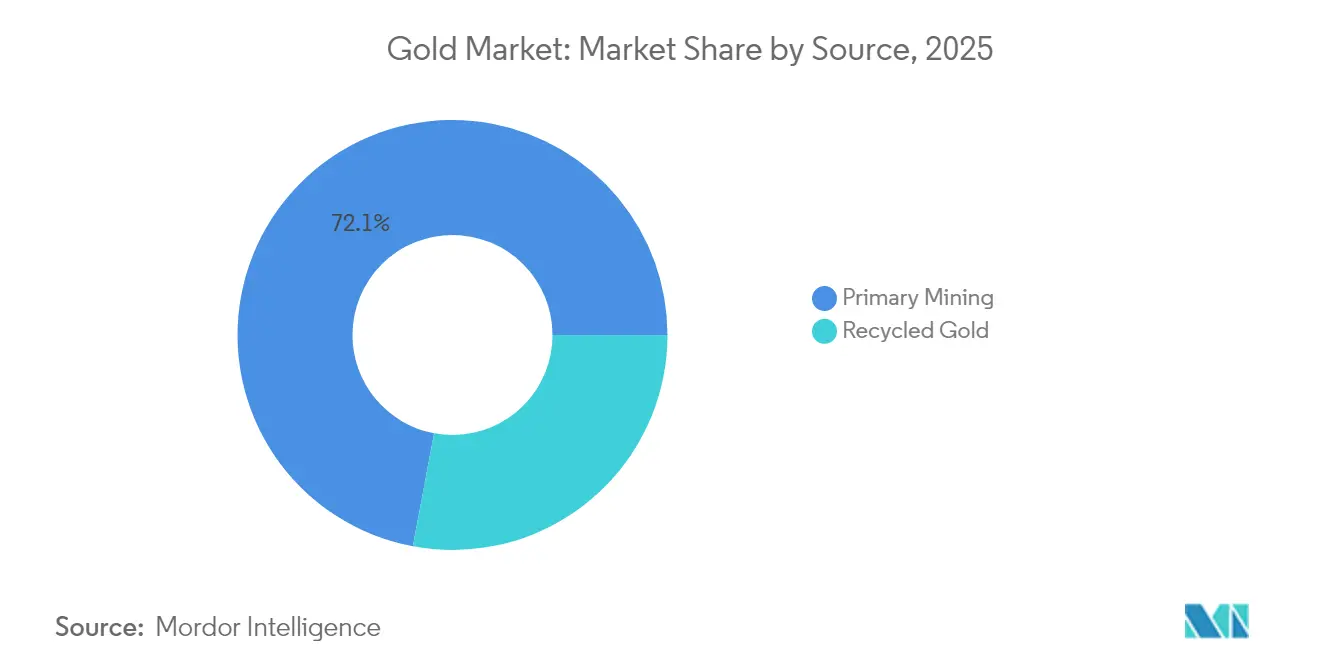
- By source, primary mining led with 72.05% volume share in 2025; recycled gold is forecast to expand at an 7.98% CAGR through 2031.
- By type, alloyed gold accounted for 79.55% share of the Gold market size in 2025, while layered gold applications are projected to grow at a 8.72% CAGR to 2031.
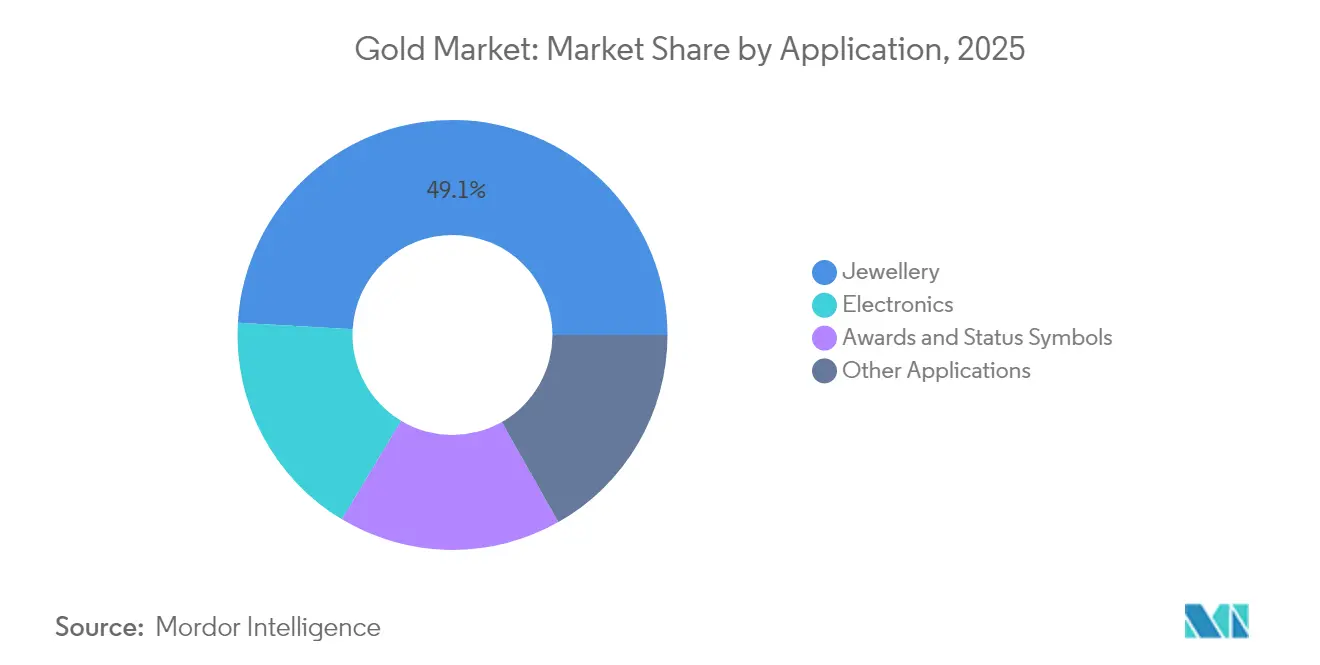
- By application, jewellery held 49.10% of the Gold market share in 2025; electronics is projected to rise at an 8.32% CAGR through 2031.
- By geography, Asia-Pacific captured 59.85% of the Gold market in 2025, and the region is advancing at a 8.95% CAGR to 2031.
Note: Market size and forecast figures in this report are generated using Mordor Intelligence’s proprietary estimation framework, updated with the latest available data and insights as of 2026.
Global Gold Market Trends and Insights
Drivers Impact Analysis*
| Driver | (~) % Impact on CAGR Forecast | Geographic Relevance | Impact Timeline |
|---|---|---|---|
| Surging Retail and ETF Investment Demand in Inflation-hedge Environments | +1.8% | Global, with concentration in North America & EU | Medium term (2-4 years) |
| Central-bank De-dollarization Strategies Accelerating Reserve Diversification | +2.1% | Global, led by APAC and emerging markets | Long term (≥ 4 years) |
| Rising Middle-class Jewellery Demand in India and ASEAN | +1.4% | APAC core, spill-over to MEA | Medium term (2-4 years) |
| AI-Enabled Electronics Driving Ultra-fine Gold Bonding Wire Usage | +0.9% | Global, concentrated in technology hubs | Short term (≤ 2 years) |
| Tokenised Gold Products Expanding Digital Asset Adoption | +0.6% | Asia-Pacific, expanding to global markets | Long term (≥ 4 years) |
| Source: Mordor Intelligence | |||
Surging Retail and ETF Investment Demand in Inflation-Hedge Environments
Persistently high consumer-price levels and doubts over monetary-policy effectiveness have re-anchored gold in diversified portfolios. Gold exchange-traded funds in India attracted INR 112 Billion (USD 1.3 Billion) of net inflows during 2024, the highest annual tally on record [1]World Gold Council, “India Gold ETF Inflows Hit Record,” WORLDGOLDCOUNCIL.ORG. The metal out-performed local equities by 21 percentage points that year, reinforcing its safe-haven status. Portfolio managers in the United States and Europe lifted strategic allocations as real yields turned negative, and survey data show a rising preference for gold when inflation exceeds 4%. Coins and bars remain popular among retail savers seeking physical hedges, and demand proved remarkably inelastic after spot prices broke above USD 2,300 /oz. The structural shift in investment behaviour is expected to keep the market well bid whenever macro volatility spikes.
Central-Bank De-Dollarization Strategies Accelerating Reserve Diversification
Central banks bought more than 1,000 tons of gold in each of the past three calendar years, a historic streak that underscores growing skepticism toward the US dollar’s future dominance. In the World Gold Council’s 2025 survey, 95% of respondents said they would either maintain or increase their bullion holdings, and 43% plan outright additions. China, India, and Turkey led net purchases that together topped 600 tons since 2021, reflecting policy moves to mitigate sanction risk and currency volatility. The dollar’s share of global foreign-exchange reserves slipped to 58.9% by March 2024, its lowest level since modern records began, increasing the attractiveness of gold as a neutral store of value. Active bullion management grew from 37% to 44% of official holdings over 2024-2025, signalling a longer-run structural bid beneath the gold industry.
Rising Middle-Class Jewellery Demand in India and ASEAN
India remained the second-largest gold consumer worldwide in 2025, supported by an expanding middle class and cultural traditions that prioritise gold ornaments during weddings and festivals. Bridal purchases account for roughly half of annual jewellery demand, aided by an average 12 Million weddings each year. New Delhi’s decision to trim import duty from 15% to 6% in 2024 lowered retail prices materially and is projected to add at least 50 tons of incremental demand in the second half of that year. Across ASEAN, rising disposable income and youthful demographics sustain appetite for lightweight contemporary designs that offset higher raw-material costs. Despite cyclical price swings, consumer sentiment surveys reveal that gold remains a preferred store of wealth, underpinning steady volume growth in the gold industry.
AI-Enabled Electronics Driving Ultra-Fine Gold Bonding-Wire Usage
Advanced semiconductor architectures powering artificial-intelligence workloads require ultra-reliable electrical connections, and gold’s unrivalled conductivity and corrosion resistance make it indispensable for bonding wire. Electronics demand for gold rose 9% to 271 tons in 2024 as chip fabricators ramped output of AI accelerators and 5G radios. Smartphone shipments climbed 6%, yet gold content per premium handset increased because higher processing speeds necessitate more robust interconnects. Substitution options are limited after earlier cost-reduction cycles, leading to relatively inelastic industrial demand. Industry consultations indicate that the most sophisticated data-centre processors can contain up to three times the gold used in pre-AI designs. As global compute power doubles every 18 months, technology hubs in East Asia and North America will continue to pull significant volume from the gold industry.
Restraints Impact Analysis*
| Restraint | (~) % Impact on CAGR Forecast | Geographic Relevance | Impact Timeline |
|---|---|---|---|
| Declining Mined Ore-grades Raising AISC Beyond USD 1,450/oz | -1.2% | Global, particularly affecting high-cost jurisdictions | Medium term (2-4 years) |
| ESG-driven Financing Constraints for New Green-field Mines | -0.8% | Global, with emphasis on developed markets | Long term (≥ 4 years) |
| Volatile Import Duties in Key Consuming Nations Curb Jewellery Demand | -0.6% | APAC and emerging markets | Short term (≤ 2 years) |
| Source: Mordor Intelligence | |||
Declining Mined Ore Grades Raising AISC Beyond USD 1,450 /oz
Ore grades continue to fall at mature deposits, forcing operators to process more material to maintain output. Newmont reported its highest cost base in nine years, with all-in sustaining costs at USD 1,651 /oz in Q1 2025, a 29% jump from 2022. Industry-wide all-in sustaining costs (AISC) averaged USD 1,388 /oz in Q2 2024, and North American producers faced an even steeper USD 1,522 /oz. Labour shortages, rising energy prices, and royalty escalators linked to spot quotations intensify cost pressures. Although a record spot price shields margins today, sustained cost inflation squeezes feasibility for marginal pits and accelerates mine closures. Over the medium term, higher cost curves could temper fresh supply and lift the floor under the gold industry.
ESG-Driven Financing Constraints for New Green-Field Mines
Capital allocation now hinges on stringent environmental, social, and governance criteria. Global sustainable investment portfolios reached USD 31 Trillion, and many asset managers restrict lending to projects without credible net-zero pathways. Miners targeting new deposits must prepare robust decarbonisation plans and accept higher upfront expenditure on clean-energy infrastructure. Third-party audits and community-consultation requirements lengthen permitting timelines, while public opposition in developed markets has derailed several projects. Even where resources are high grade, developers struggle to secure equity at viable valuations, shifting attention toward brownfield expansions and recycling alternatives. These financing headwinds could restrain mined output growth and tighten the long-run balance in the gold market.
*Our forecasts treat driver/restraint impacts as directional, not additive. The impact forecasts reflect baseline growth, mix effects, and variable interactions.
Segment Analysis
By Source: Primary Mining Retains Scale Advantage as Recycling Accelerates
Primary extraction occupied 72.05% of the Gold market share in 2025, confirming that large-scale open-pit and underground mines remain the backbone of supply. The segment benefits from established logistics, skilled labour pools, and long-term offtake contracts that stabilise throughput even when ore grades erode. However, all-in sustaining costs rising above USD 1,388 /oz signal diminishing returns on fresh capital, and companies have intensified exploration around existing hubs to leverage sunk infrastructure.
Recycling, though only 27.95% of supply, is marching forward at an 7.98% CAGR to 2031, the fastest rate of any source segment. The Royal Mint’s South Wales facility processes 4,000 tons of circuit boards annually using patented hydrometallurgical techniques with 99% recovery efficiency . Energy demand for recycling is roughly 300 times lower than for green-field mining, lowering carbon intensity and aligning with Environmental, Social, and Governance (ESG) mandates. Luxury-goods leader Pandora pledged to use 100% recycled precious metals by 2025, creating pull for scrap flows. As more jurisdictions tighten e-waste rules, secondary feedstock will become a strategic pillar in the Gold industry.


By Type: Alloyed Gold Dominates, but Layered Applications Gain Momentum
Alloyed compositions captured the bulk 79.55% share of the Gold market size in 2025 because jewellery, coinage, and many industrial products require mechanical strength and opacity that pure metal lacks. The segment enjoys process familiarity and broad supplier networks, keeping unit costs comparatively low. Automotive sensors and dental alloys also favour alloyed material for wear resistance, sustaining wide demand beyond ornamental uses.
Layered applications are the growth engine, advancing at 8.72% CAGR. Semiconductor packaging, high-frequency connectors, and aerospace sensors demand atomically thin, uniform coatings that only layered deposition can deliver. Technology manufacturers invested heavily in physical-vapor-deposition and electroplating capacity during 2024-2025, responding to AI server orders that doubled quarterly. European Union (EU) automotive-safety directives mandate redundant sensors, further lifting the adoption of layered gold, where failure tolerance must approach six-sigma. As miniaturisation in electronics marches on, the layered-gold niche will claim incremental share from alloyed material within the Gold market.
By Application: Electronics Momentum Outpaces Jewelry Tradition
Jewelry remained the largest application at 49.10% of 2025 volume, underpinned by cultural affinity in Asia and the Middle East. Record prices trimmed average gram weights, yet retailers successfully marketed lighter, contemporary pieces to preserve sales volumes. In the gold market, the segment’s resilience is aided by wedding-driven purchases that fulfil social obligations regardless of price.
Electronics achieved the fastest expansion, charting an 8.32% CAGR that reflects insatiable demand for AI-equipped devices and high-speed networking gear. Gold content per advanced graphics-processing unit rose 15% in 2024 because ultra-fine bonding wire ensures signal integrity at higher clock frequencies. Medical devices and aerospace avionics, both severe-environment applications, also require gold for biocompatibility and corrosion resistance. Other uses, from dental implants to bullion-backed credit cards, contribute niche but stable volumes, benefiting from gold’s non-reactive properties. This trend underscores how industrial demand within the gold industry continues to expand.
Geography Analysis
Asia-Pacific held 59.85% of the Gold industry in 2025 and is projected to grow with a 8.95% CAGR through 2031. China mined 403 tons in 2024, retaining pole position in production while its central bank lifted official holdings for the 19th consecutive month. India’s Reserve Bank expanded bullion reserves to 880 tons by July 2025, and consumer demand rebounded once import duties fell. Indonesia, Thailand, and Vietnam posted double-digit percentage gains in jewelry offtake, reflecting rising disposable income and a preference for gold as a liquid savings vehicle.
North America and Europe exhibit mature demand profiles yet see renewed investor interest as real yields gyrate. US-listed gold Exchange Traded Funds (ETFs) added 152 tons during 2024, reversing two years of net outflows, while European funds absorbed 98 tons amid heightened energy-price volatility. Canadian mines contributed 175 t of output, led by the Detour Lake expansion that reached full capacity in Q4 2024. Within the gold industry, the region’s regulatory stability and access to capital markets encourage brownfield expansions that help offset grade decline elsewhere. Latin America and Africa remain pivotal on the supply side. Peru and Brazil delivered a combined 290 tons in 2024, though social protests in Peru intermittently halted logistics movements. Ghana overtook South Africa as the continent’s top producer, shipping 129 tons, aided by streamlined permitting under its 2024 Mining Investment Bill. Several African central banks announced plans to raise gold holdings to at least 10% of reserves, a move that could redirect part of regional output toward domestic vaults rather than export channels. Middle Eastern demand ticked higher as Gulf Cooperation Council states promoted gold-based savings products aligned with Sharia principles, enhancing retail participation in the Gold industry.

Competitive Landscape
The Gold market is fragmented in nature. Newmont Corporation and Barrick Mining Corporation still control tier-one assets but struggle with cost inflation, prompting them to rationalise non-core mines. Royal Gold advanced a USD 3.7 Billion double acquisition of Sandstorm Gold and Horizon Copper to deepen its royalty portfolio. Equinox Gold Corp.’s 2025 takeover of Calibre created a 1.2 Million-ounce producer focused on lower-jurisdictional-risk Americas assets, reflecting a strategic pivot toward political stability. Junior developers face capital scarcity under stringent ESG screens, while recycling specialists secure impact-investing funds by highlighting circular-economy credentials. As investors place premiums on sustainability disclosures, companies that combine cost discipline with environmental stewardship are positioned to outperform peers in the evolving gold industry.
Gold Industry Leaders
Agnico Eagle Mines Limited
Newmont Corporation
PJSC Polyus
Barrick Mining Corporation
AnglogoldAshanti
- *Disclaimer: Major Players sorted in no particular order

Recent Industry Developments
- July 2025: Discovery Silver announced that it is in advanced talks to acquire Barrick Mining Corporation's Hemlo gold mine, a historic Canadian operation that has produced over 21 Million ounces of gold in over 30 years.
- June 2025: Equinox Gold Corp. acquired Calibre Mining Corp., forming an Americas-focused gold producer with operations in five countries. This acquisition included two Canadian gold mines, the Greenstone Gold Mine in Ontario and the Valentine Gold Mine in Newfoundland and Labrador.


Global Gold Market Report Scope
Gold has the chemical symbol Au (from the Latin word aurum) and the atomic number 79. As a result, it is one of the highest atomic number elements found in nature. In its pure state, it is a brilliant, somewhat orange-yellow, dense, soft, malleable, and ductile metal. Traditionally, gold has been used to make coins, bullion, and jewelry, but recently, it has been used in a variety of applications, including dentistry, electronics, and aerospace.
The gold market is segmented by type, application, and geography. By type, the market is segmented into alloyed gold and layered gold. By application, the market is segmented into jewelry, electronics, awards, status symbols, and other applications (dentistry and aerospace). The report also covers the market size and forecasts for the gold market in 15 countries across the studied regions.
For each segment, the market sizing and forecasts have been done on the basis of volume (tons).
| Primary Mining |
| Recycled Gold |
| Alloyed Gold |
| Layered Gold |
| Jewellery |
| Electronics |
| Awards and Status Symbols |
| Other Applications (Dental, Aerospace, etc.) |
| Production Analysis | United States | |
| Australia | ||
| Brazil | ||
| Burkina Faso | ||
| Canada | ||
| China | ||
| Colombia | ||
| Ghana | ||
| Indonesia | ||
| Kazakhstan | ||
| Mali | ||
| Mexico | ||
| Papua New Guinea | ||
| Peru | ||
| Russia | ||
| South Africa | ||
| Sudan | ||
| Tanzania | ||
| Uzbekistan | ||
| Other countries | ||
| Consumption Analysis | Asia-Pacific | China |
| India | ||
| Japan | ||
| South Korea | ||
| Rest of Asia-Pacific | ||
| North America | United States | |
| Canada | ||
| Mexico | ||
| Europe | Germany | |
| United Kingdom | ||
| Italy | ||
| France | ||
| Rest of Europe | ||
| South America | Brazil | |
| Argentina | ||
| Rest of South America | ||
| Middle East and Africa | Saudi Arabia | |
| South Africa | ||
| Rest of Middle East and Africa | ||
| By Source | Primary Mining | ||
| Recycled Gold | |||
| By Type | Alloyed Gold | ||
| Layered Gold | |||
| By Application | Jewellery | ||
| Electronics | |||
| Awards and Status Symbols | |||
| Other Applications (Dental, Aerospace, etc.) | |||
| By Geography | Production Analysis | United States | |
| Australia | |||
| Brazil | |||
| Burkina Faso | |||
| Canada | |||
| China | |||
| Colombia | |||
| Ghana | |||
| Indonesia | |||
| Kazakhstan | |||
| Mali | |||
| Mexico | |||
| Papua New Guinea | |||
| Peru | |||
| Russia | |||
| South Africa | |||
| Sudan | |||
| Tanzania | |||
| Uzbekistan | |||
| Other countries | |||
| Consumption Analysis | Asia-Pacific | China | |
| India | |||
| Japan | |||
| South Korea | |||
| Rest of Asia-Pacific | |||
| North America | United States | ||
| Canada | |||
| Mexico | |||
| Europe | Germany | ||
| United Kingdom | |||
| Italy | |||
| France | |||
| Rest of Europe | |||
| South America | Brazil | ||
| Argentina | |||
| Rest of South America | |||
| Middle East and Africa | Saudi Arabia | ||
| South Africa | |||
| Rest of Middle East and Africa | |||


Key Questions Answered in the Report
How Big is the Gold Market?
The Gold market is forecast to grow at a 7.30% CAGR, climbing from 5.1 kilo tons in 2026 to 7.25 kilo tons by 2031.
Which region leads consumption in the Gold market?
Asia-Pacific dominates with 59.85% of volume in 2025 and is also the fastest-growing region at a 8.95% CAGR through 2031.
How large is the recycled Gold segment and how fast is it growing?
Recycled gold supplied 27.95% of global volumes in 2025 and is expanding at an 7.98% CAGR as sustainability mandates gain momentum.
Why is electronics the fastest-growing application for gold?
AI-driven semiconductor demand requires ultra-fine gold bonding wire and layered coatings, pushing electronics-segment volume up at an 8.32% CAGR.
What role do central banks play in the Gold market today?
Central banks have purchased more than 1,000 tons annually for three straight years and 95% plan to maintain or increase holdings, underscoring a long-run structural bid.
Page last updated on:


